ACC506 Financial Analysis: Accounting Services PTY LTD Report

Verified

Added on  2023/06/04

|8
|1005
|282
Report
AI Summary
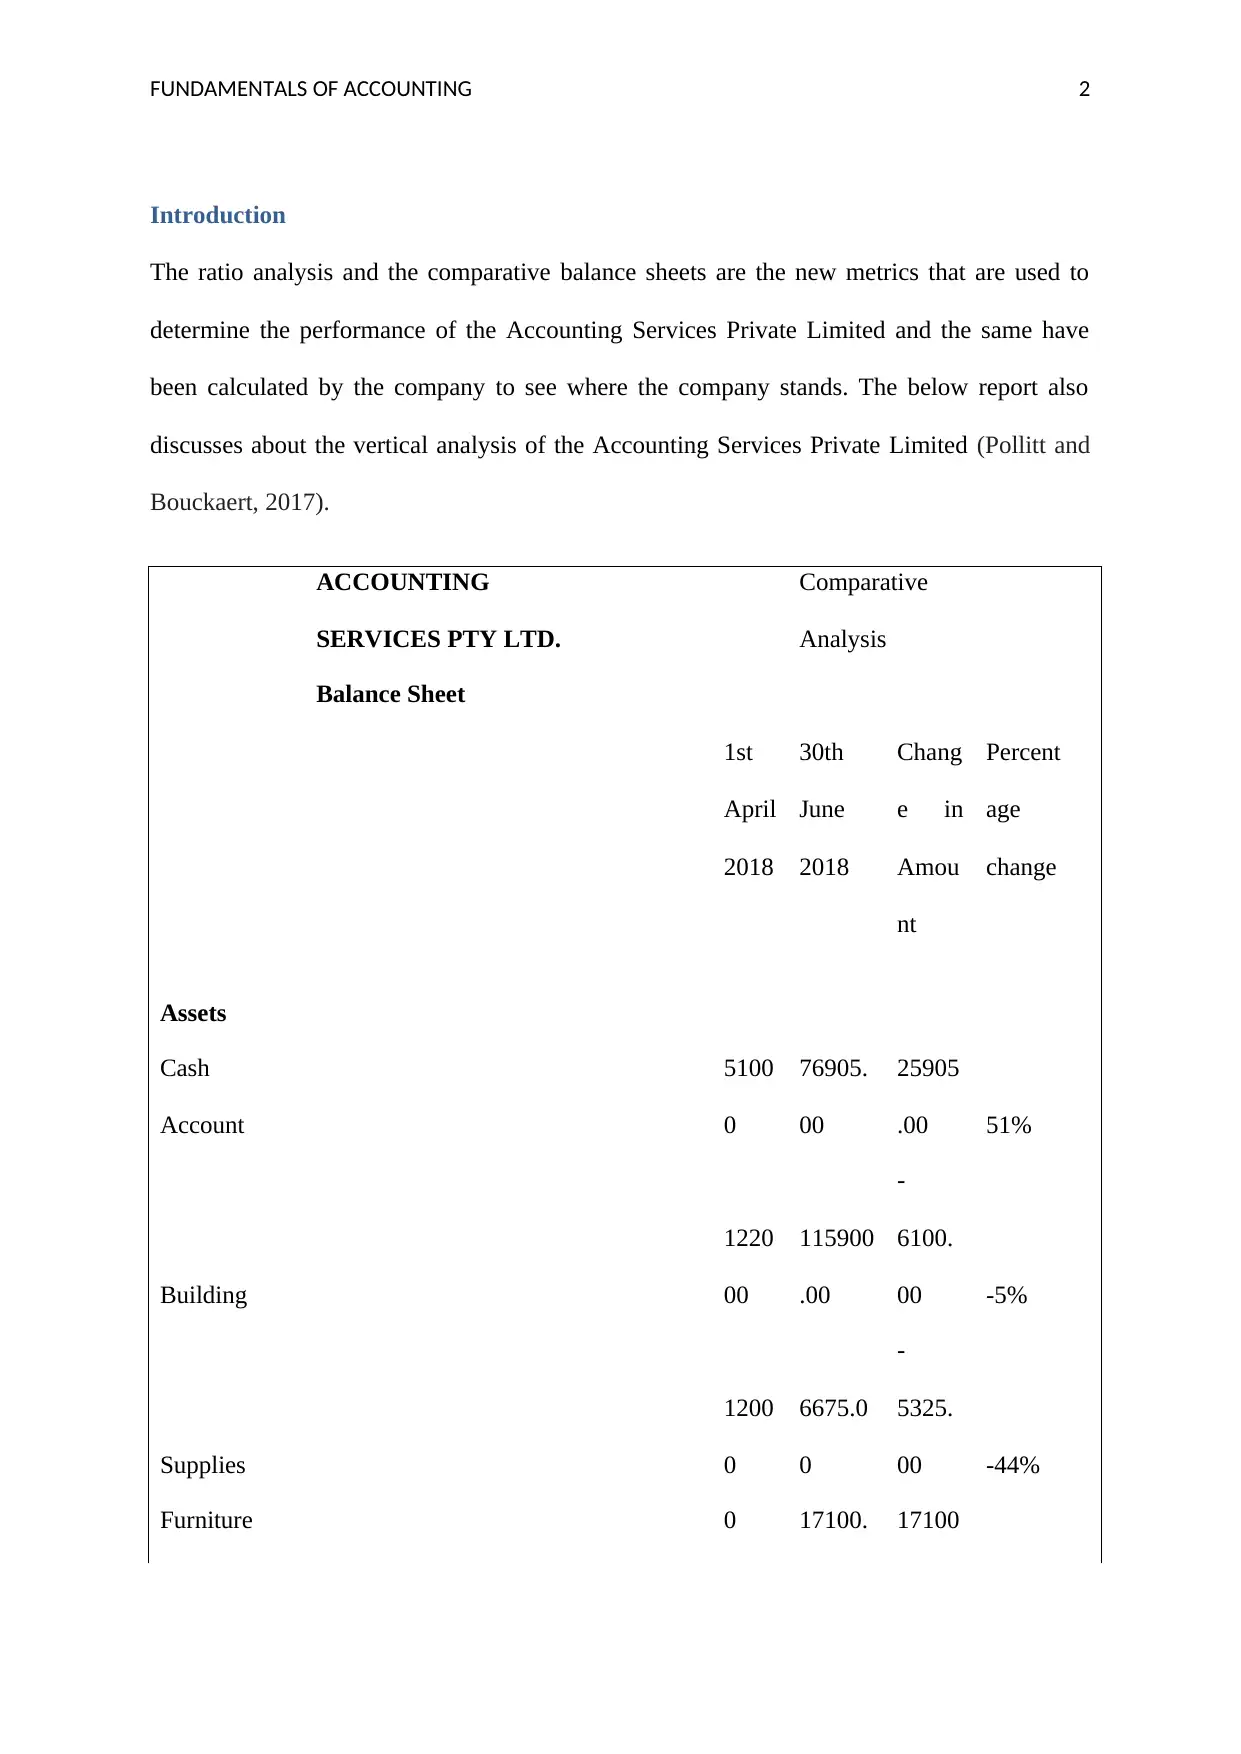
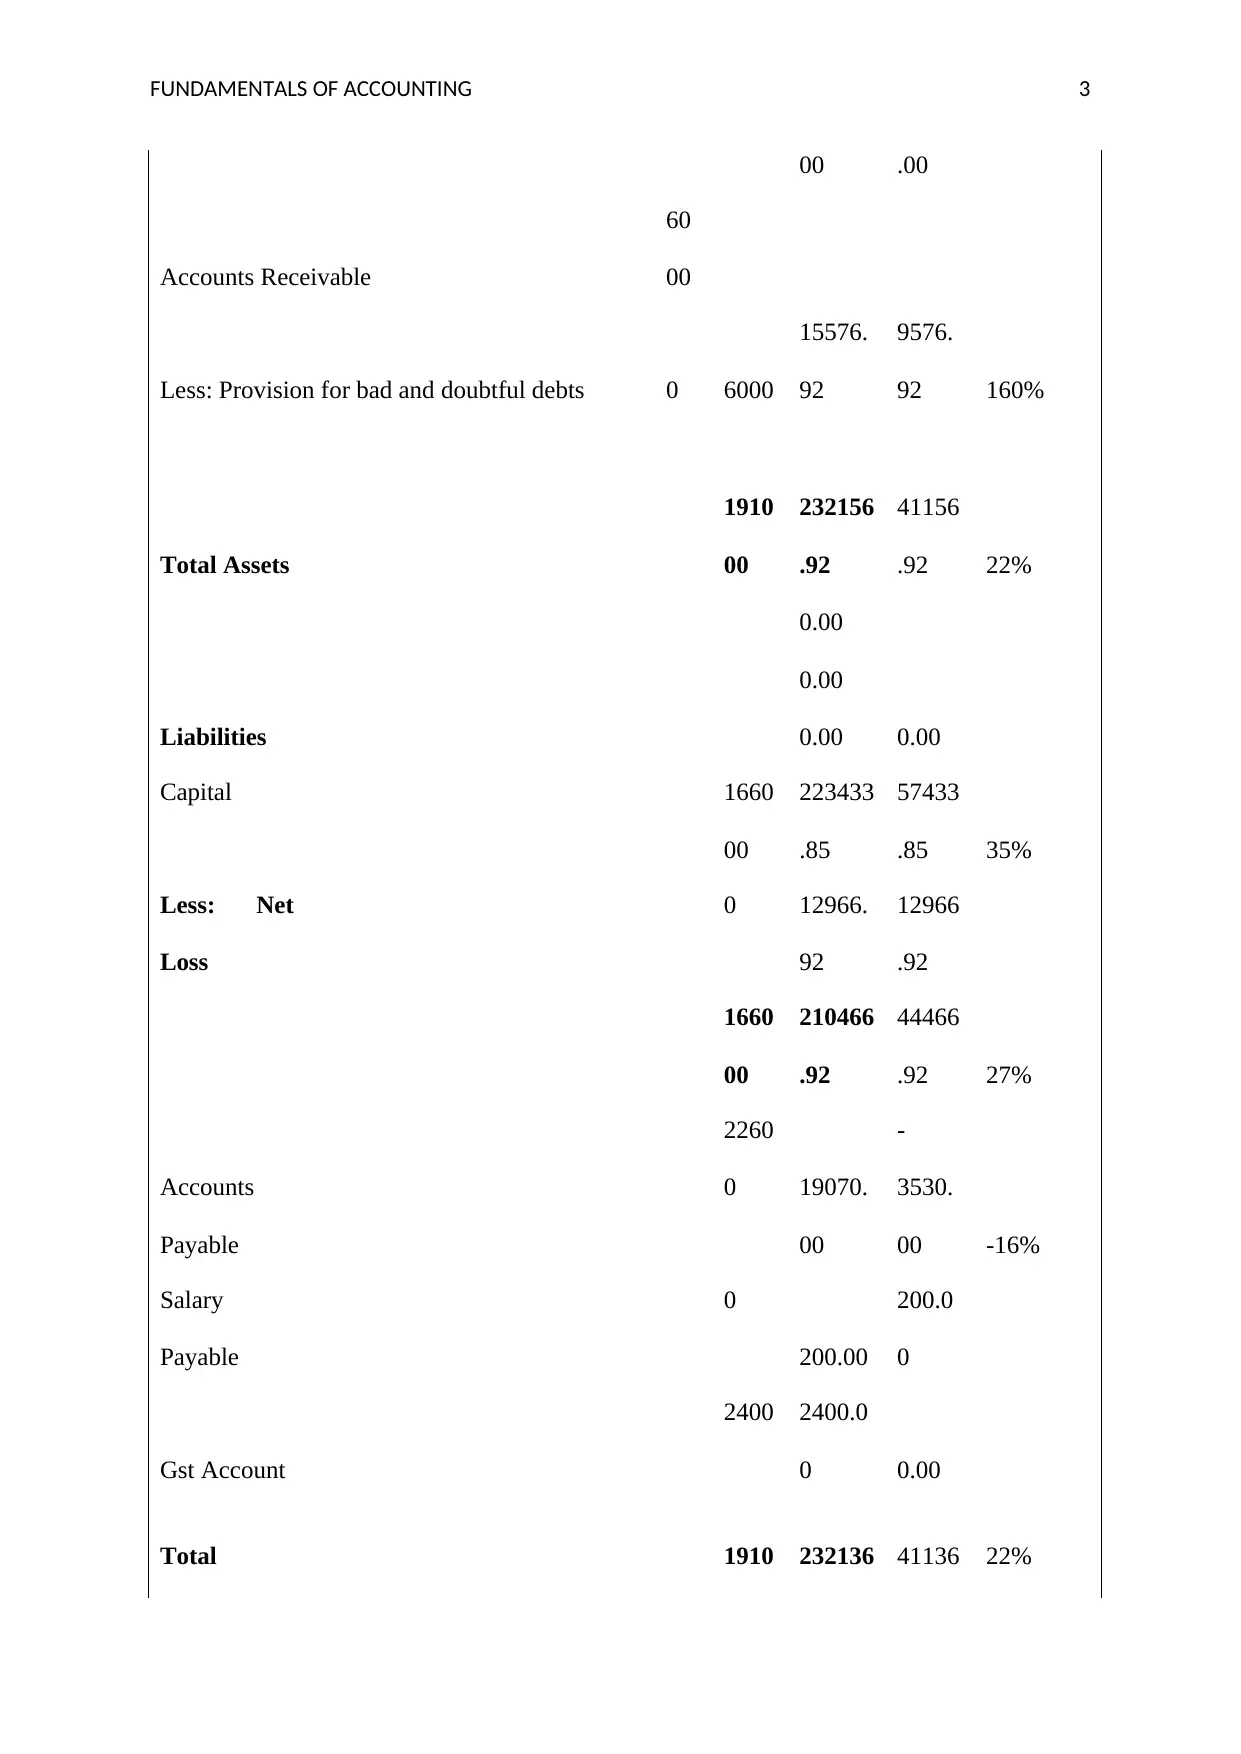
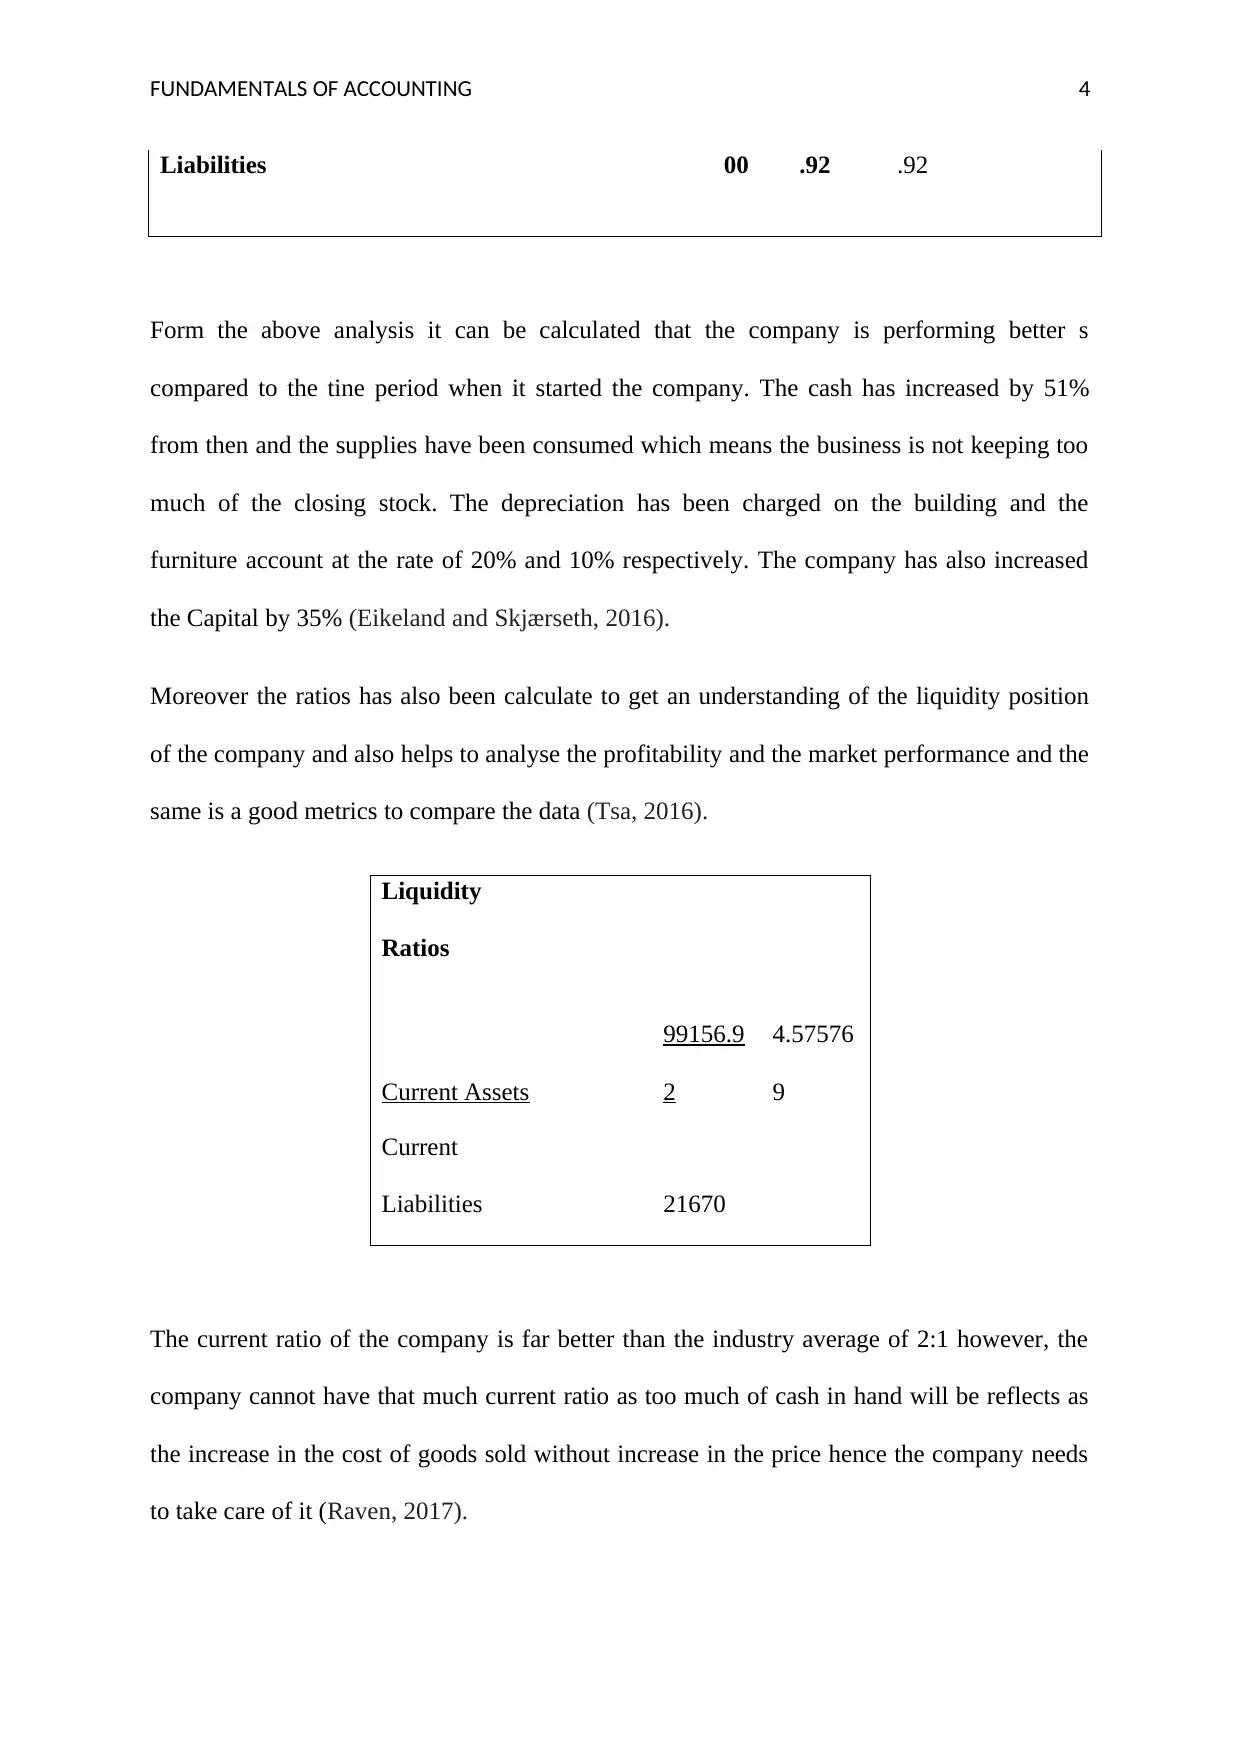
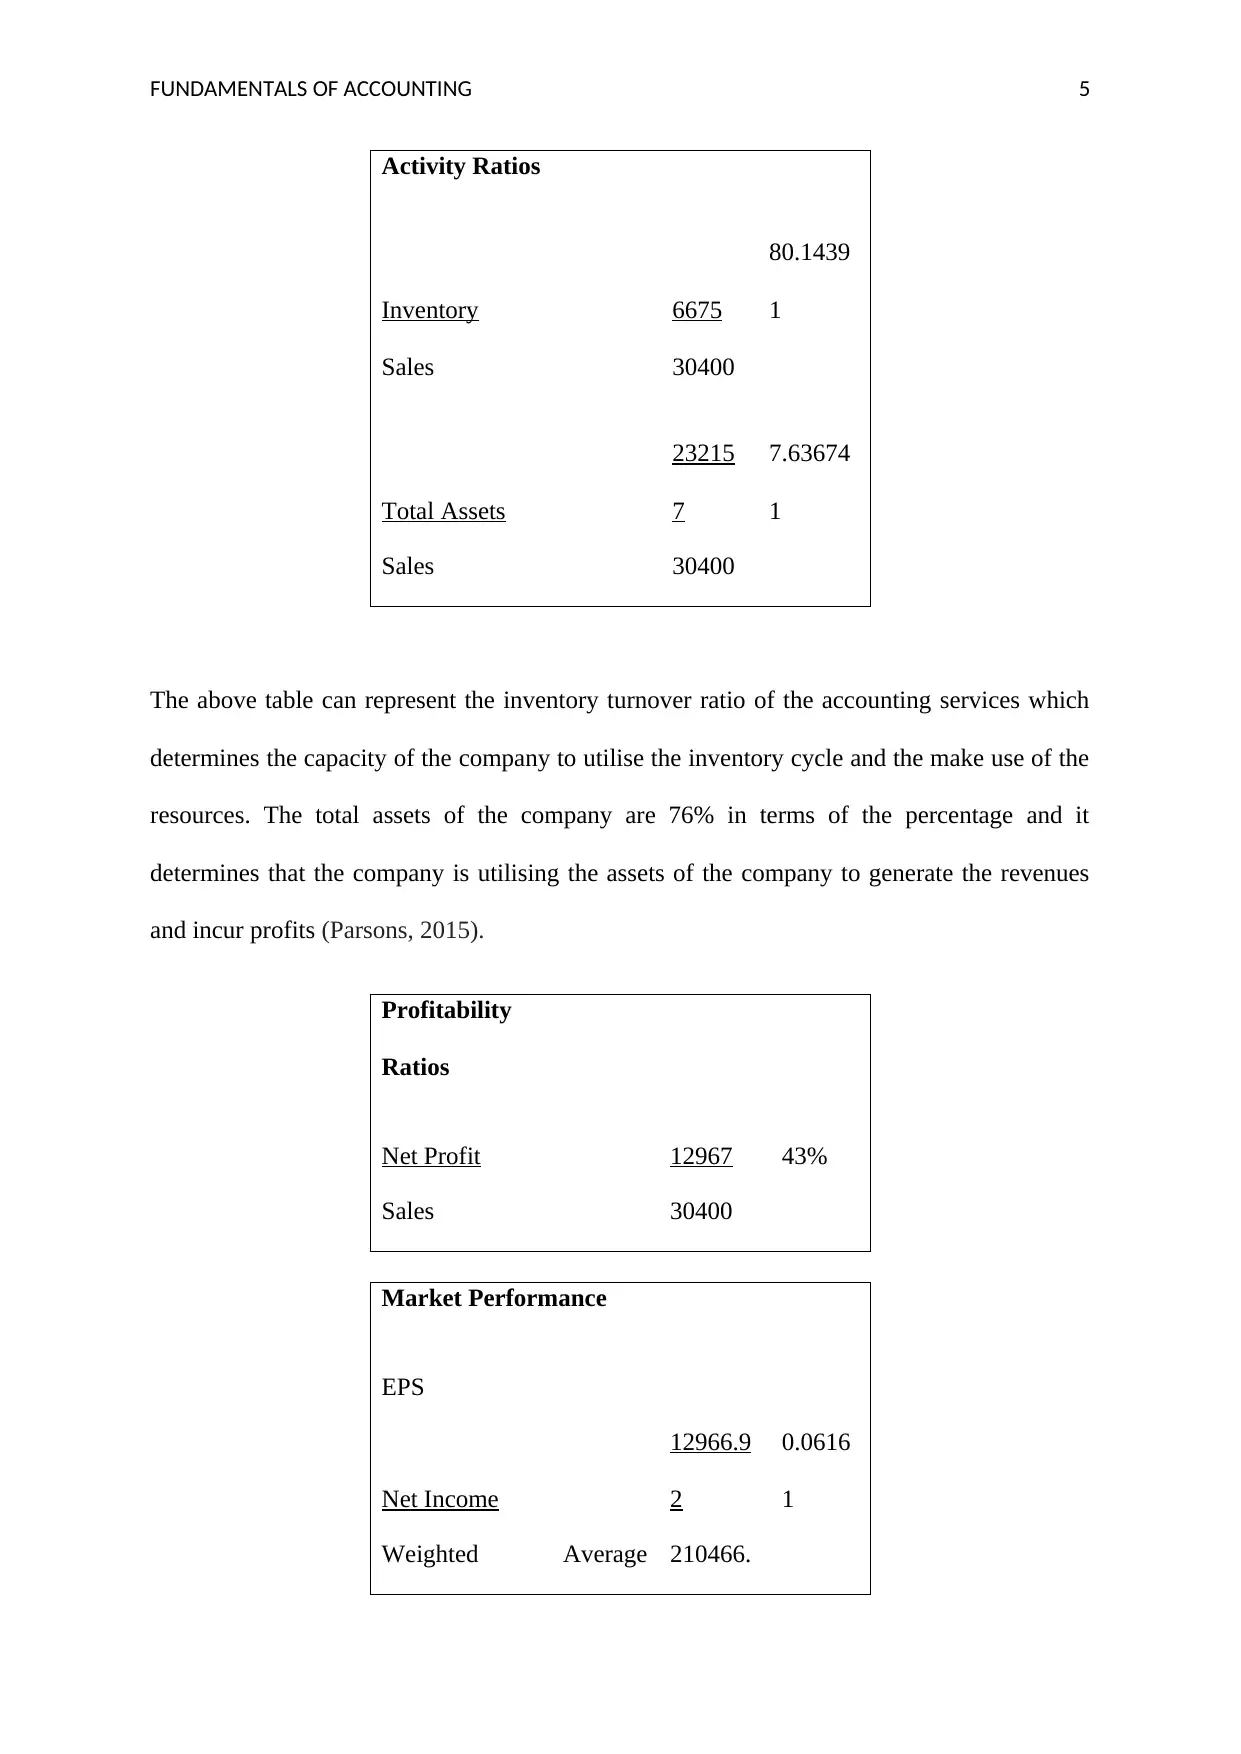
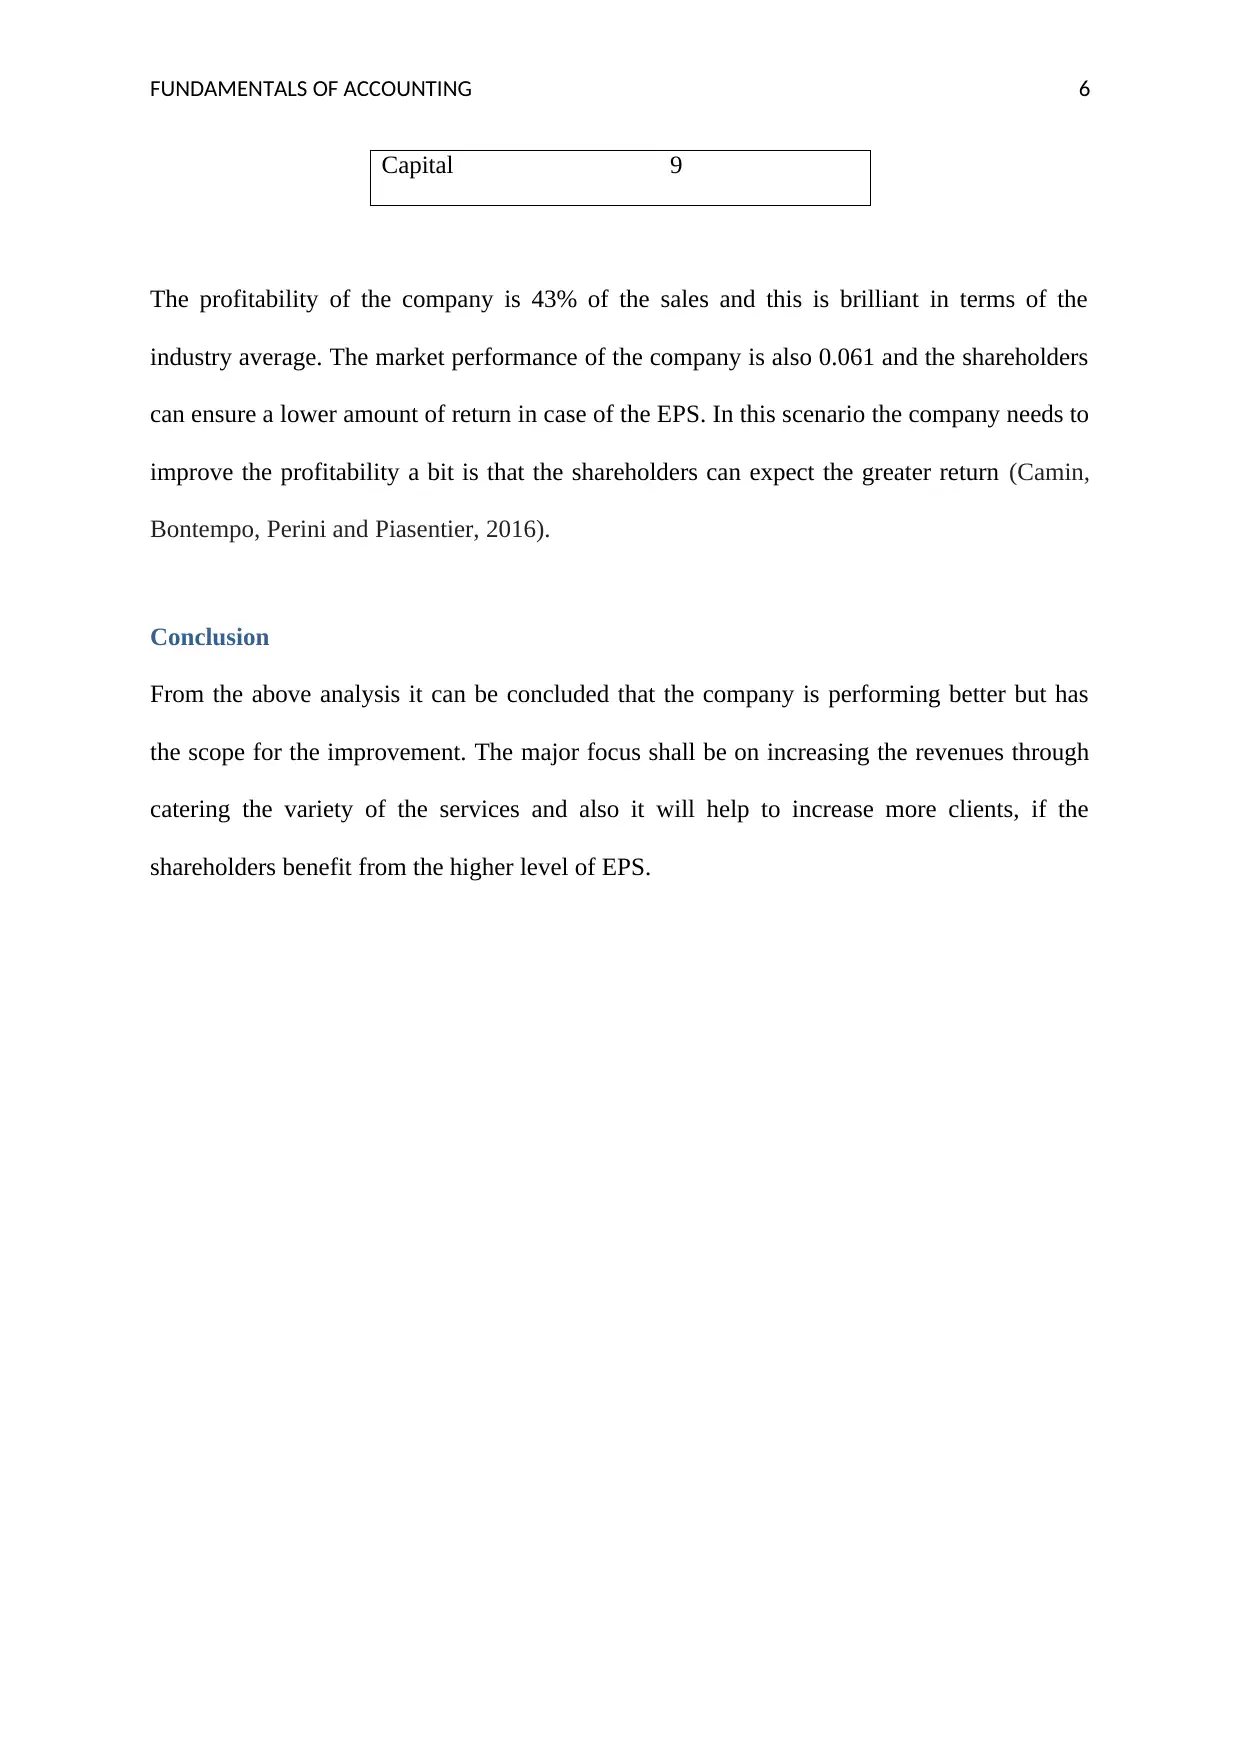
This report presents a financial analysis of Accounting Services Private Limited, utilizing ratio analysis and comparative balance sheets to assess the company's performance. It includes a vertical analysis, liquidity ratios, activity ratios, and profitability ratios to provide a comprehensive understanding of the company's financial health. The analysis reveals improvements in cash flow and capital, but also identifies areas for potential growth, such as increasing revenues and improving shareholder returns. The report concludes that while the company is performing well, there is still scope for improvement through strategic adjustments.
tabler-icon-diamond-filled.svg

Contribute Materials

Your contribution can guide someone’s learning journey. Share your documents today.
Document Page
Running Head: FUNDAMENTALS OF ACCOUNTING 0
FUNDAMENTALS OF ACCOUNTING
tabler-icon-diamond-filled.svg

Secure Best Marks with AI Grader

Need help grading? Try our AI Grader for instant feedback on your assignments.
Document Page
FUNDAMENTALS OF ACCOUNTING 1
Table of Contents
Introduction................................................................................................................................2
Conclusion..................................................................................................................................6
References..................................................................................................................................7
Document Page
FUNDAMENTALS OF ACCOUNTING 2
Introduction
The ratio analysis and the comparative balance sheets are the new metrics that are used to
determine the performance of the Accounting Services Private Limited and the same have
been calculated by the company to see where the company stands. The below report also
discusses about the vertical analysis of the Accounting Services Private Limited (Pollitt and
Bouckaert, 2017).
ACCOUNTING
SERVICES PTY LTD.
Comparative
Analysis
Balance Sheet
1st
April
2018
30th
June
2018
Chang
e in
Amou
nt
Percent
age
change
Assets
Cash
Account
5100
0
76905.
00
25905
.00 51%
Building
1220
00
115900
.00
-
6100.
00 -5%
Supplies
1200
0
6675.0
0
-
5325.
00 -44%
Furniture 0 17100. 17100
Document Page
FUNDAMENTALS OF ACCOUNTING 3
00 .00
Accounts Receivable
60
00
Less: Provision for bad and doubtful debts 0 6000
15576.
92
9576.
92 160%
Total Assets
1910
00
232156
.92
41156
.92 22%
0.00
0.00
Liabilities 0.00 0.00
Capital 1660
00
223433
.85
57433
.85 35%
Less: Net
Loss
0 12966.
92
12966
.92
1660
00
210466
.92
44466
.92 27%
Accounts
Payable
2260
0 19070.
00
-
3530.
00 -16%
Salary
Payable
0
200.00
200.0
0
Gst Account
2400 2400.0
0 0.00
Total 1910 232136 41136 22%
tabler-icon-diamond-filled.svg

Secure Best Marks with AI Grader

Need help grading? Try our AI Grader for instant feedback on your assignments.
Document Page
FUNDAMENTALS OF ACCOUNTING 4
Liabilities 00 .92 .92
Form the above analysis it can be calculated that the company is performing better s
compared to the tine period when it started the company. The cash has increased by 51%
from then and the supplies have been consumed which means the business is not keeping too
much of the closing stock. The depreciation has been charged on the building and the
furniture account at the rate of 20% and 10% respectively. The company has also increased
the Capital by 35% (Eikeland and Skjærseth, 2016).
Moreover the ratios has also been calculate to get an understanding of the liquidity position
of the company and also helps to analyse the profitability and the market performance and the
same is a good metrics to compare the data (Tsa, 2016).
Liquidity
Ratios
Current Assets
99156.9
2
4.57576
9
Current
Liabilities 21670
The current ratio of the company is far better than the industry average of 2:1 however, the
company cannot have that much current ratio as too much of cash in hand will be reflects as
the increase in the cost of goods sold without increase in the price hence the company needs
to take care of it (Raven, 2017).
Document Page
FUNDAMENTALS OF ACCOUNTING 5
Activity Ratios
Inventory 6675
80.1439
1
Sales 30400
Total Assets
23215
7
7.63674
1
Sales 30400
The above table can represent the inventory turnover ratio of the accounting services which
determines the capacity of the company to utilise the inventory cycle and the make use of the
resources. The total assets of the company are 76% in terms of the percentage and it
determines that the company is utilising the assets of the company to generate the revenues
and incur profits (Parsons, 2015).
Profitability
Ratios
Net Profit 12967 43%
Sales 30400
Market Performance
EPS
Net Income
12966.9
2
0.0616
1
Weighted Average 210466.
Document Page
FUNDAMENTALS OF ACCOUNTING 6
Capital 9
The profitability of the company is 43% of the sales and this is brilliant in terms of the
industry average. The market performance of the company is also 0.061 and the shareholders
can ensure a lower amount of return in case of the EPS. In this scenario the company needs to
improve the profitability a bit is that the shareholders can expect the greater return (Camin,
Bontempo, Perini and Piasentier, 2016).
Conclusion
From the above analysis it can be concluded that the company is performing better but has
the scope for the improvement. The major focus shall be on increasing the revenues through
catering the variety of the services and also it will help to increase more clients, if the
shareholders benefit from the higher level of EPS.
tabler-icon-diamond-filled.svg

Paraphrase This Document

Need a fresh take? Get an instant paraphrase of this document with our AI Paraphraser
Document Page
FUNDAMENTALS OF ACCOUNTING 7
References
Camin, F., Bontempo, L., Perini, M. and Piasentier, E., (2016) Stable isotope ratio analysis
for assessing the authenticity of food of animal origin. Comprehensive Reviews in Food
Science and Food Safety, 15(5), pp.868-877.
Eikeland, P.O. and Skjærseth, J.B., (2016) Comparative Analysis. In Corporate Responses to
EU Emissions Trading(pp. 271-300). California: Routledge.
Parsons, B.A., Marney, L.C., Siegler, W.C., Hoggard, J.C., Wright, B.W. and Synovec, R.E.,
(2015) Tile-based Fisher ratio analysis of comprehensive two-dimensional gas
chromatography time-of-flight mass spectrometry (GC× GC–TOFMS) data using a null
distribution approach. Analytical chemistry, 87(7), pp.3812-3819.
Pollitt, C. and Bouckaert, G., (2017) Public management reform: a comparative analysis-into
the age of austerity. London: Oxford University Press.
Raven, B.H., (2017) The comparative analysis of power and power preference. In Social
power and political influence (pp. 172-198). California: Routledge.
Tsai, J., Bertoni, D., Hernandez-Boussard, T., Telli, M.L. and Wapnir, I.L., (2016) Lymph
node ratio analysis after neoadjuvant chemotherapy is prognostic in hormone receptor-
positive and triple-negative breast cancer. Annals of surgical oncology, 23(10), pp.3310-
3316.
chevron_up_icon
1 out of 8
circle_padding
hide_on_mobile
zoom_out_icon
logo.png

Your All-in-One AI-Powered Toolkit for Academic Success.

Available 24*7 on WhatsApp / Email

[object Object]