Accounting and Making Financial Decision: Bank Performance Analysis
VerifiedAdded on 2020/10/04
|9
|1768
|253
Report
AI Summary
This report analyzes the financial performance of National Australian Bank (NAB), Westpac Banking Corporation (WBC), and ANZ over the period of 2016-2018. The analysis includes a horizontal and vertical comparison of net profits, revealing significant shifts in NAB's performance due to changes in revenue and non-interest income. The report evaluates financial liquidity using debt-equity ratios and financial leverage, highlighting differences in capital structure among the banks. The study advises NAB's manager on investment decisions, emphasizing the importance of a diversified portfolio that includes both foreign and domestic investments to mitigate risk. The conclusion summarizes the importance of accounting in business decision-making, noting WBC's consistent net income leadership, and the improved strategies adopted by NAB. The report uses data from annual reports to support its findings.

ACCOUNTING AND MAKING
FINANCIAL DECISION
FINANCIAL DECISION
Paraphrase This Document
Need a fresh take? Get an instant paraphrase of this document with our AI Paraphraser
TABLE OF CONTENTS
INTRODUCTION...........................................................................................................................1
1. Summarising net profit attained by banks with horizontal and vertical comparison..............1
2. Evaluating financial liquidity of each bank with horizontal and vertical comparison............3
3. Advising manager of NAB to undertake investment decisions on basis of common features
of investment...............................................................................................................................5
CONCLUSION................................................................................................................................5
REFERENCES................................................................................................................................7
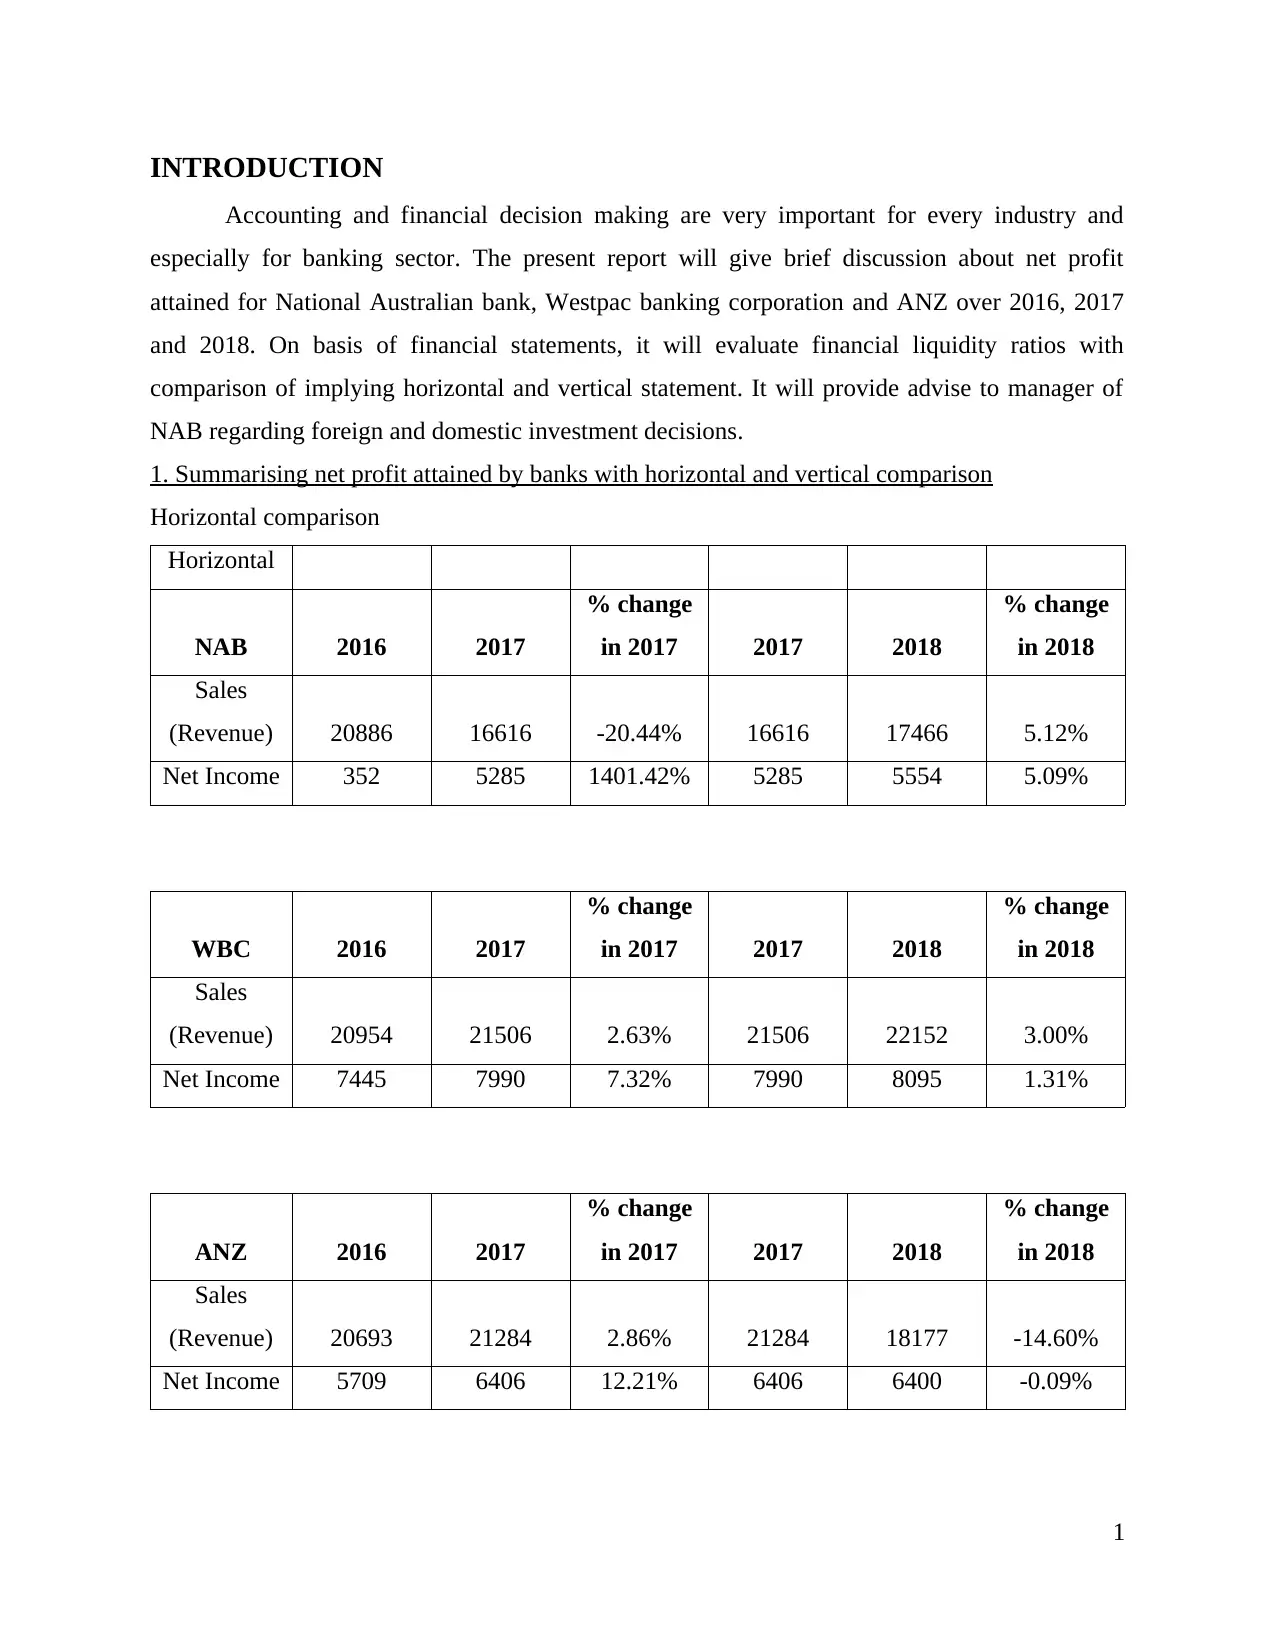
INTRODUCTION
Accounting and financial decision making are very important for every industry and
especially for banking sector. The present report will give brief discussion about net profit
attained for National Australian bank, Westpac banking corporation and ANZ over 2016, 2017
and 2018. On basis of financial statements, it will evaluate financial liquidity ratios with
comparison of implying horizontal and vertical statement. It will provide advise to manager of
NAB regarding foreign and domestic investment decisions.
1. Summarising net profit attained by banks with horizontal and vertical comparison
Horizontal comparison
Horizontal
NAB 2016 2017
% change
in 2017 2017 2018
% change
in 2018
Sales
(Revenue) 20886 16616 -20.44% 16616 17466 5.12%
Net Income 352 5285 1401.42% 5285 5554 5.09%
WBC 2016 2017
% change
in 2017 2017 2018
% change
in 2018
Sales
(Revenue) 20954 21506 2.63% 21506 22152 3.00%
Net Income 7445 7990 7.32% 7990 8095 1.31%
ANZ 2016 2017
% change
in 2017 2017 2018
% change
in 2018
Sales
(Revenue) 20693 21284 2.86% 21284 18177 -14.60%
Net Income 5709 6406 12.21% 6406 6400 -0.09%
1
⊘ This is a preview!⊘
Do you want full access?
Subscribe today to unlock all pages.
Trusted by 1+ million students worldwide
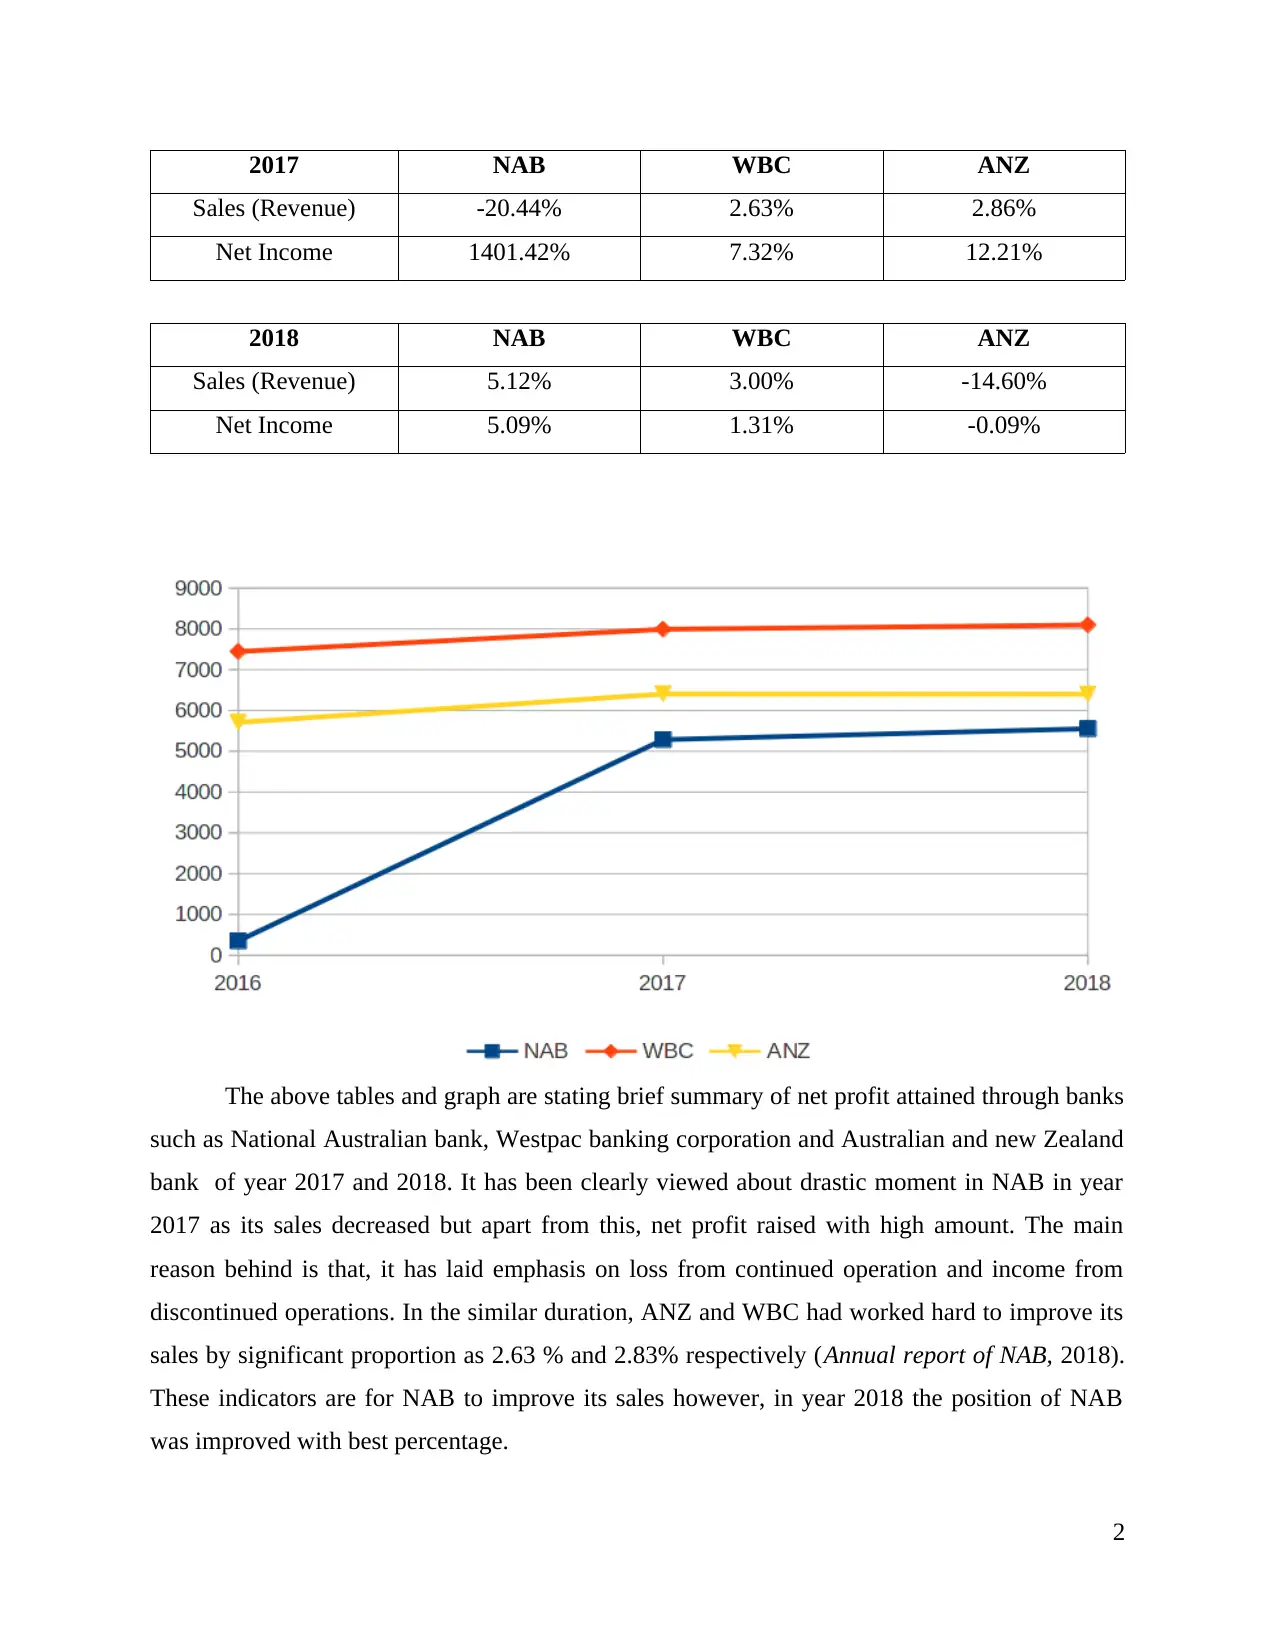
2017 NAB WBC ANZ
Sales (Revenue) -20.44% 2.63% 2.86%
Net Income 1401.42% 7.32% 12.21%
2018 NAB WBC ANZ
Sales (Revenue) 5.12% 3.00% -14.60%
Net Income 5.09% 1.31% -0.09%
The above tables and graph are stating brief summary of net profit attained through banks
such as National Australian bank, Westpac banking corporation and Australian and new Zealand
bank of year 2017 and 2018. It has been clearly viewed about drastic moment in NAB in year
2017 as its sales decreased but apart from this, net profit raised with high amount. The main
reason behind is that, it has laid emphasis on loss from continued operation and income from
discontinued operations. In the similar duration, ANZ and WBC had worked hard to improve its
sales by significant proportion as 2.63 % and 2.83% respectively (Annual report of NAB, 2018).
These indicators are for NAB to improve its sales however, in year 2018 the position of NAB
was improved with best percentage.
2
Paraphrase This Document
Need a fresh take? Get an instant paraphrase of this document with our AI Paraphraser
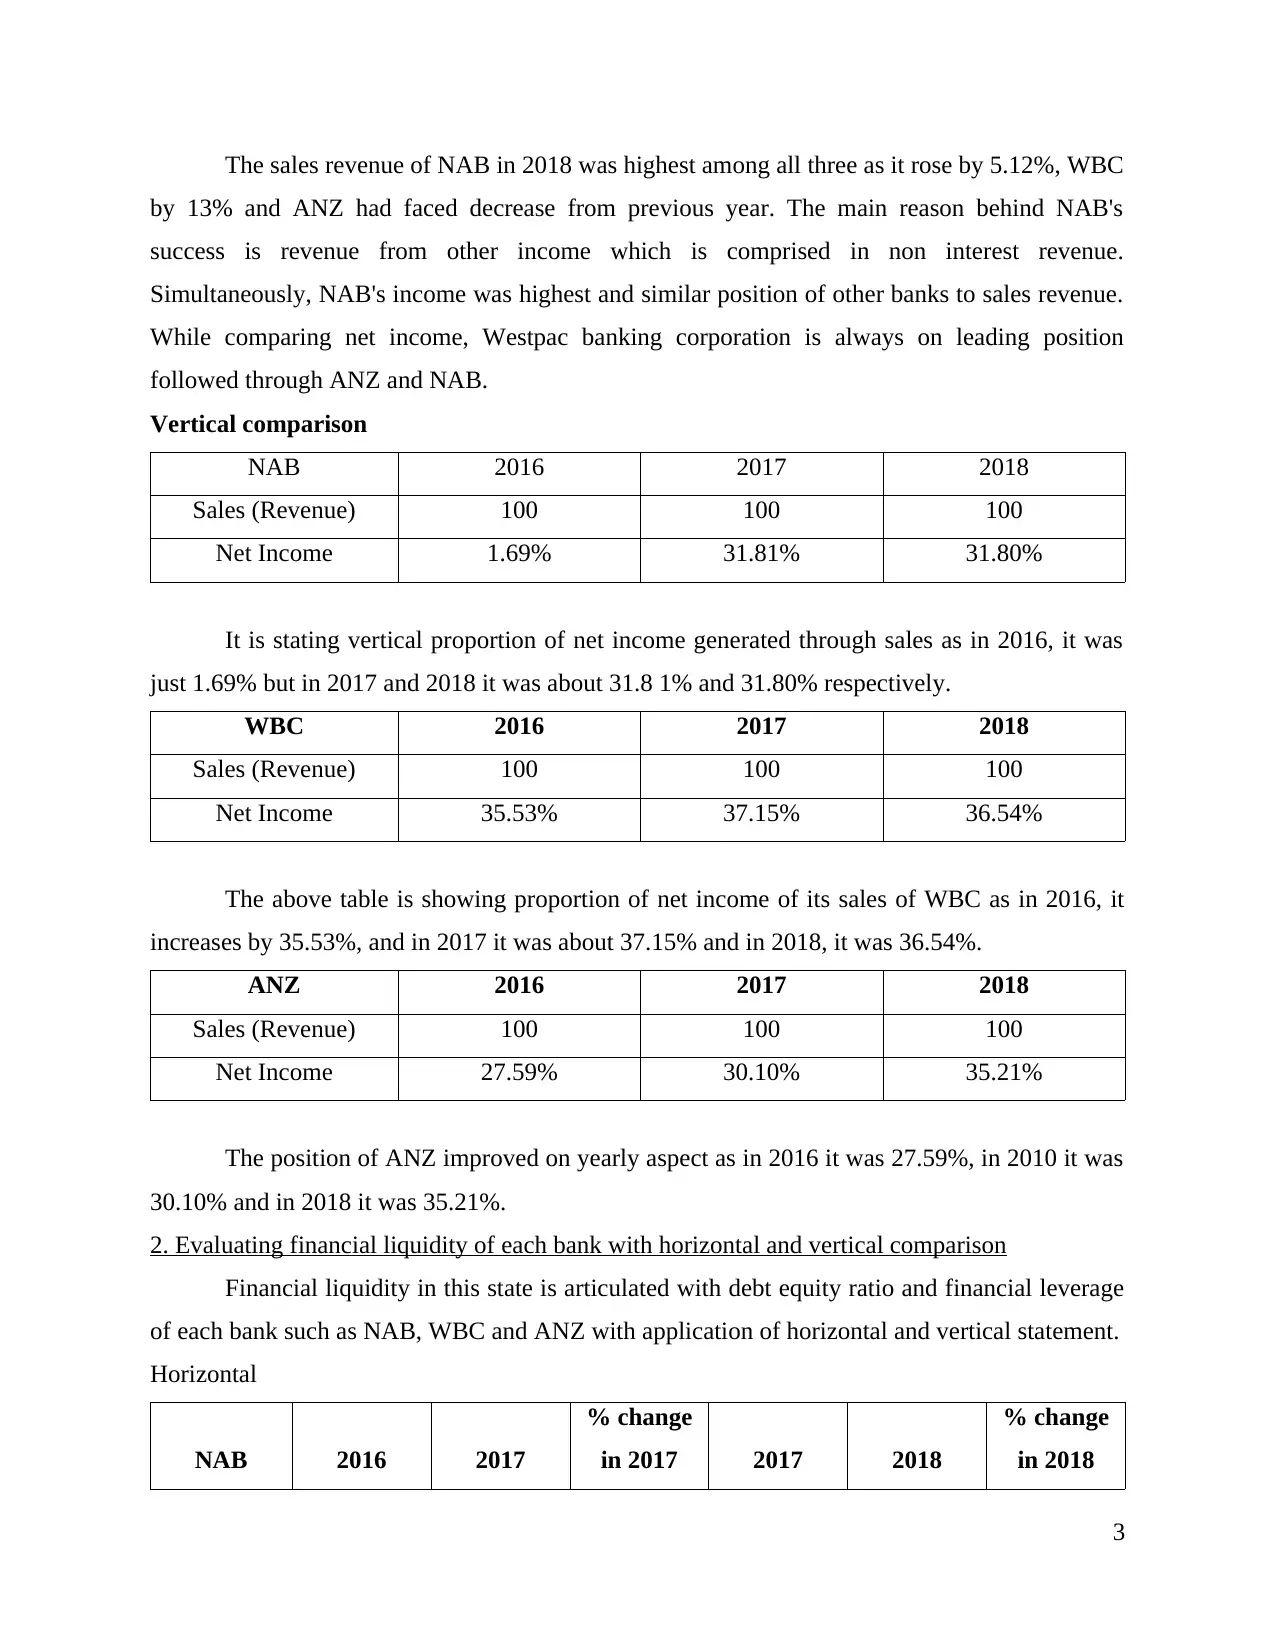
The sales revenue of NAB in 2018 was highest among all three as it rose by 5.12%, WBC
by 13% and ANZ had faced decrease from previous year. The main reason behind NAB's
success is revenue from other income which is comprised in non interest revenue.
Simultaneously, NAB's income was highest and similar position of other banks to sales revenue.
While comparing net income, Westpac banking corporation is always on leading position
followed through ANZ and NAB.
Vertical comparison
NAB 2016 2017 2018
Sales (Revenue) 100 100 100
Net Income 1.69% 31.81% 31.80%
It is stating vertical proportion of net income generated through sales as in 2016, it was
just 1.69% but in 2017 and 2018 it was about 31.8 1% and 31.80% respectively.
WBC 2016 2017 2018
Sales (Revenue) 100 100 100
Net Income 35.53% 37.15% 36.54%
The above table is showing proportion of net income of its sales of WBC as in 2016, it
increases by 35.53%, and in 2017 it was about 37.15% and in 2018, it was 36.54%.
ANZ 2016 2017 2018
Sales (Revenue) 100 100 100
Net Income 27.59% 30.10% 35.21%
The position of ANZ improved on yearly aspect as in 2016 it was 27.59%, in 2010 it was
30.10% and in 2018 it was 35.21%.
2. Evaluating financial liquidity of each bank with horizontal and vertical comparison
Financial liquidity in this state is articulated with debt equity ratio and financial leverage
of each bank such as NAB, WBC and ANZ with application of horizontal and vertical statement.
Horizontal
NAB 2016 2017
% change
in 2017 2017 2018
% change
in 2018
3
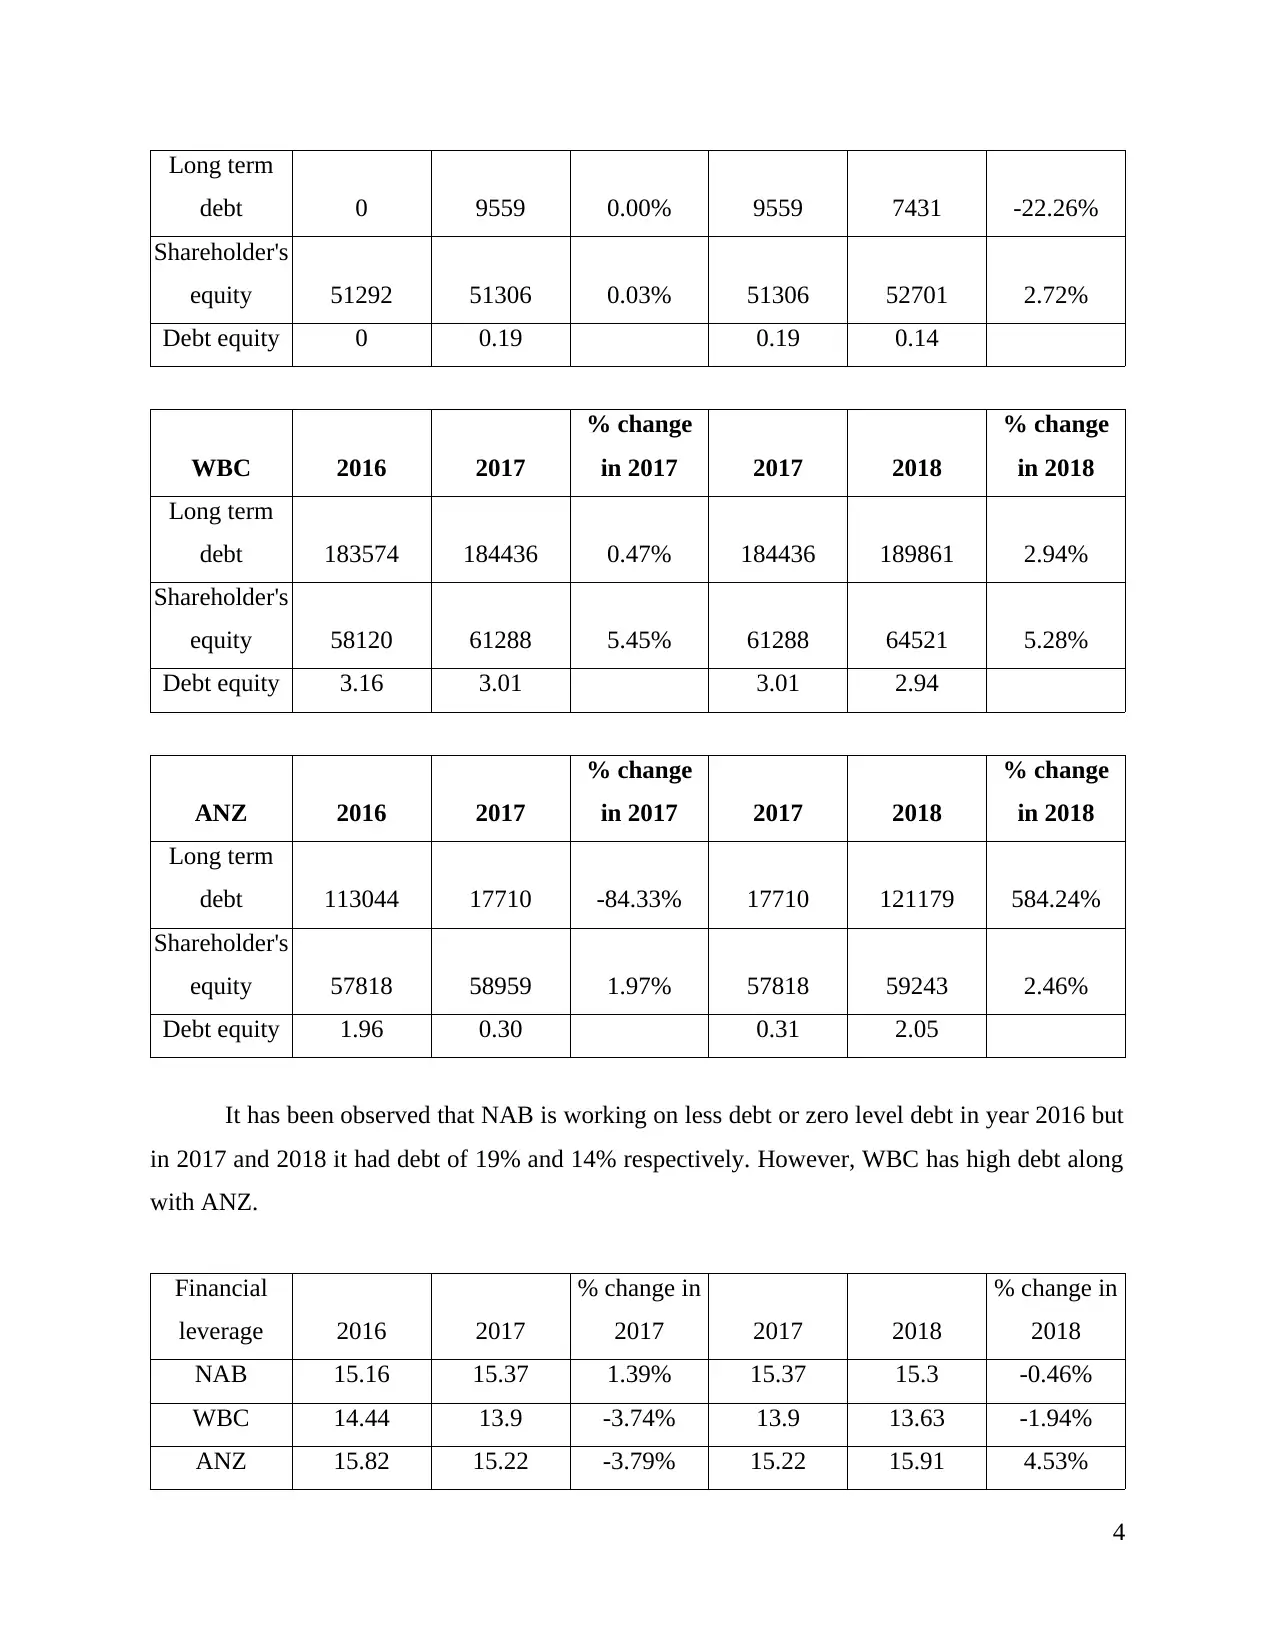
Long term
debt 0 9559 0.00% 9559 7431 -22.26%
Shareholder's
equity 51292 51306 0.03% 51306 52701 2.72%
Debt equity 0 0.19 0.19 0.14
WBC 2016 2017
% change
in 2017 2017 2018
% change
in 2018
Long term
debt 183574 184436 0.47% 184436 189861 2.94%
Shareholder's
equity 58120 61288 5.45% 61288 64521 5.28%
Debt equity 3.16 3.01 3.01 2.94
ANZ 2016 2017
% change
in 2017 2017 2018
% change
in 2018
Long term
debt 113044 17710 -84.33% 17710 121179 584.24%
Shareholder's
equity 57818 58959 1.97% 57818 59243 2.46%
Debt equity 1.96 0.30 0.31 2.05
It has been observed that NAB is working on less debt or zero level debt in year 2016 but
in 2017 and 2018 it had debt of 19% and 14% respectively. However, WBC has high debt along
with ANZ.
Financial
leverage 2016 2017
% change in
2017 2017 2018
% change in
2018
NAB 15.16 15.37 1.39% 15.37 15.3 -0.46%
WBC 14.44 13.9 -3.74% 13.9 13.63 -1.94%
ANZ 15.82 15.22 -3.79% 15.22 15.91 4.53%
4
⊘ This is a preview!⊘
Do you want full access?
Subscribe today to unlock all pages.
Trusted by 1+ million students worldwide
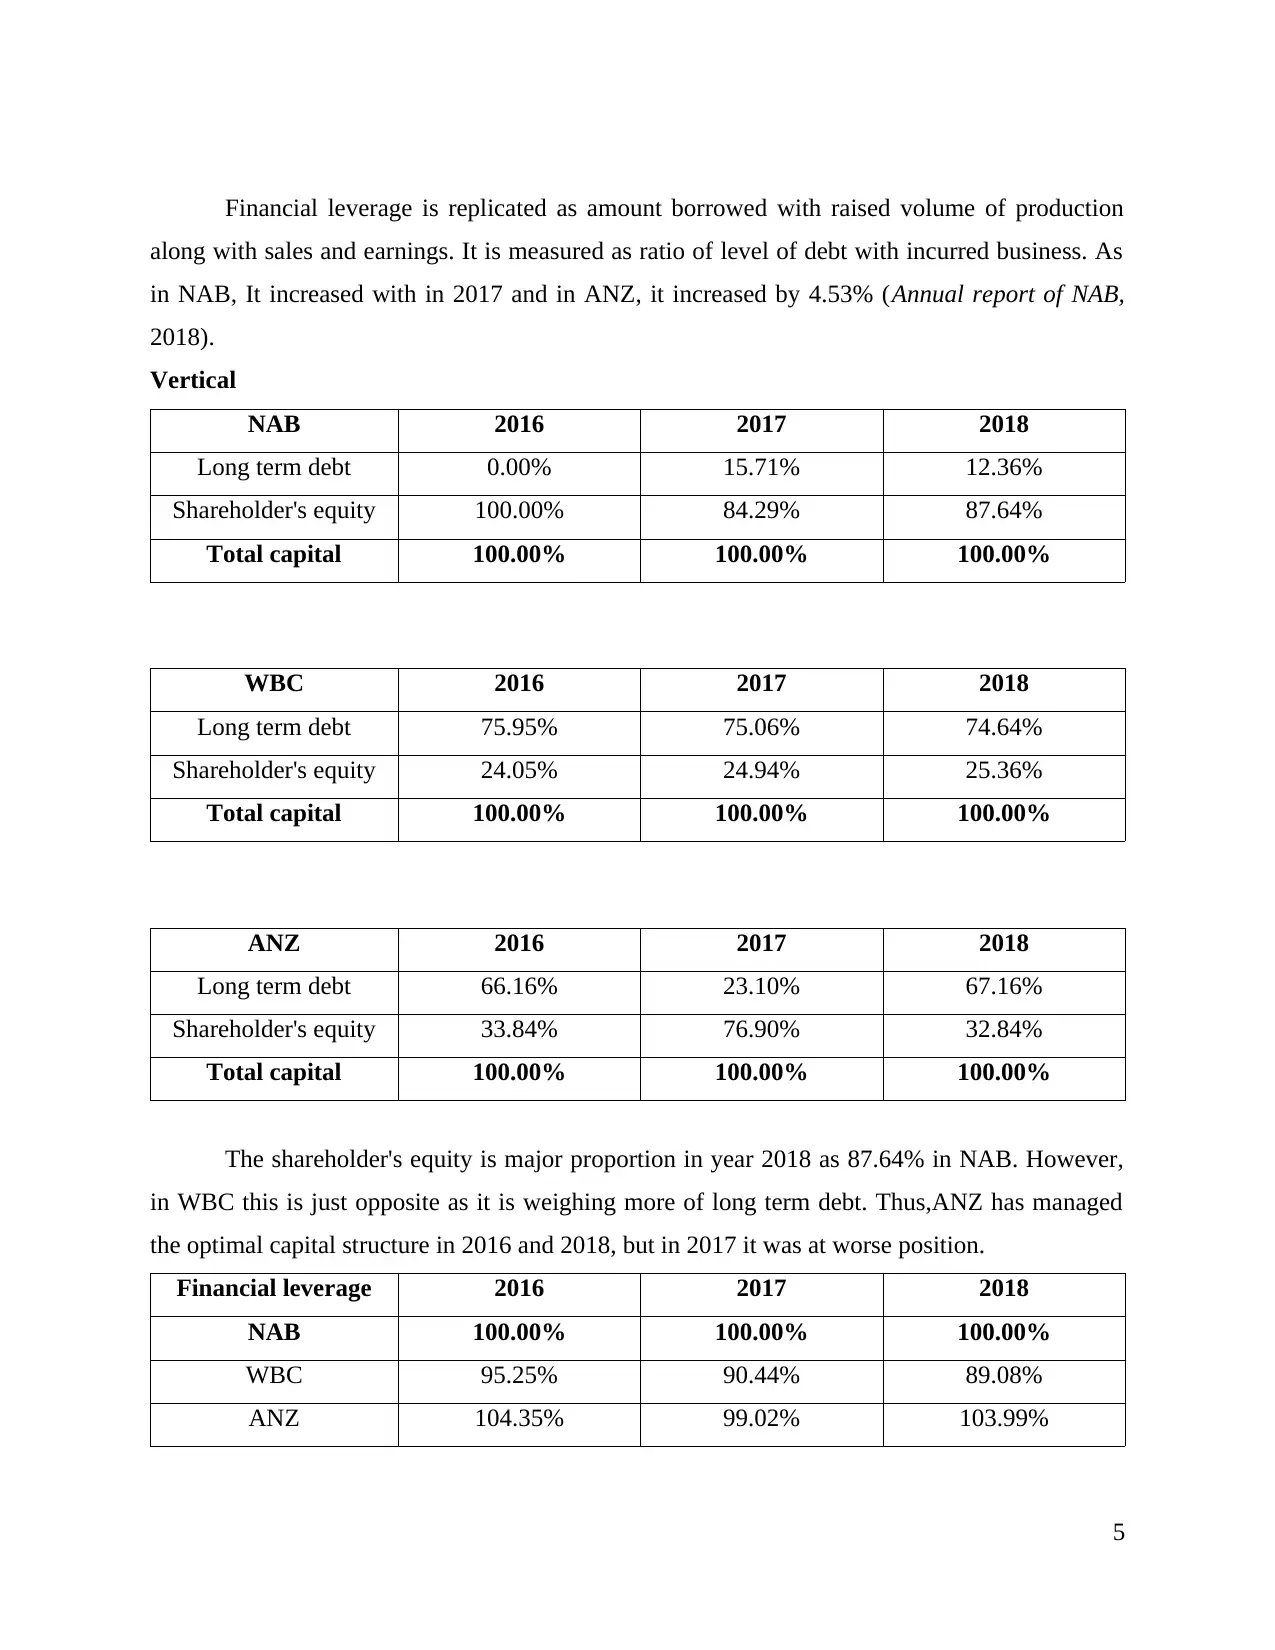
Financial leverage is replicated as amount borrowed with raised volume of production
along with sales and earnings. It is measured as ratio of level of debt with incurred business. As
in NAB, It increased with in 2017 and in ANZ, it increased by 4.53% (Annual report of NAB,
2018).
Vertical
NAB 2016 2017 2018
Long term debt 0.00% 15.71% 12.36%
Shareholder's equity 100.00% 84.29% 87.64%
Total capital 100.00% 100.00% 100.00%
WBC 2016 2017 2018
Long term debt 75.95% 75.06% 74.64%
Shareholder's equity 24.05% 24.94% 25.36%
Total capital 100.00% 100.00% 100.00%
ANZ 2016 2017 2018
Long term debt 66.16% 23.10% 67.16%
Shareholder's equity 33.84% 76.90% 32.84%
Total capital 100.00% 100.00% 100.00%
The shareholder's equity is major proportion in year 2018 as 87.64% in NAB. However,
in WBC this is just opposite as it is weighing more of long term debt. Thus,ANZ has managed
the optimal capital structure in 2016 and 2018, but in 2017 it was at worse position.
Financial leverage 2016 2017 2018
NAB 100.00% 100.00% 100.00%
WBC 95.25% 90.44% 89.08%
ANZ 104.35% 99.02% 103.99%
5
Paraphrase This Document
Need a fresh take? Get an instant paraphrase of this document with our AI Paraphraser
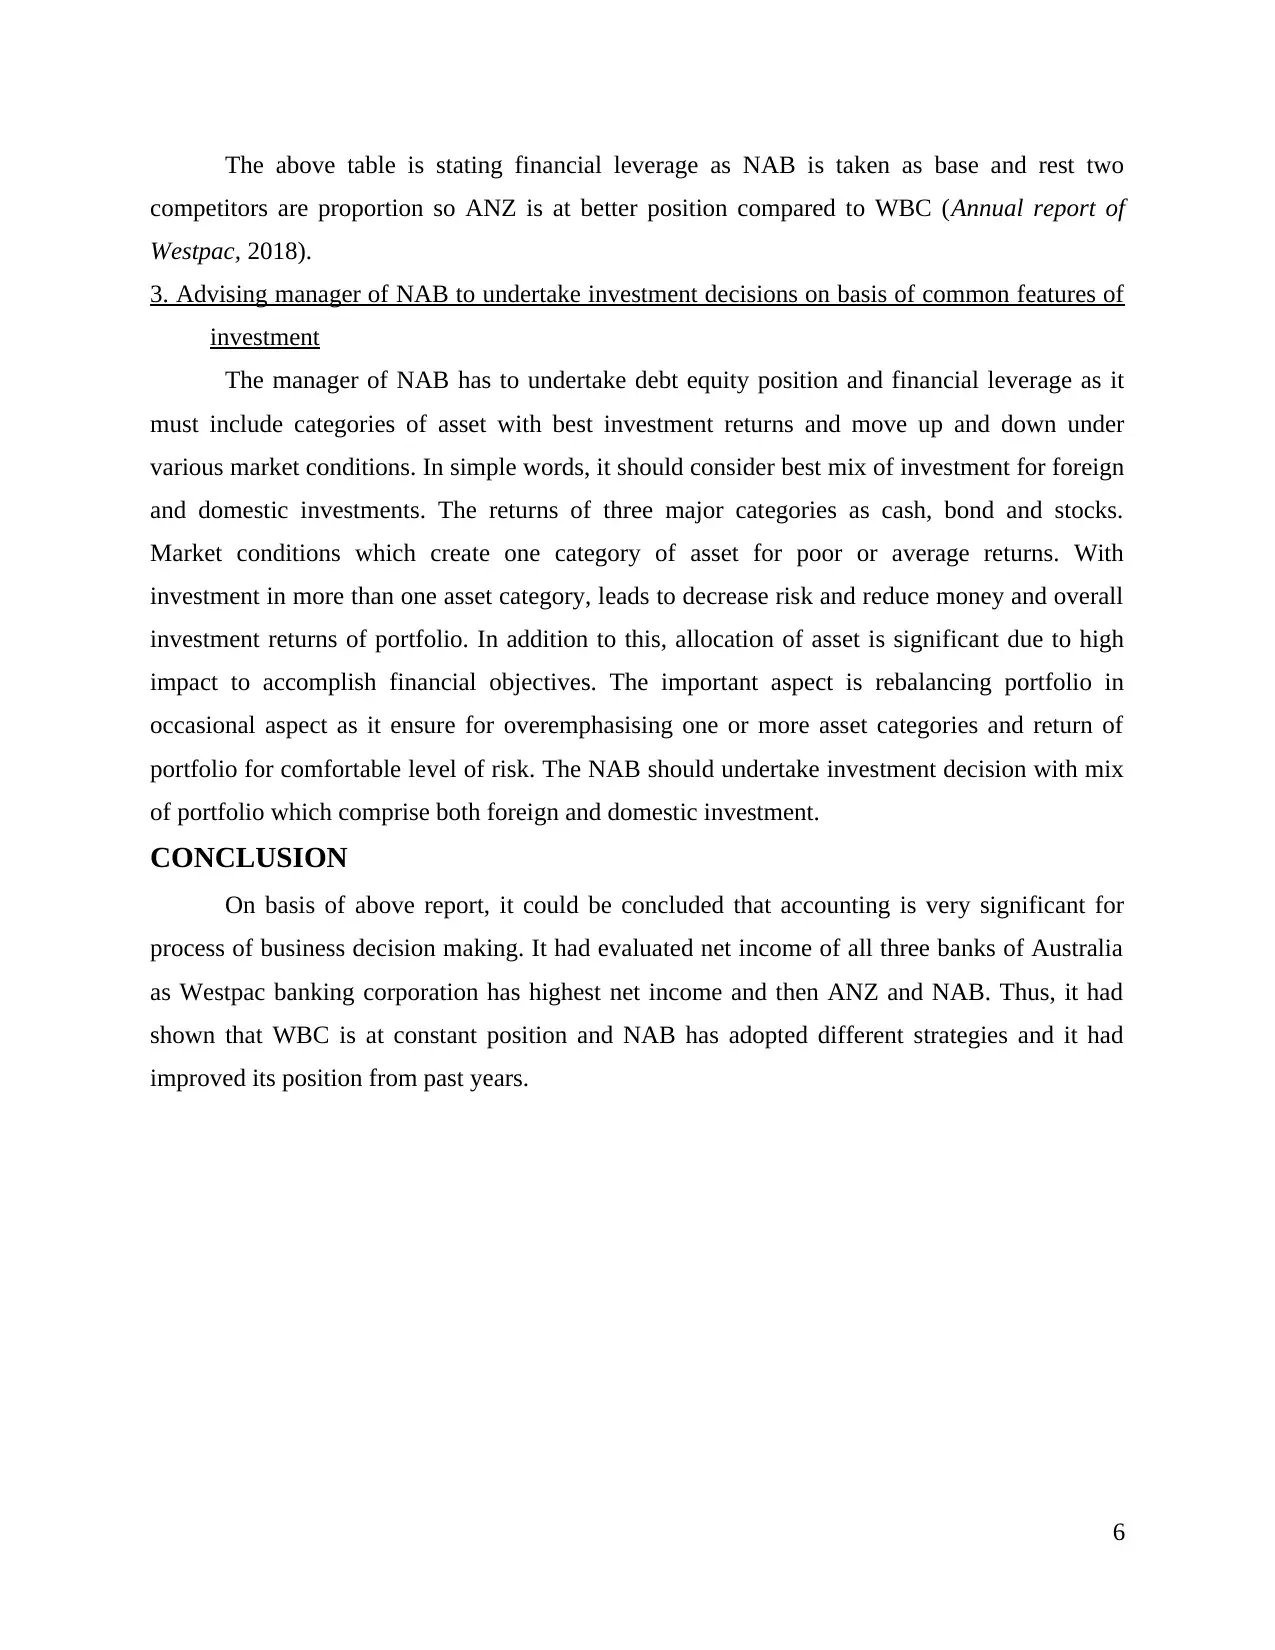
The above table is stating financial leverage as NAB is taken as base and rest two
competitors are proportion so ANZ is at better position compared to WBC (Annual report of
Westpac, 2018).
3. Advising manager of NAB to undertake investment decisions on basis of common features of
investment
The manager of NAB has to undertake debt equity position and financial leverage as it
must include categories of asset with best investment returns and move up and down under
various market conditions. In simple words, it should consider best mix of investment for foreign
and domestic investments. The returns of three major categories as cash, bond and stocks.
Market conditions which create one category of asset for poor or average returns. With
investment in more than one asset category, leads to decrease risk and reduce money and overall
investment returns of portfolio. In addition to this, allocation of asset is significant due to high
impact to accomplish financial objectives. The important aspect is rebalancing portfolio in
occasional aspect as it ensure for overemphasising one or more asset categories and return of
portfolio for comfortable level of risk. The NAB should undertake investment decision with mix
of portfolio which comprise both foreign and domestic investment.
CONCLUSION
On basis of above report, it could be concluded that accounting is very significant for
process of business decision making. It had evaluated net income of all three banks of Australia
as Westpac banking corporation has highest net income and then ANZ and NAB. Thus, it had
shown that WBC is at constant position and NAB has adopted different strategies and it had
improved its position from past years.
6
REFERENCES
Online
Annual report of Westpac. 2018. [Online]. Available through
<https://www.westpac.com.au/content/dam/public/wbc/documents/pdf/aw/ic/
2018_Westpac_Annual_Report.pdf>.
Annual report of NAB. 2018.[Online]. Available through
<https://capital.nab.com.au/docs/2018_NAB_Annual_Financial_Report.pdf>.
Annual report of ANZ. 2018.[Online]. Available through
<https://shareholder.anz.com/sites/default/files/anz_2018_annual_report_final.pdf>.
7
⊘ This is a preview!⊘
Do you want full access?
Subscribe today to unlock all pages.
Trusted by 1+ million students worldwide
1 out of 9
Your All-in-One AI-Powered Toolkit for Academic Success.
+13062052269
info@desklib.com
Available 24*7 on WhatsApp / Email
![[object Object]](/_next/static/media/star-bottom.7253800d.svg)
Unlock your academic potential
Copyright © 2020–2026 A2Z Services. All Rights Reserved. Developed and managed by ZUCOL.