University Accounting Assignment: Inventory, Receivables, and Reports
VerifiedAdded on  2020/10/04
|37
|4061
|53
Homework Assignment
AI Summary
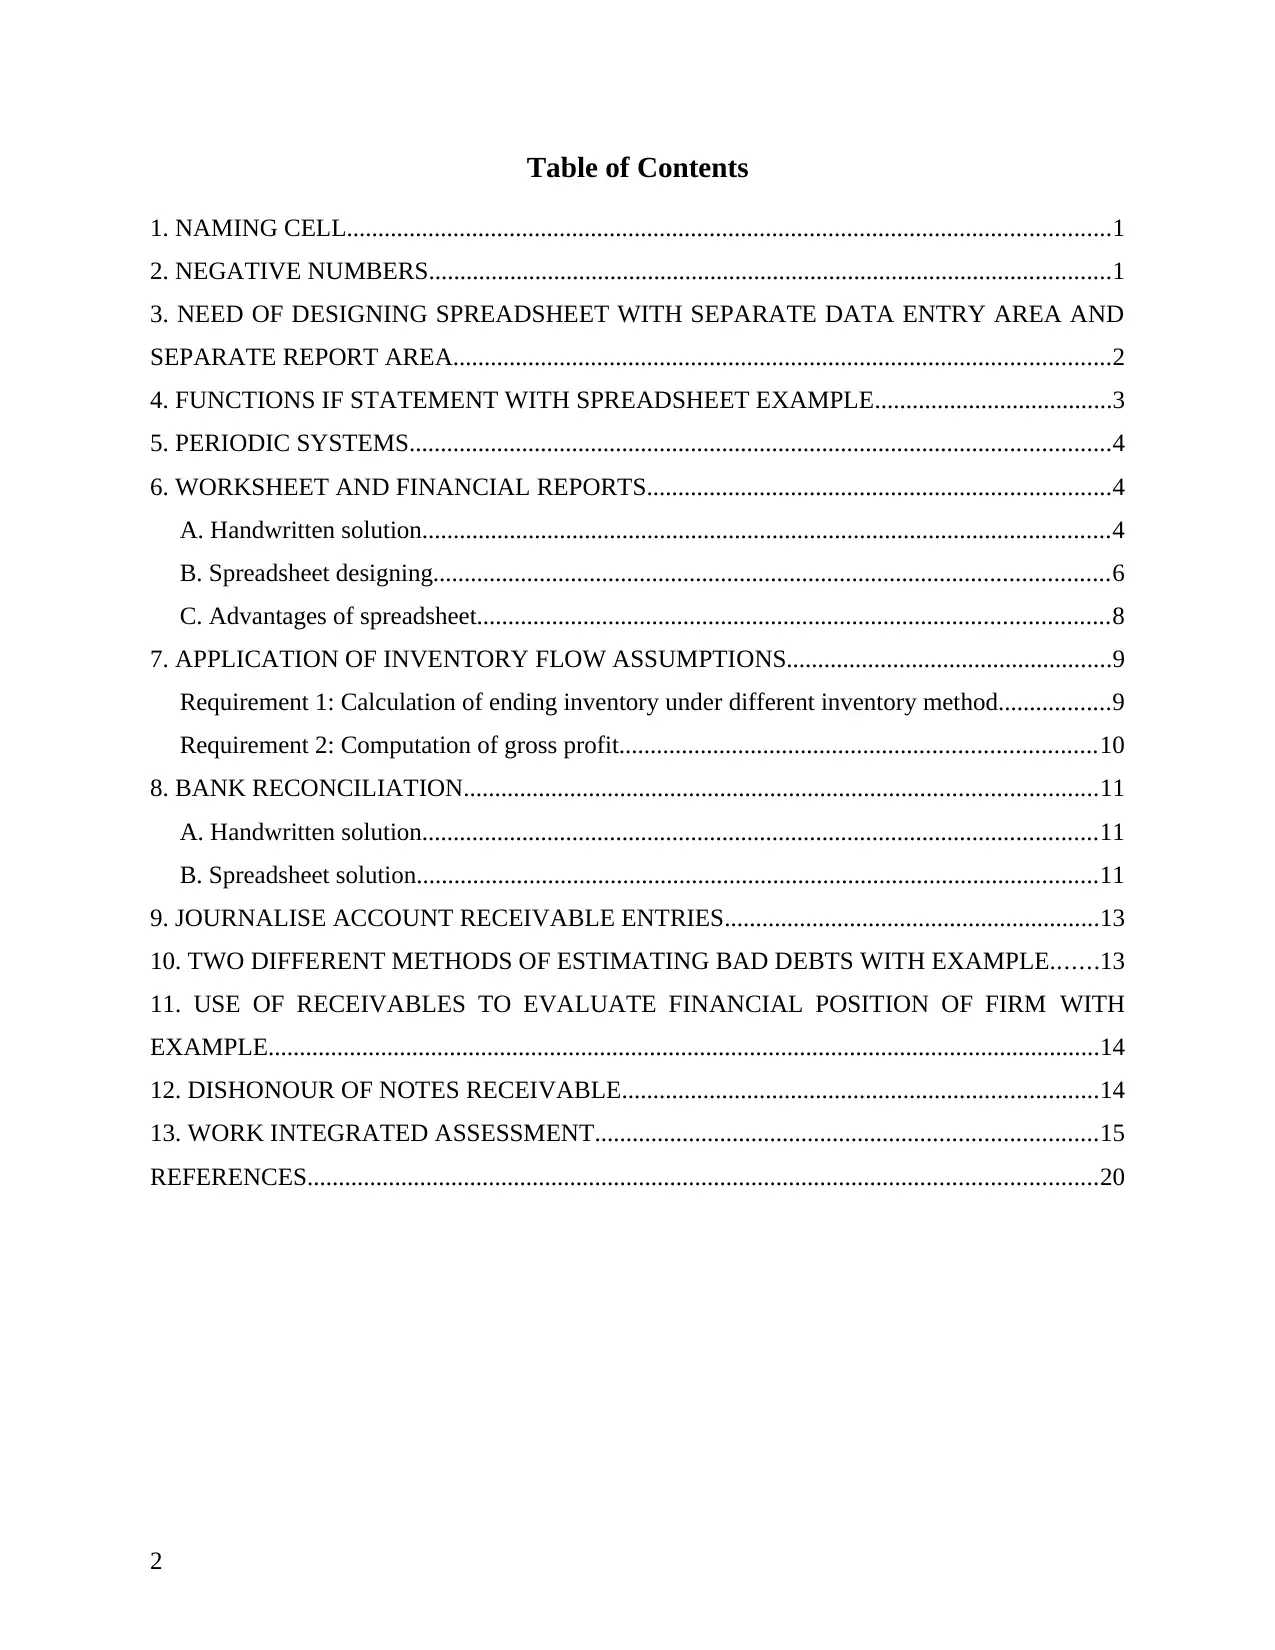
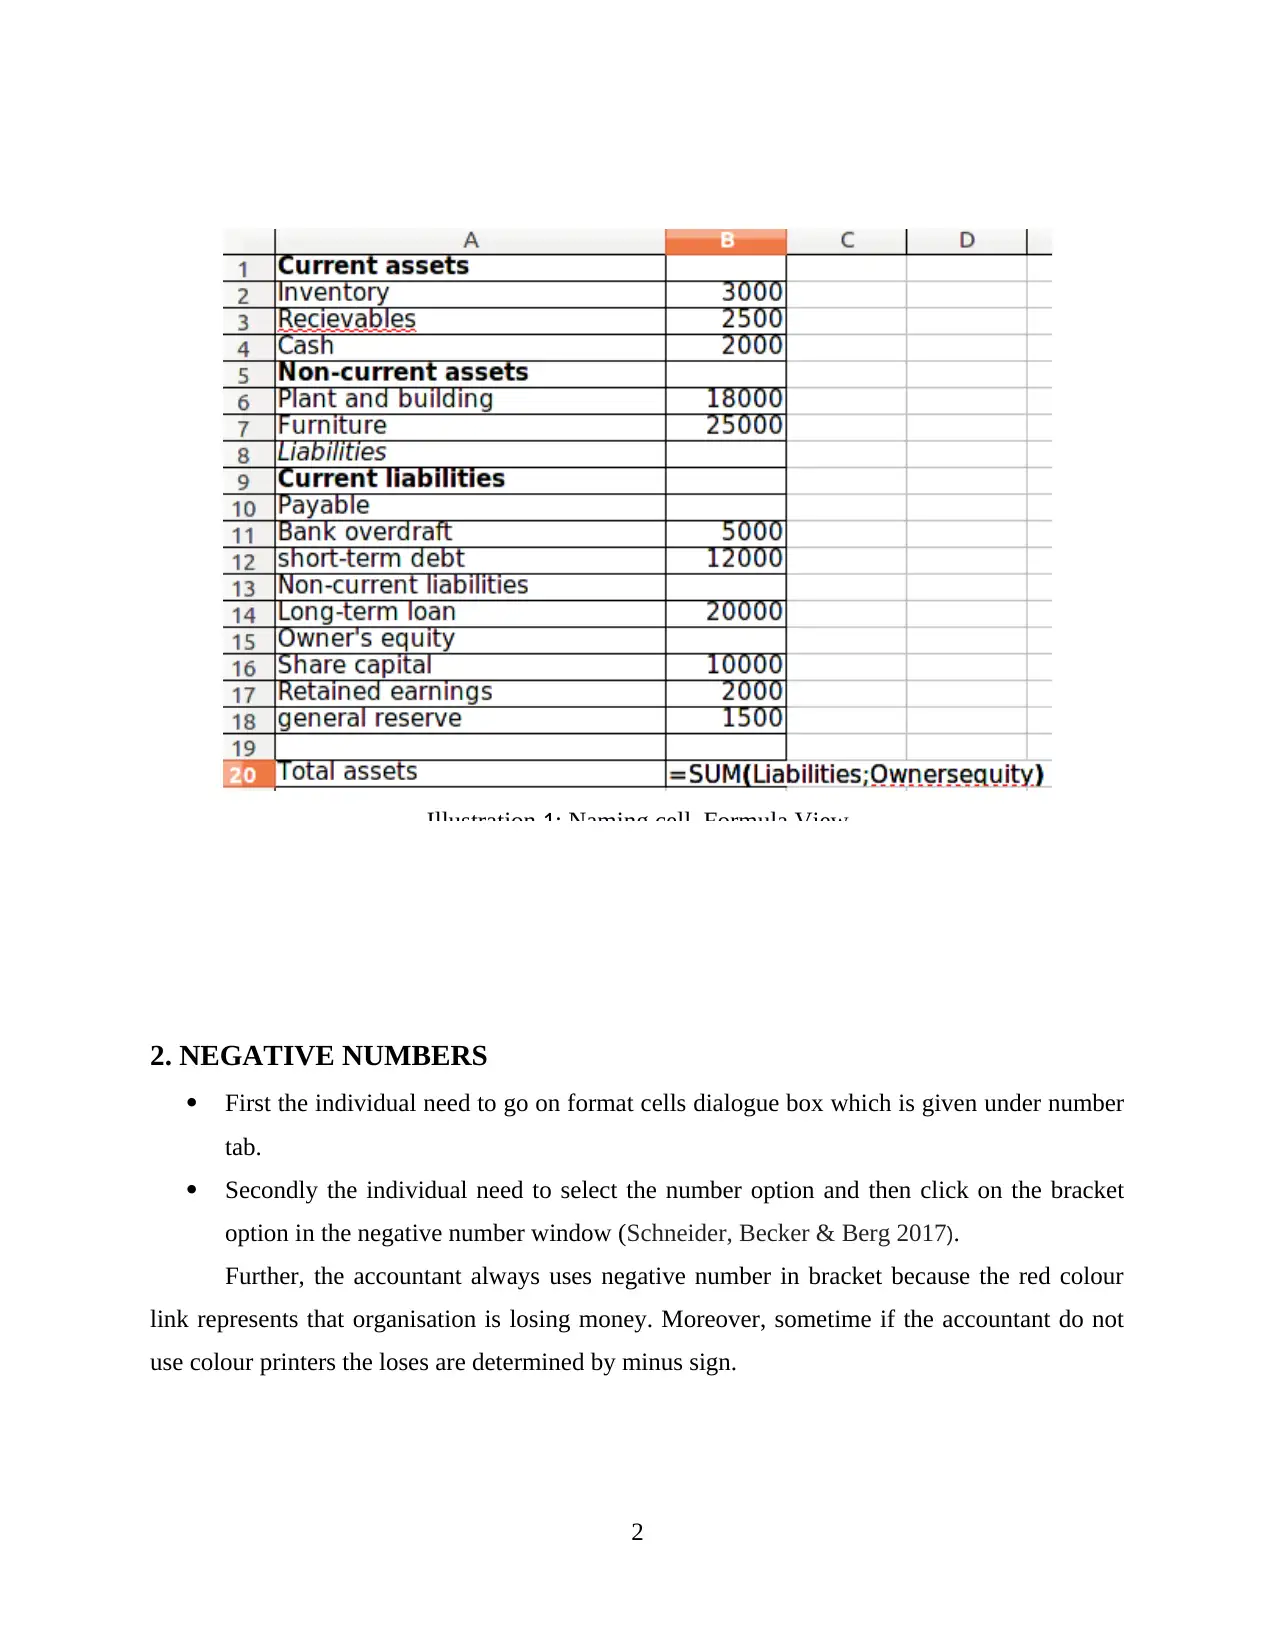
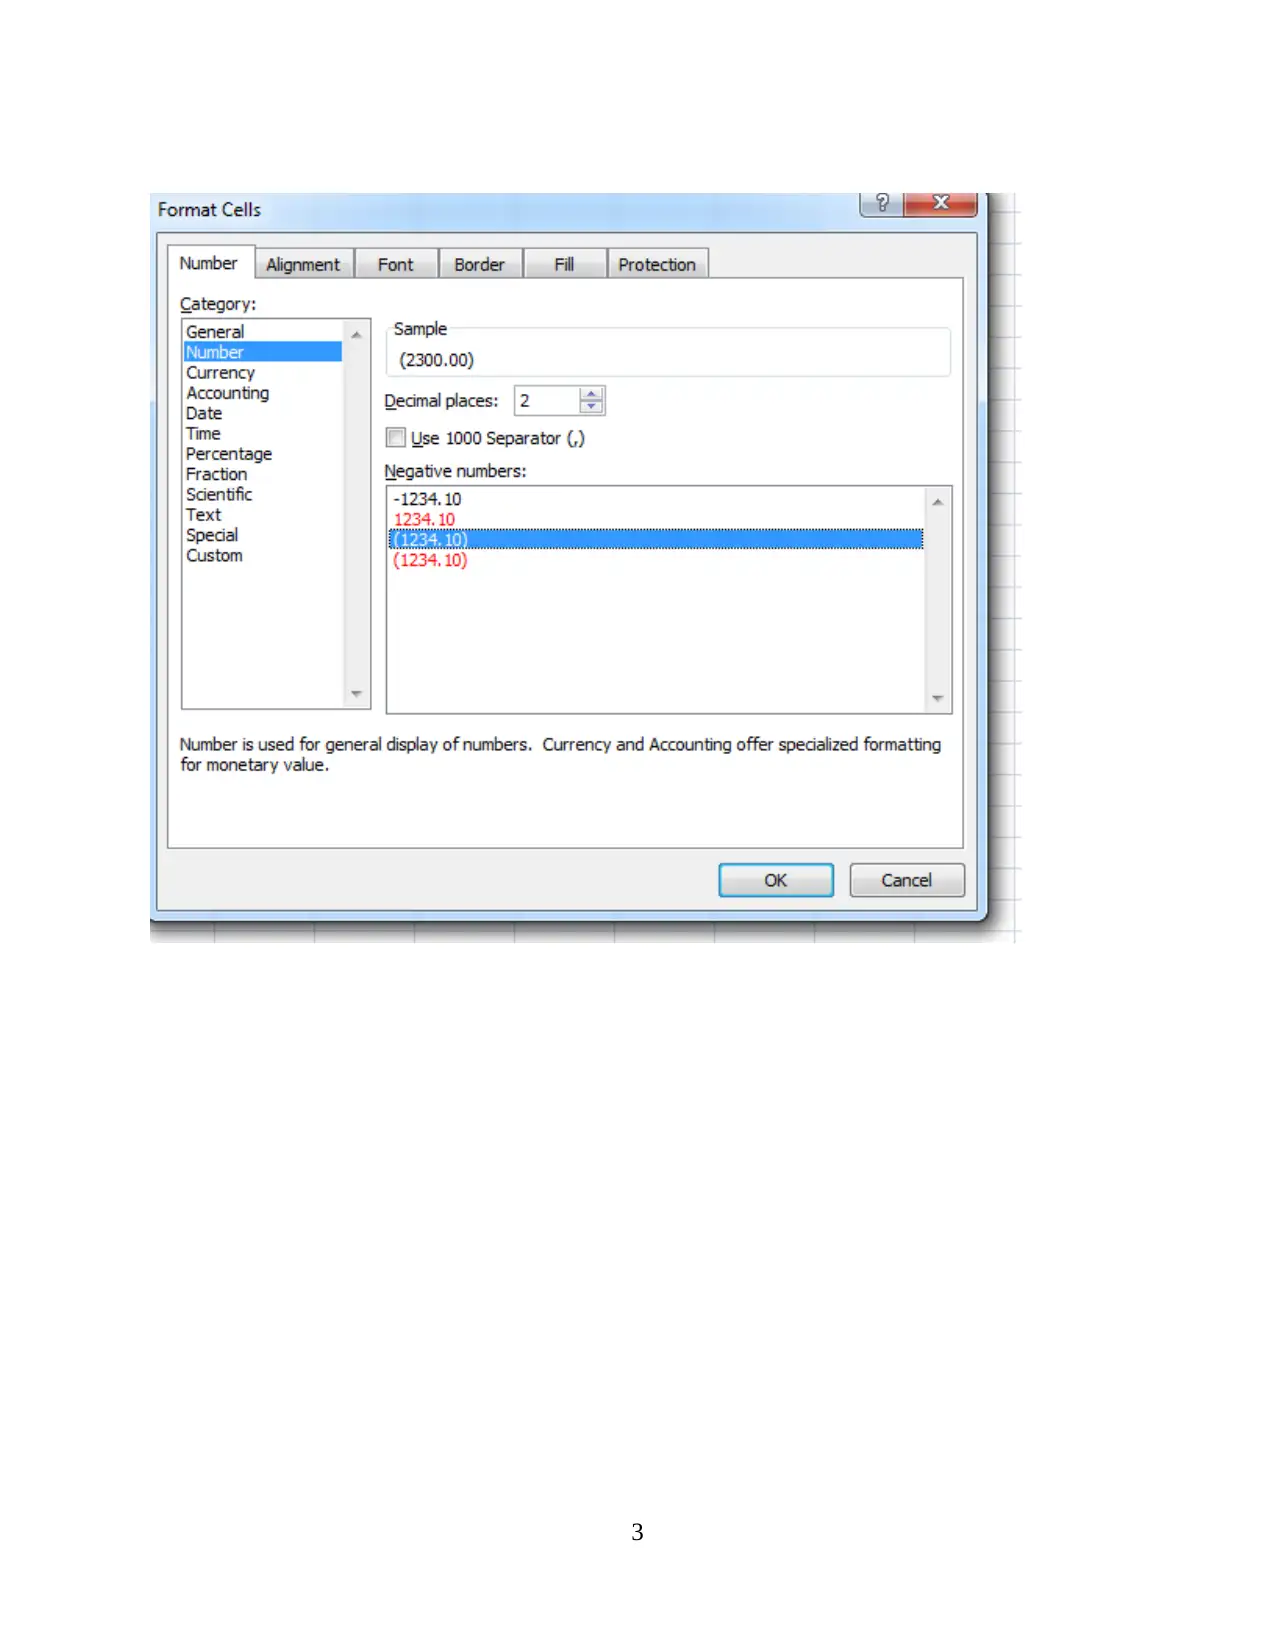
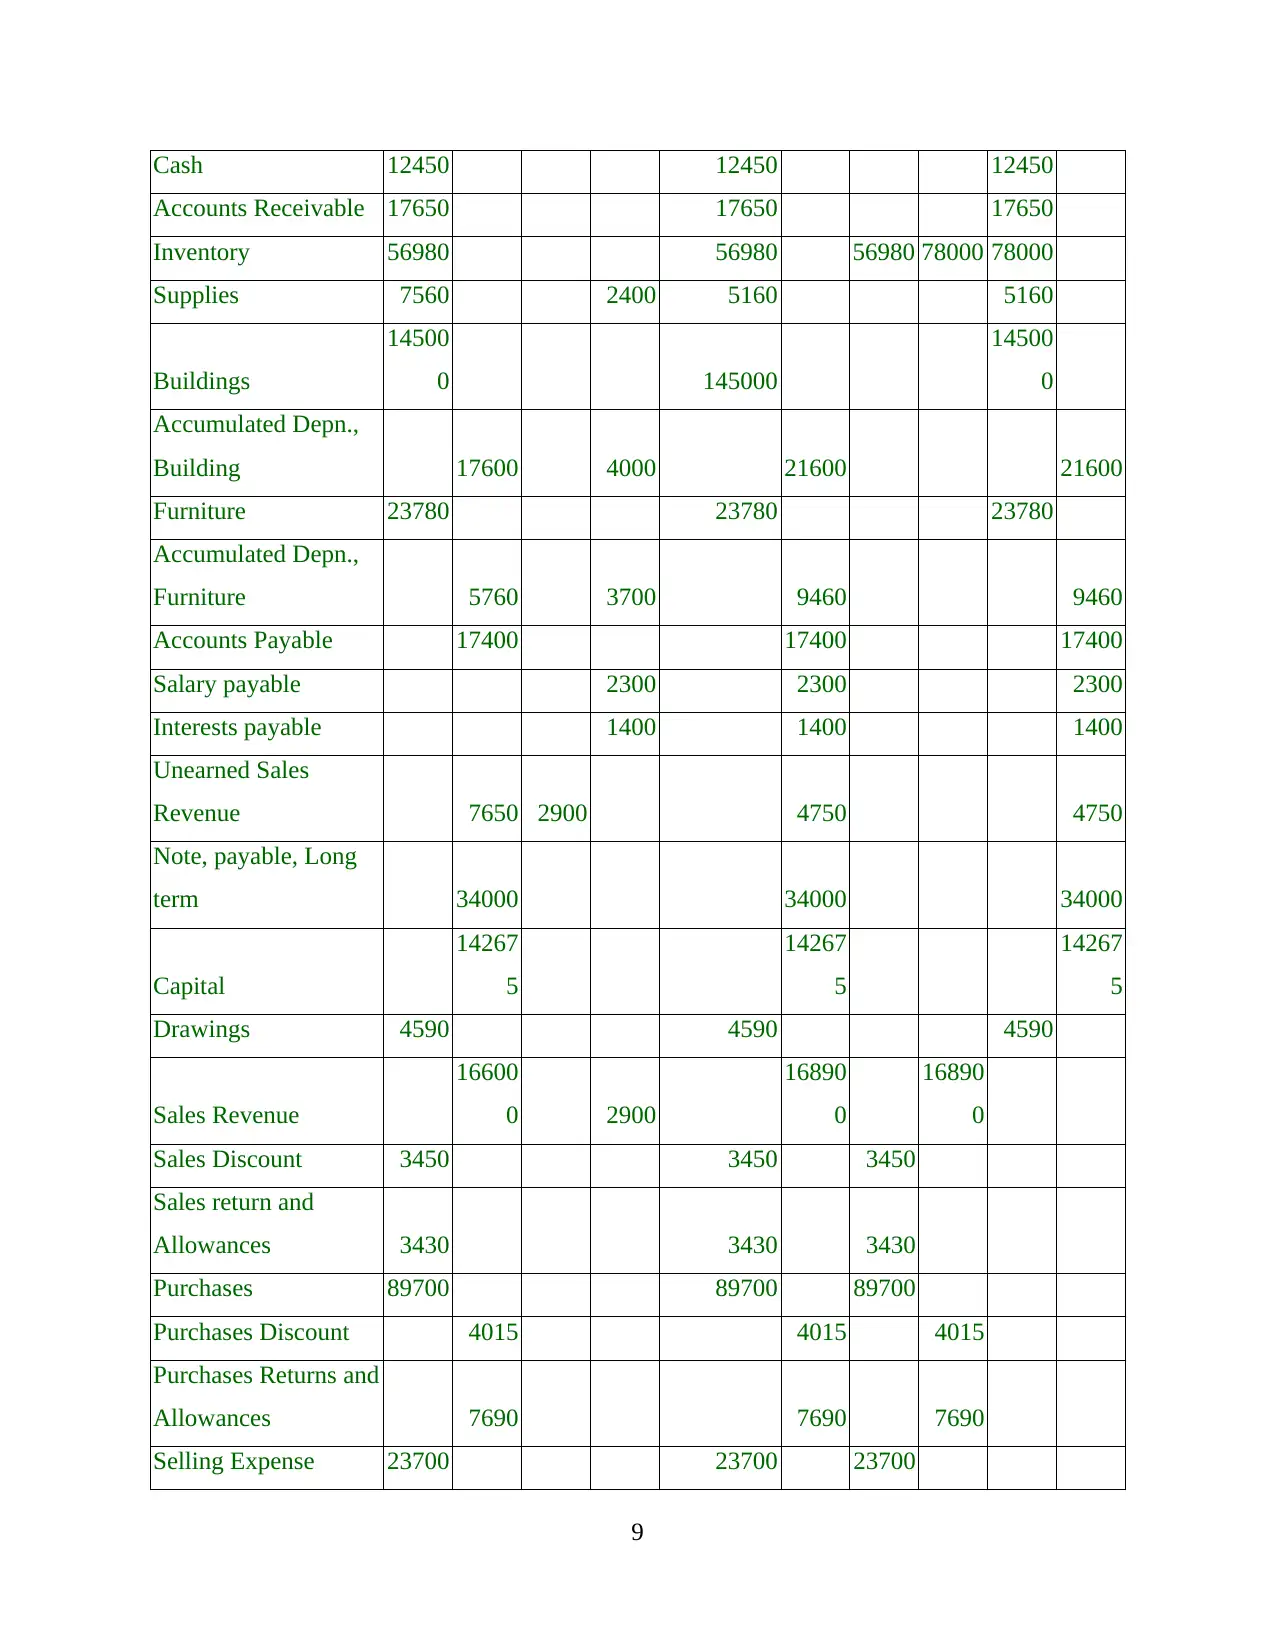
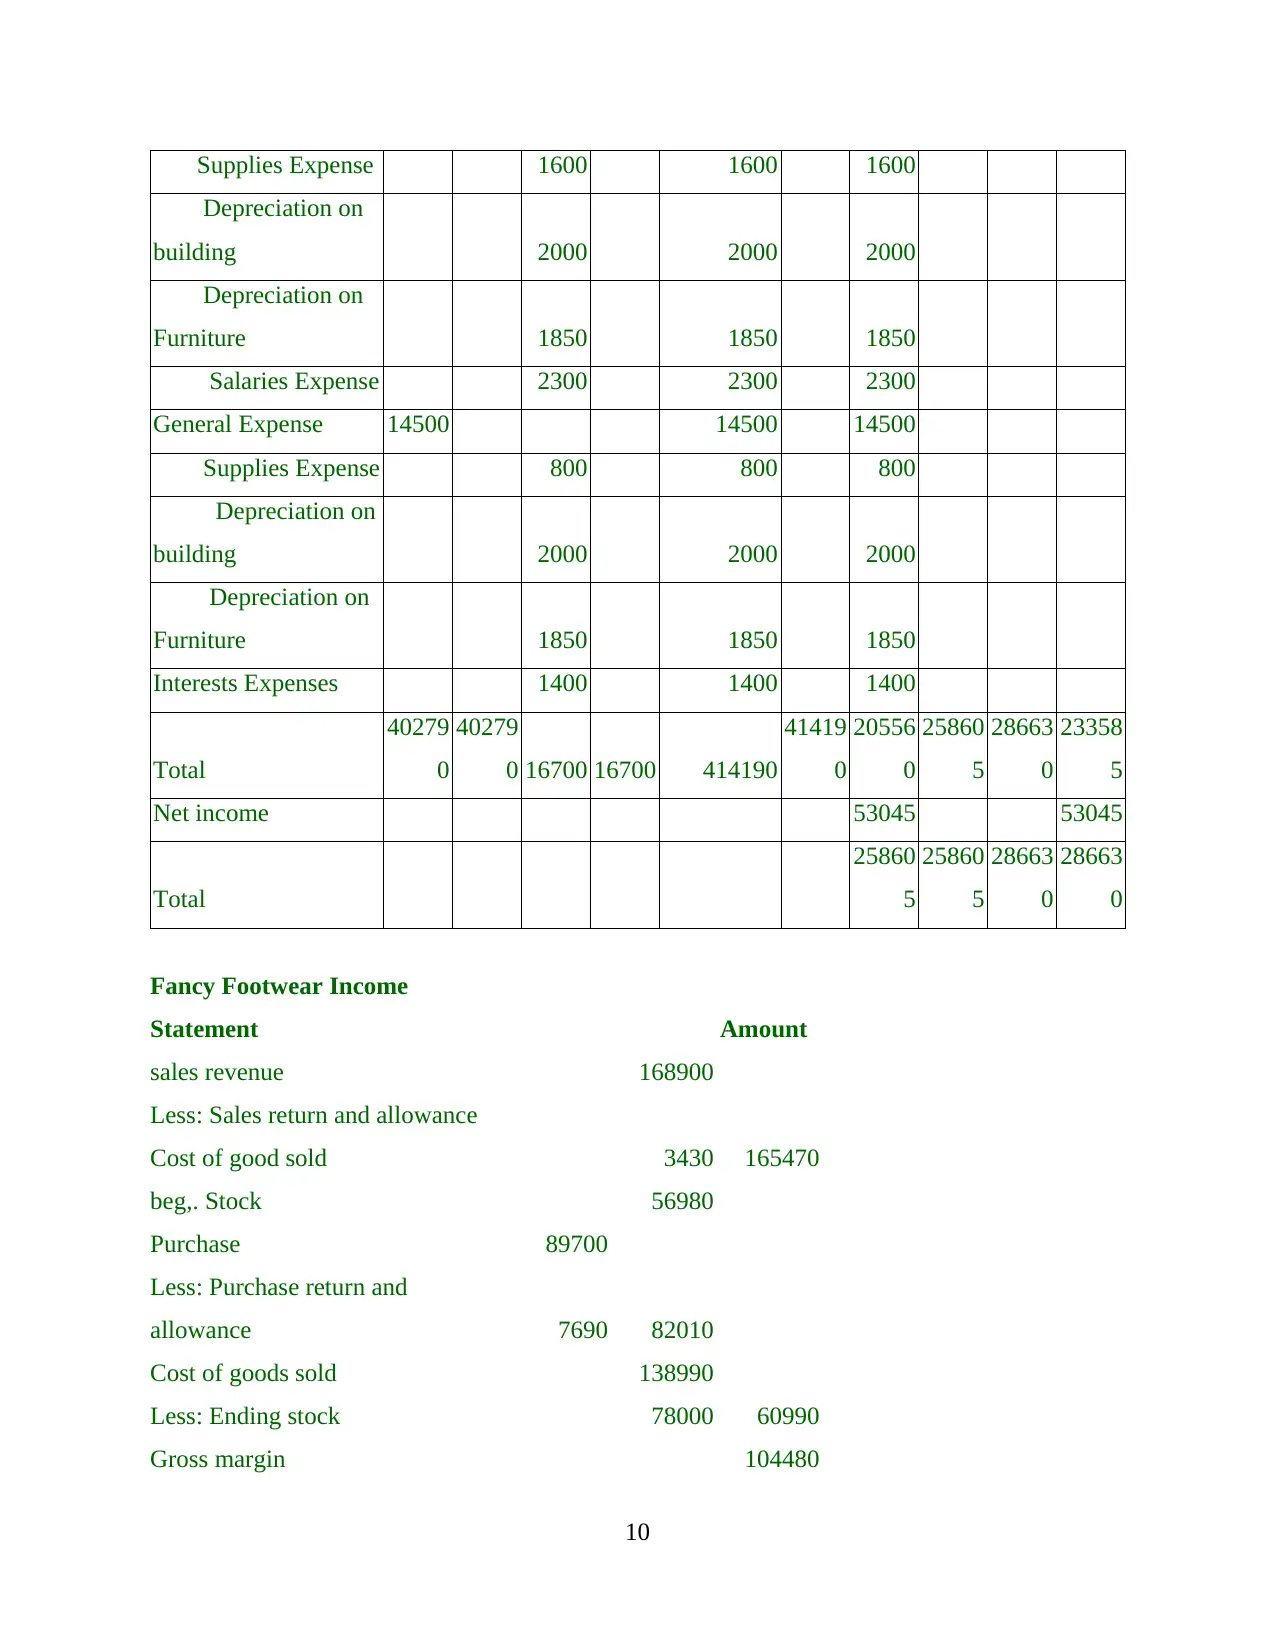
This document presents a comprehensive solution to an accounting assignment, covering key topics such as naming cells, negative numbers, spreadsheet design for data entry and reporting, and the use of IF statements. It delves into periodic inventory systems, worksheet creation, and the preparation of financial reports, including handwritten and spreadsheet solutions. The assignment further explores inventory flow assumptions (FIFO, LIFO, Average Cost), bank reconciliation (handwritten and spreadsheet methods), journalizing accounts receivable entries, and methods for estimating bad debts (percentage of credit sales and aging of accounts receivable). It concludes with an analysis of how receivables are used to evaluate a firm's financial position, the treatment of dishonored notes receivable, and a work-integrated assessment, providing a well-rounded understanding of fundamental accounting principles and practices. The solution includes examples and spreadsheet designs to illustrate the concepts.

ACCOUNTING
Secure Best Marks with AI Grader
Need help grading? Try our AI Grader for instant feedback on your assignments.

Table of Contents
1. NAMING CELL..........................................................................................................................1
2. NEGATIVE NUMBERS.............................................................................................................1
3. NEED OF DESIGNING SPREADSHEET WITH SEPARATE DATA ENTRY AREA AND
SEPARATE REPORT AREA.........................................................................................................2
4. FUNCTIONS IF STATEMENT WITH SPREADSHEET EXAMPLE......................................3
5. PERIODIC SYSTEMS................................................................................................................4
6. WORKSHEET AND FINANCIAL REPORTS..........................................................................4
A. Handwritten solution..............................................................................................................4
B. Spreadsheet designing............................................................................................................6
C. Advantages of spreadsheet.....................................................................................................8
7. APPLICATION OF INVENTORY FLOW ASSUMPTIONS....................................................9
Requirement 1: Calculation of ending inventory under different inventory method..................9
Requirement 2: Computation of gross profit............................................................................10
8. BANK RECONCILIATION.....................................................................................................11
A. Handwritten solution............................................................................................................11
B. Spreadsheet solution.............................................................................................................11
9. JOURNALISE ACCOUNT RECEIVABLE ENTRIES............................................................13
10. TWO DIFFERENT METHODS OF ESTIMATING BAD DEBTS WITH EXAMPLE.......13
11. USE OF RECEIVABLES TO EVALUATE FINANCIAL POSITION OF FIRM WITH
EXAMPLE.....................................................................................................................................14
12. DISHONOUR OF NOTES RECEIVABLE............................................................................14
13. WORK INTEGRATED ASSESSMENT................................................................................15
REFERENCES..............................................................................................................................20
2

1. NAMING CELL
This is done in spreadsheet by giving name to specific cell through box at left of formula
bar. Procedure: First the individual need to select the range or cell which need to be named, than
the person have to go and click formula tab and then the individual need to click define name
button. At last person need to enter the name for the particular rand or cell and Enter.
Current assets
Inventory 3000
Receivables 2500
Cash 2000
Non-current assets
Plant and building 18000
Furniture 25000
Liabilities
Current liabilities
Payable
Bank overdraft 5000
short-term debt 12000
Non-current liabilities
Long-term loan 20000
Owner's equity
Share capital 10000
Retained earnings 2000
general reserve 1500
Total assets 50500
1

2. NEGATIVE NUMBERS
ď‚· First the individual need to go on format cells dialogue box which is given under number
tab.
ď‚· Secondly the individual need to select the number option and then click on the bracket
option in the negative number window (Schneider, Becker & Berg 2017).
Further, the accountant always uses negative number in bracket because the red colour
link represents that organisation is losing money. Moreover, sometime if the accountant do not
use colour printers the loses are determined by minus sign.
2
Illustration 1: Naming cell, Formula View
Secure Best Marks with AI Grader
Need help grading? Try our AI Grader for instant feedback on your assignments.

3

Particulars Amount
Building 78000
Accumulated
depreciation (2300.00)
Written down value 75700
3. NEED OF DESIGNING SPREADSHEET WITH SEPARATE DATA
ENTRY AREA AND SEPARATE REPORT AREA
Accountant creates spreadsheet in order to properly record the entire data set in a separate
data entry system and separate report area helps to generate accounting reports analyse business
position. Spreadsheet helps to maintain proper record of all the accounting information and
facilitate accountant to examine the results. Spreadsheet technique enables accountant to have
clear insight and guide over decision making process (Ramachandran Rackliffe & Ragland
2016). Moreover, designing spreadsheet assist the auditor in avoiding time wastage over testing
procedures and designing standard.
Designing Spreadsheet with separate data entry area.
This system is used to provide a specific layout of overall data of entries by avoiding
errors and mistakes. Recording all the entries in spreadsheet gives accountant an analytical
overview and solution of all the business operations. Further, it is used by auditor as the
designing process is reliable, flexible and assists in managing time.
Designing Spreadsheet with separate report area
The system helps the accountant in separating data, presentation and analysis. The
accounting manager analyses the reporting in spreadsheet as it can be easily refreshed by
replacing raw data into updated data. Beside, the manager can use different combinations of
formula to analyse the reported data.
Example:
4

Illustration 2: Formula view
Illustration 3: Normal view
4. FUNCTIONS IF STATEMENT WITH SPREADSHEET EXAMPLE
This is the most popular function of Excel, accountant uses this to analyse the cell value
which are either true or false (Excel Functions, 2017). The ultimate statement of IF term is that “
if the value is true than use that, otherwise use some other value”
5
Paraphrase This Document
Need a fresh take? Get an instant paraphrase of this document with our AI Paraphraser

Here, IF function is used to match the trial balance showing that if both the debit and
credit balance perfectly match than indicate “No difference”, otherwise open suspense account.
As reflected in the trial balance, there is a difference of 700 therefore, suspense account open by
the same amount using IF function.
6
Illustration 4: Normal view
Illustration 5: Formula view
credit balance perfectly match than indicate “No difference”, otherwise open suspense account.
As reflected in the trial balance, there is a difference of 700 therefore, suspense account open by
the same amount using IF function.
6
Illustration 4: Normal view
Illustration 5: Formula view

5. PERIODIC SYSTEMS
Periodic inventory is a system which keeps update of inventory on regular basis. In this
system accountant do not need to put much effort as it is a systematic process and keeps records
up to date of cost of goods sold (Ingram 2014).
For example,
Periodic inventory
system
Particulars Amount
Beginning inventory 12000
Add: Goods purchase 135000
Less: 16000
Cost of goods sold 131000
7

6. WORKSHEET AND FINANCIAL REPORTS
A. Handwritten solution
Adjustments
1. Selling Expense
Supplies Expense: 2400*2/3= 1600
General Expense
Supplies Expense: 2400*1/3= 800
2. Building depreciation
Selling expense: 4000*1/2 = 2000
General expense: 4000*1/2 = 2000
3. Building depreciation
Selling expense: 3,700*1/2 = 1,850
General expense: 3,700*1/2 = 1,850
Account
Trial
Balance
Adjustment
s
Adjusted
balance
Income
statement
Balan
ce
sheet
Debit
Credi
t Debit
Credi
t Debit
Credi
t Debit
Credi
t Debit
Credi
t
8
Secure Best Marks with AI Grader
Need help grading? Try our AI Grader for instant feedback on your assignments.

Cash 12450 12450 12450
Accounts Receivable 17650 17650 17650
Inventory 56980 56980 56980 78000 78000
Supplies 7560 2400 5160 5160
Buildings
14500
0 145000
14500
0
Accumulated Depn.,
Building 17600 4000 21600 21600
Furniture 23780 23780 23780
Accumulated Depn.,
Furniture 5760 3700 9460 9460
Accounts Payable 17400 17400 17400
Salary payable 2300 2300 2300
Interests payable 1400 1400 1400
Unearned Sales
Revenue 7650 2900 4750 4750
Note, payable, Long
term 34000 34000 34000
Capital
14267
5
14267
5
14267
5
Drawings 4590 4590 4590
Sales Revenue
16600
0 2900
16890
0
16890
0
Sales Discount 3450 3450 3450
Sales return and
Allowances 3430 3430 3430
Purchases 89700 89700 89700
Purchases Discount 4015 4015 4015
Purchases Returns and
Allowances 7690 7690 7690
Selling Expense 23700 23700 23700
9

Supplies Expense 1600 1600 1600
Depreciation on
building 2000 2000 2000
Depreciation on
Furniture 1850 1850 1850
Salaries Expense 2300 2300 2300
General Expense 14500 14500 14500
Supplies Expense 800 800 800
Depreciation on
building 2000 2000 2000
Depreciation on
Furniture 1850 1850 1850
Interests Expenses 1400 1400 1400
Total
40279
0
40279
0 16700 16700 414190
41419
0
20556
0
25860
5
28663
0
23358
5
Net income 53045 53045
Total
25860
5
25860
5
28663
0
28663
0
Fancy Footwear Income
Statement Amount
sales revenue 168900
Less: Sales return and allowance
Cost of good sold 3430 165470
beg,. Stock 56980
Purchase 89700
Less: Purchase return and
allowance 7690 82010
Cost of goods sold 138990
Less: Ending stock 78000 60990
Gross margin 104480
10
Depreciation on
building 2000 2000 2000
Depreciation on
Furniture 1850 1850 1850
Salaries Expense 2300 2300 2300
General Expense 14500 14500 14500
Supplies Expense 800 800 800
Depreciation on
building 2000 2000 2000
Depreciation on
Furniture 1850 1850 1850
Interests Expenses 1400 1400 1400
Total
40279
0
40279
0 16700 16700 414190
41419
0
20556
0
25860
5
28663
0
23358
5
Net income 53045 53045
Total
25860
5
25860
5
28663
0
28663
0
Fancy Footwear Income
Statement Amount
sales revenue 168900
Less: Sales return and allowance
Cost of good sold 3430 165470
beg,. Stock 56980
Purchase 89700
Less: Purchase return and
allowance 7690 82010
Cost of goods sold 138990
Less: Ending stock 78000 60990
Gross margin 104480
10

Operating expense
Selling expense 31450
General expense 19150
Financial expense 835 51435
Net income 53045
Fancy footwear owners of equity Amount
Assets
Capital 142675
Add: Net income 53045 195720
Less: drawing 4590
Capital 191130
Fancy Footwear: Balance sheet Amount
Current assets
Cash 12450
Recievables 17650
Stock 78000
Supplies 5160
Total current assets 113260
Non-current assets
Building 145000
Less: acumulated depreciation 21600 123400
Furniture 23780
Less: acumulated depreciation 9460 14320
Non-current assets 137720
Total assets 250980
Liabilities
Current liabilities
Accounts payable 17400
Salary payable 2300
11
Paraphrase This Document
Need a fresh take? Get an instant paraphrase of this document with our AI Paraphraser

Interest payable 1400
Unearned sales revenue 4750
Total current liabilities 25850
Long-term liabilities
Note payable 34000 34000
Total liabilities 59850
Owners equity
capital 191130
Total liabilities and owner's equity 250980
12
Unearned sales revenue 4750
Total current liabilities 25850
Long-term liabilities
Note payable 34000 34000
Total liabilities 59850
Owners equity
capital 191130
Total liabilities and owner's equity 250980
12

13

14
Secure Best Marks with AI Grader
Need help grading? Try our AI Grader for instant feedback on your assignments.

15

B. Spreadsheet designing
Normal view in spreadsheet
16
Normal view in spreadsheet
16

17
Paraphrase This Document
Need a fresh take? Get an instant paraphrase of this document with our AI Paraphraser

Formula view in spreadsheet
18
18

19

C. Advantages of spreadsheet
ď‚· It helps to track payments, receipts and other financial transactions and helps in
rationalized decisions.
ď‚· It helps to link various data set to each other and assist in easier calculations i.e. variance
determination and others (Givoly, Hayn & Katz 2017).
ď‚· It helps in making presentation effectively with various navigations.
20
Secure Best Marks with AI Grader
Need help grading? Try our AI Grader for instant feedback on your assignments.

ď‚· Different spreadsheet function assists accountant to prepare accounts, generate reports,
visualized presentation through making various graphs, which helps in analysing business
profitability and financial position over the period.
7. APPLICATION OF INVENTORY FLOW ASSUMPTIONS
Requirement 1: Calculation of ending inventory under different inventory method
FIRST IN FIRST OUT
Perpetual Inventory System
Purchase Sales Closing inventory
Date Particulars Units Rate TC Units rate TC Units TC
01-Oct Beginning inventory 60 57 3420 60 3420
03-Oct Purchase 10 65 650 70 4070
12-Oct Purchase 30 70 2100 100 6170
31-Oct Purchase 70 72 5040 170 11210
31-Oct Sales 55 57 3135
5 Units (57) 285
10 units (65) 650
30 units (70) 2100
70 units (72) 5040
31-Oct Closing inventory 115 8075
Last IN FIRST OUT
Perpetual Inventory System
Purchase Sales Closing inventory
Date Particulars Units Rate TC Units rate TC Units TC
01-Oct Beginning inventory 60 57 3420 60 3420
03-Oct Purchase 10 65 650 70 4070
12-Oct Purchase 30 70 2100 100 6170
31-Oct Purchase 70 72 5040 170 11210
31-Oct Sales 55 72 3960
60 Units (57) 3420
10 units (65) 650
30 units (70) 2100
15 units (72) 1080
31-Oct Closing inventory 115 7250
Average cost
Perpetual Inventory System
21

Purchase Sales Closing inventory
Date Particulars Units Rate TC Units rate TC Units Rate TC
01-Oct Beginning inventory 60 57 3420 60 57 3420
03-Oct Purchase 10 65 650 70 58 4070
12-Oct Purchase 30 70 2100 100 62 6170
31-Oct Purchase 70 72 5040 170 66 11210
31-Oct Sales 55 66 3627
31-Oct Closing inventory 115 66 7583
22
Date Particulars Units Rate TC Units rate TC Units Rate TC
01-Oct Beginning inventory 60 57 3420 60 57 3420
03-Oct Purchase 10 65 650 70 58 4070
12-Oct Purchase 30 70 2100 100 62 6170
31-Oct Purchase 70 72 5040 170 66 11210
31-Oct Sales 55 66 3627
31-Oct Closing inventory 115 66 7583
22

Requirement 2: Computation of gross profit
Average cost LIFO FIFO
sales revenue 25000 25000 25000
Less: Cost of goods sold 3627 3960 3135
Gross profit 21373 21040 21865
23
Average cost LIFO FIFO
sales revenue 25000 25000 25000
Less: Cost of goods sold 3627 3960 3135
Gross profit 21373 21040 21865
23
Paraphrase This Document
Need a fresh take? Get an instant paraphrase of this document with our AI Paraphraser

REPORTS
Average cost LIFO FIFO
Beginning inventory 3420 3420 3420
Net Purchases 7790 7790 7790
Cost of goods available 11210 11210 11210
Ending inventory 7583 7250 8075
Cost of goods sold 3627 3960 3135
24
Average cost LIFO FIFO
Beginning inventory 3420 3420 3420
Net Purchases 7790 7790 7790
Cost of goods available 11210 11210 11210
Ending inventory 7583 7250 8075
Cost of goods sold 3627 3960 3135
24

8. BANK RECONCILIATION
A. Handwritten solution
25
A. Handwritten solution
25

26
Secure Best Marks with AI Grader
Need help grading? Try our AI Grader for instant feedback on your assignments.

Bank Reconciliation Statement
Description As at April 30
Bank balance on 30 April 19670
Add:
Deposits in transit 1543 1543
21213
Less
Outstanding cheque #1420 1532
#1421 700
#1422 230 2462
Adjusted Bank balance 18751
Book ending balance 19031
Add
EFT RENT RECEIPT 600
1500 2100
21131
Less
EFT INSURANCE 300
NSF CHEQUE 1700
SERVICE CHARGE 40
ERRORS 340 2380
18751
27

B. Spreadsheet solution
Normal view
28
Normal view
28

Formula view
29
29
Paraphrase This Document
Need a fresh take? Get an instant paraphrase of this document with our AI Paraphraser

9. JOURNALISE ACCOUNT RECEIVABLE ENTRIES
1. Credit sales to “A”
A’s a/c Dr. 15,000
To sales a/c 15,000
2. Collection of partly amount worth 10000 GBP and other write off as bad debts
Cash a/c Dr. 10,000
Allowances for doubtful debts a/c Dr. 5,000
To A’s a/c 15,000
3. Reinstatement of the amount write-off earlier
Allowance receivables a/c Dr. 5,000
To allowance for doubtful debts a/c 5,000
4. Money received
Cash a/c Dr. 5,000
To Accounts receivables a/c 5,000
10. TWO DIFFERENT METHODS OF ESTIMATING BAD DEBTS WITH
EXAMPLE.
Percentage of credit sales method and Aging of accounts receivable are the methods
which are mostly used by accountant to estimate bad debts.
ď‚· Percentage of credit sales method: This method is based on anticipated credit policy and
experience of business. The accountant applies this percent method to either net credit
sales of present year or total credit sales. Moreover, the organisation uses this method to
attain a proper match of revenues and cost (Borthick, Schneider & Viscelli 2016).
Credit sales = 50,000
Percentage of bad debts: 5%
Bad debts = 50,000*5%
30

= 2,500
According to the evaluation it demonstrates as per 5% approximately that 2500 are bad
debts.
ď‚· Aging of account receivables: In this method accountant classify accounts into two parts
that is past due and not due where past due are calculated on the basis of due period. This
method is used by organisation because it is the most accurate and provides scientific
computation. But the accountant do not prefer using this it is a time consuming process.
Example :
Age Category Amount
Probability of Non
collection
Uncollected
Amount $
1-20 days 64000 3.00% 1920
20-40 days 11500 6.00% 690
40-60 days 5300 7.00% 371
60-80 days 450 11.00% 49.5
3030.5
According to the evaluation of Aging account receivables bad debt is 3030.5
11. USE OF RECEIVABLES TO EVALUATE FINANCIAL POSITION OF
FIRM WITH EXAMPLE
The accountant uses account receivable to measure financial position of business because
it assists in evaluating solvency. Moreover, the funds under receivables do not give profit and
interests therefore the company always focuses on minimizing this balance. Further, the most
common methods use by individual to analyse position are, accounts receivable turnover and
number of days in sales and receivable (Du, Givoly & Alhusaini, 2017). A receivable day helps
to know the time duration which will be taken by the firm to receive money from their debtors.
Quick receipts is considered good for strengthening the cash balance of the company however,
receiving money delayed is an negative sign.
Example:
Receivable turnover ratio (Times): = Sales/Receivables
31

= 50,000/5,000
= 10 Times
Receivable days:
Accounts receivables /Total credit sales * Number of days in a year
For instance, receivables = 5,000
Credit sales = 50,000
Number of days = 365 days
Receivable days = 5,000/50,000*365 days
= 36.5 days
2015 (Assumed) 2016 (Computed above)
Debtors turnover ratio 8 times 10 times
Receivable days 40 days 36.5 days
In accordance to calculation it has been evaluated that debtors has increased 10 times from 8
which denotes that company is generated revenue efficiently.
As per the calculation made, receivable days is computed to 36.5 days means firm takes
36.5 days to collect the money owed from accounts receivables (Barth, Li & McClure 2017). For
instance, if in the previous year, it was 40 days then it is a clear indication that manager made
policies for prompt receipts from their receivables so as to increase cash position. In other words,
it can be concluded that managers has efficiently utilized their accounts receivables.
12. DISHONOUR OF NOTES RECEIVABLE
Credit sale:
A’s a/c Dr. 15,000
To sales a/c 15,000
Conversion to notes receivables:
Accounts receivables a/c Dr. 15,000
To Notes receivables a/c 15,000
Dishonour of the note receivables:
Notes receivables a/c Dr. 15,000
32
Secure Best Marks with AI Grader
Need help grading? Try our AI Grader for instant feedback on your assignments.

To accounts receivables a/c 15,000
Money received:
Bank a/c Dr. 15,000
To Notes receivables a/c 15,000
13. WORK INTEGRATED ASSESSMENT
To: Vikram
From: Management expert
Date: 13/09/2017
1. Business under West farmers group.
The business of West farmers is distributed in every industry like, department stores, office
works, home improvement etc. There is various business under West farmers some of them are as
follows:
ď‚· Coles: The leading supermarket chain of Australia.
ď‚· Liquor land: The largest chain of Liquor focused on promoting the demand and sales of
vintage liquor.
ď‚· Bunnings Trade: This business of West farmers is focused on selling best home packages
to Australian citizens
ď‚· Target: Second largest retail store of US, selling various types of essentials of kids,
women, men's, home wares etc.
2. Statement of Comprehensive Income
SOCI is the profitability statement that comprises details about revenues and expenditures
for the given reporting period and reflects net return. Revenue includes sales whilst expenditures
include salaries, rent, insurance, depreciation and others. In this, financial transactions are
recorded following accrual concept of accounting.
Ratios Formula 2017 2016
Profitability ratios AUD
million
AUD
million
33

Turnover 68015 65512
Gross profit 21656 19987
Gross margin Gross profit/turnover*100 31.84% 30.51%
Net profit 2873 407
Net profit ratio Net profit/turnover*100 4.22% 0.62%
In accordance to gross profit, it can be evaluated that from 2016 to 2017 the margin
percent has increased by 17% which demonstrate that west farmer group is making appropriate
profits after paying for its costs of goods sold (Smith, 2017). Further, rapid increased in net profit
ratio from 2016 to 2017 of farmer group represents that business is now more efficient at
converting its sales into actual profit.
3. Investment ratio, risk mitigation, sustainability, corporate governance
Liquidity ratio
Current assets 9667 9684
Current liabilities 10417 10424
Stock 6530 6260
CR Current assets/current liabilities 0.93 0.93
Quick ratio/acid test ratio (Current assets -Stock)/Current
liabilities
0.30 0.33
Solvency ratio
Debt 4066 5671
Equity 23941 22949
Capital gearing (Long-term liabilities/Equity capital
employed
0.17 0.25
Investment ratios
Earnings per share 2.54 0.36
Dividend per share 2.83 2.89
Net profit 2873 407
Shareholders’ equity 23941 22949
Return on equity Net income/shareholders equity 12.00% 1.77%
34

According to annual report of west farmers it can be analysed that, Dividend Per share of
the company has been decreased from 2017 to 2016 which states that the shareholders are not
satisfied with the distribution of share whereas Earning per share of business denotes that, the
farmer group is earnings profits and can allocate profit to outstanding share of common stock.
In accordance to return on equity percent, it can be concluded that from 2016 to 2017 that
percent has a rapid increase that is from 1.77 percent it has reached to 12 percent which indicates
that the group is able to generate profits from its shareholders in business.
Risk and Mitigation
To manage risk, the group focus on analysing the root cause of risk and threat which can
come across.
Secondly, all the organisation which are linked with west farmers focus on evaluating
common causes and reasons behind risk (Warren, Reeve & Duchac 2013).
The business analyses the strategies and alternatives which can assist the organisation in
overcoming risk.
Prioritize best risk mitigation alternatives.
Selection of the best alternatives to remover risk and hindrances which can impact business
operations.
Corporate Governance
In order to maintain its responsibility towards shareholders the West farmer group focus on
providing satisfactory return to its shareholders. Moreover, to maintain stability the business also
complies with principles of ASX corporate governance council.
Sustainability
The sustainability of West farmer group is based on its impact on environment and
community. The ultimate objective of the companies is to provide valuable future to every
individual who is linked with the group.
4. Working Capital ratio
According to working capital ratio it can be evaluated the farmer group current asset of the
business has been increased which can impact the liquidity of group and it is possible that
companies may face difficulty in paying off debt.
As per the results derived, Westfarmer’s CR remains unchanged to 0.93:1 in the Ccurent
35
1 out of 37
Related Documents

Your All-in-One AI-Powered Toolkit for Academic Success.
 +13062052269
info@desklib.com
Available 24*7 on WhatsApp / Email
Unlock your academic potential
© 2024  |  Zucol Services PVT LTD  |  All rights reserved.