Accounting Fundamentals Report: UK Manufacturing Profit Analysis
VerifiedAdded on 2023/01/17
|14
|2920
|28
Report
AI Summary
This report provides a comprehensive analysis of accounting fundamentals, focusing on the profitability of wood, furniture, and paper manufacturers in the UK. It examines profit rate distributions across organizations, comparing large, small, and medium-sized enterprises (SMEs). The report assesses the impact of export activities on profit margins and evaluates the return on capital employed (ROCE) for both large and SME manufacturers. Statistical methods, including descriptive analysis, correlation, and chi-squared tests, are employed to analyze a dataset of 565 entities. The report also considers the influence of economic uncertainties, such as Brexit and rising export costs, on the industry. Key findings include an average profit rate of 5.02% and a comparison of financial performance metrics. The report aims to provide investors with insights into potential investment opportunities within the UK manufacturing sector.

ACCOUNTING
FUNDAMENTALS
FUNDAMENTALS
Paraphrase This Document
Need a fresh take? Get an instant paraphrase of this document with our AI Paraphraser
Contents
INTRODUCTION...........................................................................................................................1
a) Distribution of the profit rate around the organisations in the data set..............................2
b) Assessment of the distribution rate of profit with comparison to large, Small and medium
size enterprise.........................................................................................................................2
c) Distribution of the profit rate, comparing manufacturers in the data set by their export
activity....................................................................................................................................4
d) Distribution of Return on Capital Employed comparing large and SME manufacturers in
the data set..............................................................................................................................6
e) Assessment of export activity of the manufacturers subject to data set with their size.....8
f) Evaluation of profit rate with other related quantitative variables.....................................9
g) Probability of profit margin for manufacturers subject to data with other quantitative data
set..........................................................................................................................................10
CONCLUSION..............................................................................................................................11
REFERENCES..............................................................................................................................12
INTRODUCTION
Quantitative skills for business stats refers to analysation of behaviour and skills for
mathematical and statistical exhibiting, assessment and study of quantitative figures. It presents a
numerical aspect with several financial instruments and predictable measures. The report
presents an understating of business statistics subject to investors who are seeking to invest in
wood, furniture and paper manufacturers (Eriksson and Kovalainen, 2015). It also presents an
evaluation of data set of different companies. Profit rates, rate of distribution is carried out by
considering the given data. The distribution of data compared with manufacturing in the data set
by the export activities. The repost presents an assessment of return on capital employed parallel
to SME and large manufactures subject to given data set. The profit rate across all manufacturers
with the given data also measured with variable data set. The key objective of this report is to
provide an overall insight of potential performance of wood market, furniture and paper
manufacturing industries. It will assist investors to assess the possible option for investment. The
key statistical methods are used for favourable results as descriptive analysis, histogram,
correlation, Chi squared test with explanations, Bivariate regression analysis and cross
tabulation.
Industry overview
Economic uncertainties enhanced challenges for furniture, paper and wood
manufacturing industries in the UK. The exporting cost which was not levied in European Union
countries, after Brexit it increased the export expenses outside the UK. Since last five years the
cost of the furniture products get increased and it became the key barrier for investors subject to
invest in furniture manufacturing organisations. The manufacturing sector of paper and
paperboard depends to a certain degree on labour originating from the European Union.
According to the National Statistics Office, in 2017, petroleum based products produced up
about 7% of the UK industrial sector, while EU labour taken into account for about 11% of both
the UK mining sector's labour force.
The UK economy delivered weak and slow growth in the year to Q2 2017, with a month-
on-quarter growth of 0.2% in Q1 2017 but 0.3% in Q2 2017. Real Gdp (GDP) growth in the
United Kingdom or other identified markets over the past decade is the; inflation in the United
Kingdom has been stable since 1910. The pound's real effective exchange rate has a huge impact
on the performance of the industry as imports meet about 46.5 percent of consumer spending. A
1
⊘ This is a preview!⊘
Do you want full access?
Subscribe today to unlock all pages.
Trusted by 1+ million students worldwide
strong currency makes exports cheaper, affecting domestic demand for furniture produced
locally, while also reducing the attractiveness of industrial products on international markets.
The recent exchange rate presents future expansion opportunities to grow the business at
domestic and international market (Wood, furniture market in the UK, 2016).
a) Distribution of the profit rate around the organisations in the data set
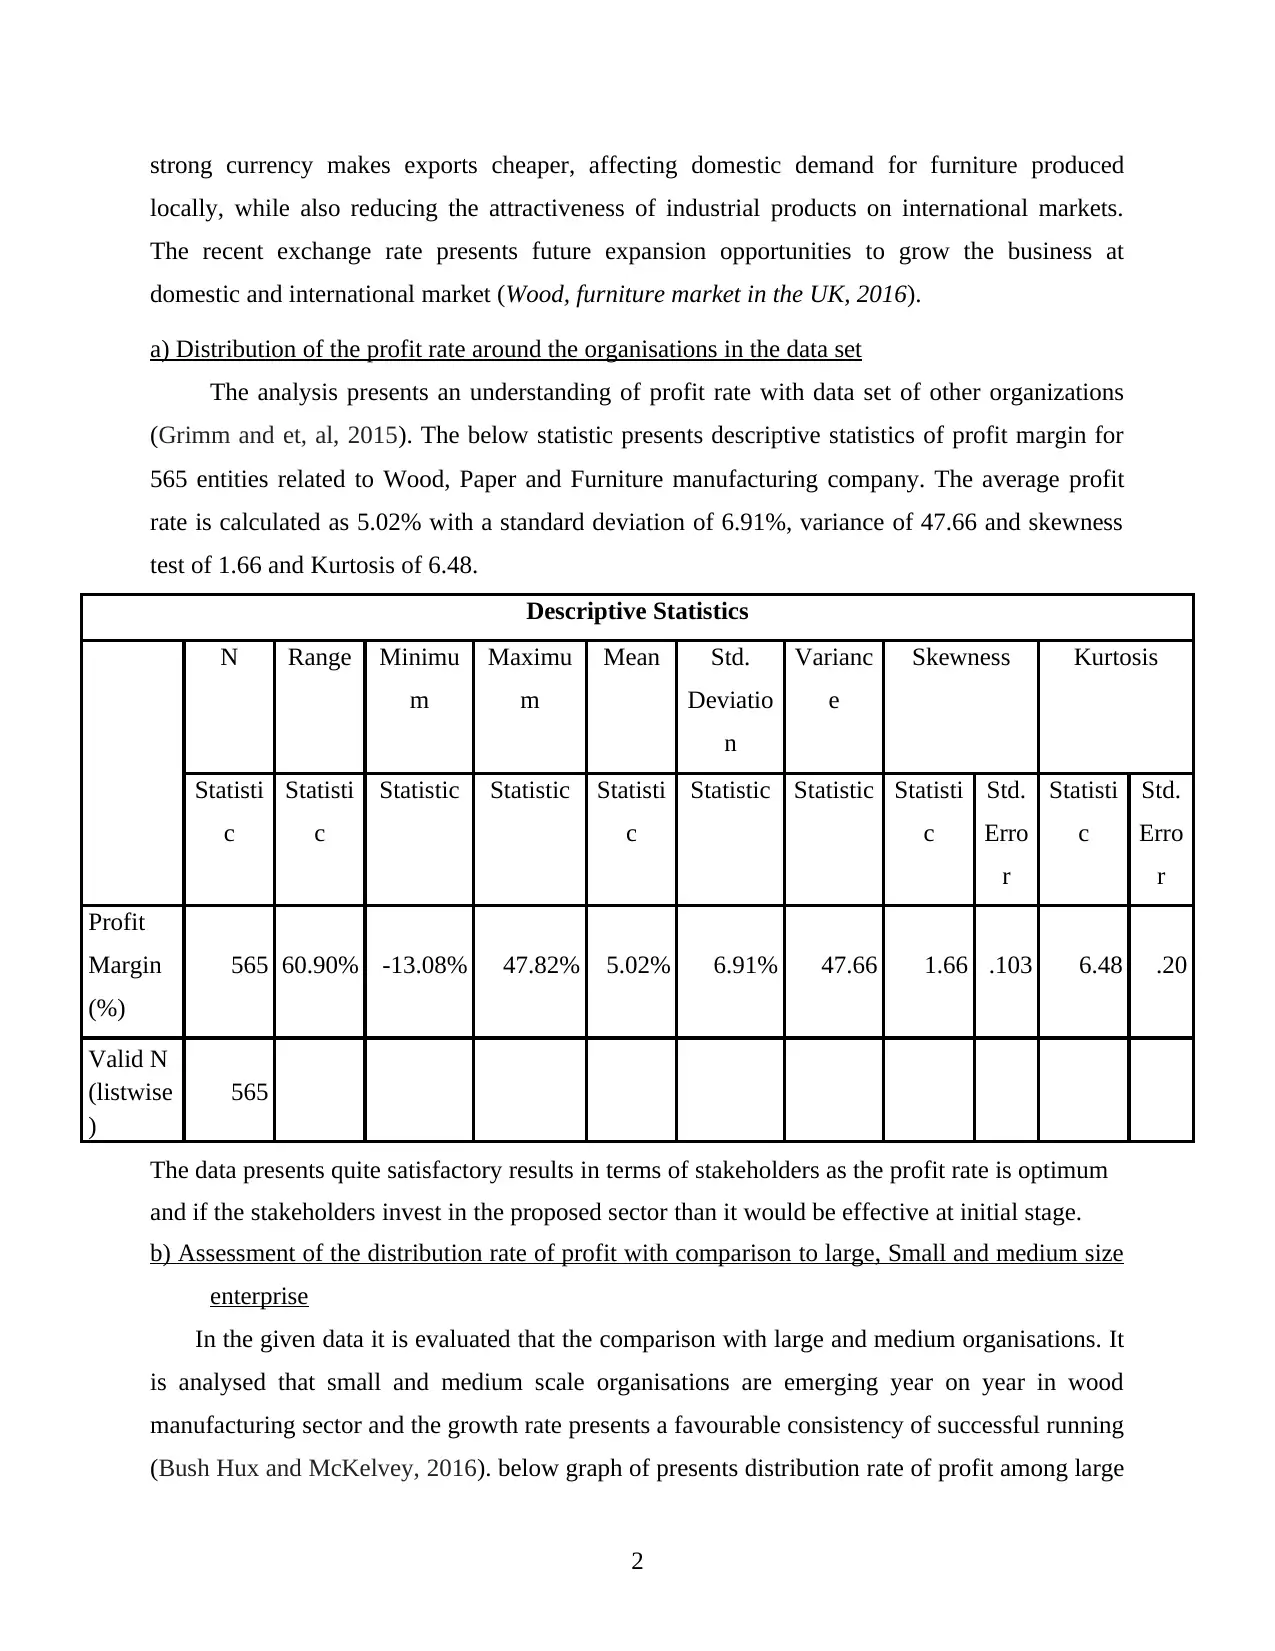
The analysis presents an understanding of profit rate with data set of other organizations
(Grimm and et, al, 2015). The below statistic presents descriptive statistics of profit margin for
565 entities related to Wood, Paper and Furniture manufacturing company. The average profit
rate is calculated as 5.02% with a standard deviation of 6.91%, variance of 47.66 and skewness
test of 1.66 and Kurtosis of 6.48.
Descriptive Statistics
N Range Minimu
m
Maximu
m
Mean Std.
Deviatio
n
Varianc
e
Skewness Kurtosis
Statisti
c
Statisti
c
Statistic Statistic Statisti
c
Statistic Statistic Statisti
c
Std.
Erro
r
Statisti
c
Std.
Erro
r
Profit
Margin
(%)
565 60.90% -13.08% 47.82% 5.02% 6.91% 47.66 1.66 .103 6.48 .20
Valid N
(listwise
)
565
The data presents quite satisfactory results in terms of stakeholders as the profit rate is optimum
and if the stakeholders invest in the proposed sector than it would be effective at initial stage.
b) Assessment of the distribution rate of profit with comparison to large, Small and medium size
enterprise
In the given data it is evaluated that the comparison with large and medium organisations. It
is analysed that small and medium scale organisations are emerging year on year in wood
manufacturing sector and the growth rate presents a favourable consistency of successful running
(Bush Hux and McKelvey, 2016). below graph of presents distribution rate of profit among large
2
locally, while also reducing the attractiveness of industrial products on international markets.
The recent exchange rate presents future expansion opportunities to grow the business at
domestic and international market (Wood, furniture market in the UK, 2016).
a) Distribution of the profit rate around the organisations in the data set
The analysis presents an understanding of profit rate with data set of other organizations
(Grimm and et, al, 2015). The below statistic presents descriptive statistics of profit margin for
565 entities related to Wood, Paper and Furniture manufacturing company. The average profit
rate is calculated as 5.02% with a standard deviation of 6.91%, variance of 47.66 and skewness
test of 1.66 and Kurtosis of 6.48.
Descriptive Statistics
N Range Minimu
m
Maximu
m
Mean Std.
Deviatio
n
Varianc
e
Skewness Kurtosis
Statisti
c
Statisti
c
Statistic Statistic Statisti
c
Statistic Statistic Statisti
c
Std.
Erro
r
Statisti
c
Std.
Erro
r
Profit
Margin
(%)
565 60.90% -13.08% 47.82% 5.02% 6.91% 47.66 1.66 .103 6.48 .20
Valid N
(listwise
)
565
The data presents quite satisfactory results in terms of stakeholders as the profit rate is optimum
and if the stakeholders invest in the proposed sector than it would be effective at initial stage.
b) Assessment of the distribution rate of profit with comparison to large, Small and medium size
enterprise
In the given data it is evaluated that the comparison with large and medium organisations. It
is analysed that small and medium scale organisations are emerging year on year in wood
manufacturing sector and the growth rate presents a favourable consistency of successful running
(Bush Hux and McKelvey, 2016). below graph of presents distribution rate of profit among large
2
Paraphrase This Document
Need a fresh take? Get an instant paraphrase of this document with our AI Paraphraser
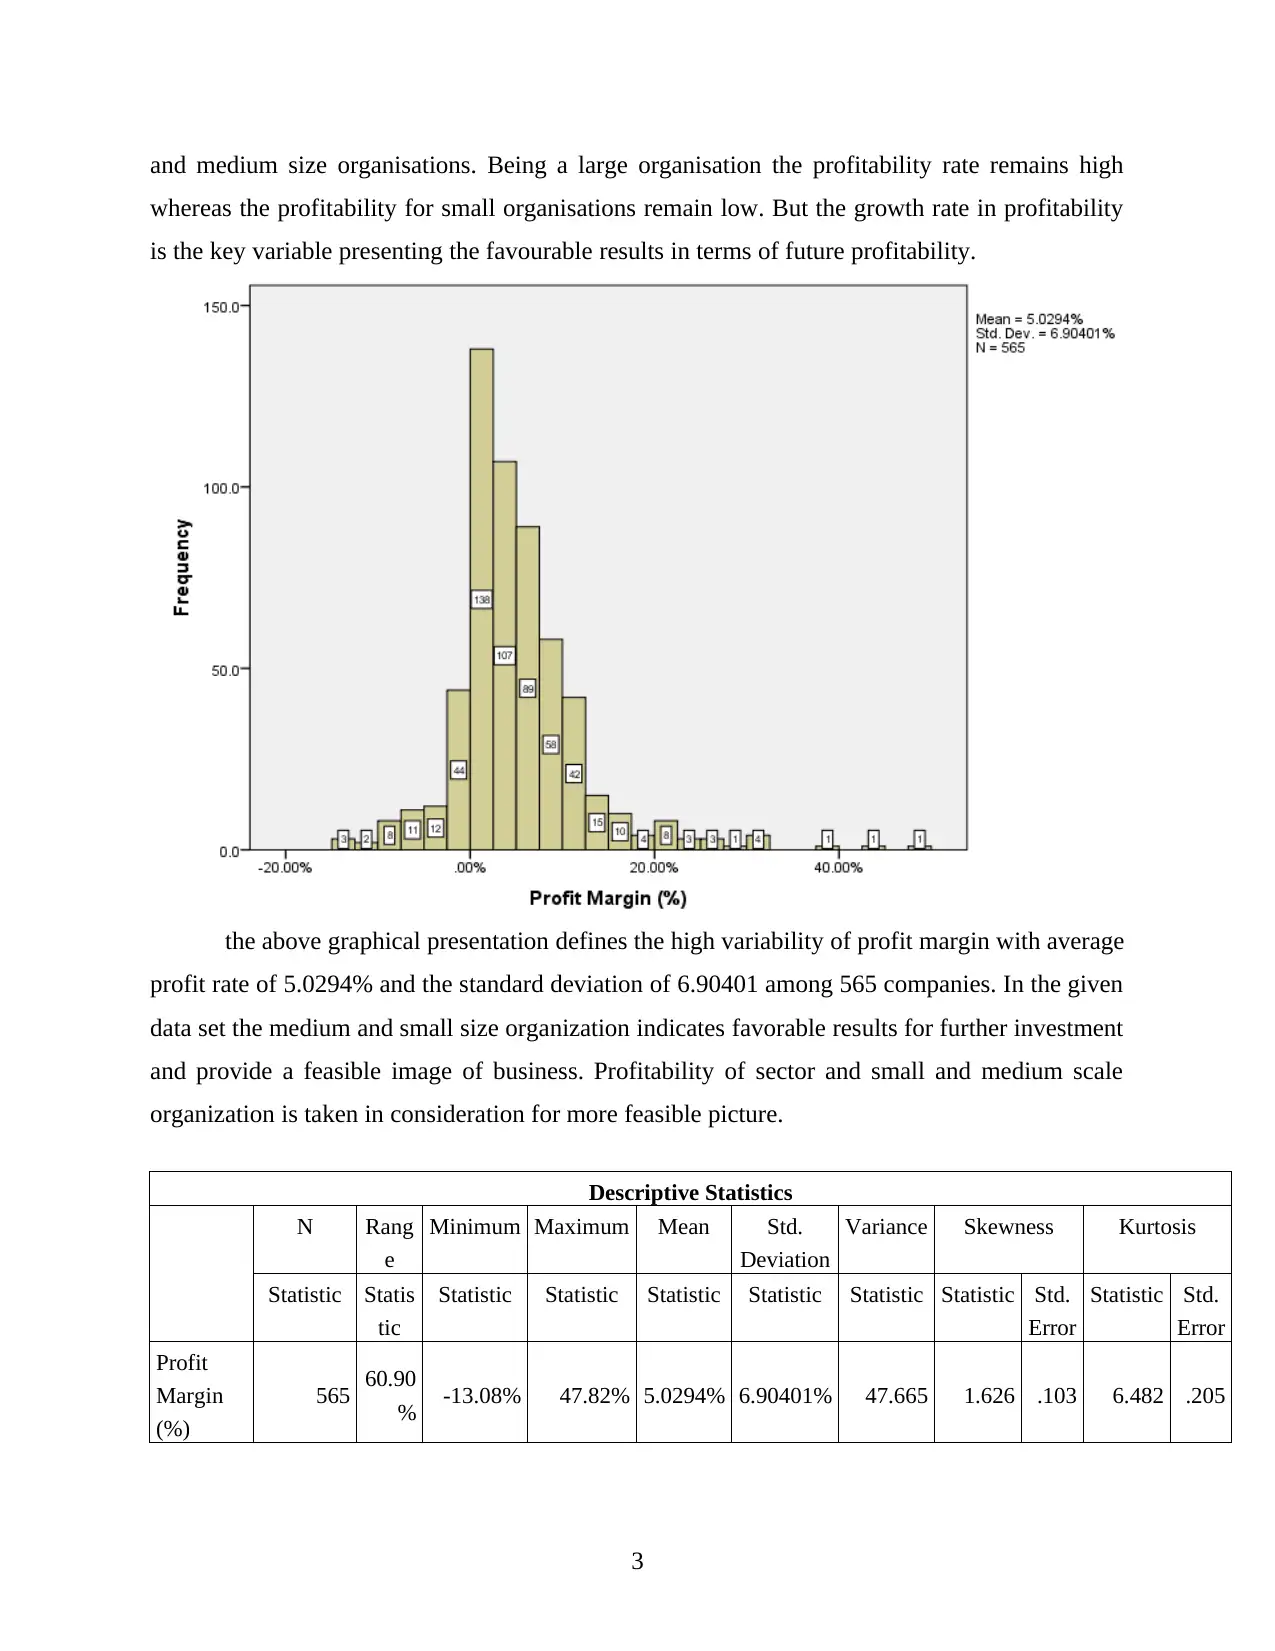
and medium size organisations. Being a large organisation the profitability rate remains high
whereas the profitability for small organisations remain low. But the growth rate in profitability
is the key variable presenting the favourable results in terms of future profitability.
the above graphical presentation defines the high variability of profit margin with average
profit rate of 5.0294% and the standard deviation of 6.90401 among 565 companies. In the given
data set the medium and small size organization indicates favorable results for further investment
and provide a feasible image of business. Profitability of sector and small and medium scale
organization is taken in consideration for more feasible picture.
Descriptive Statistics
N Rang
e
Minimum Maximum Mean Std.
Deviation
Variance Skewness Kurtosis
Statistic Statis
tic
Statistic Statistic Statistic Statistic Statistic Statistic Std.
Error
Statistic Std.
Error
Profit
Margin
(%)
565 60.90
% -13.08% 47.82% 5.0294% 6.90401% 47.665 1.626 .103 6.482 .205
3
SME
indicator
1=SME
Size
2=Large
565 1 1 2 1.22 .413 .171 1.372 .103 -.119 .205
Valid N
(listwise) 565
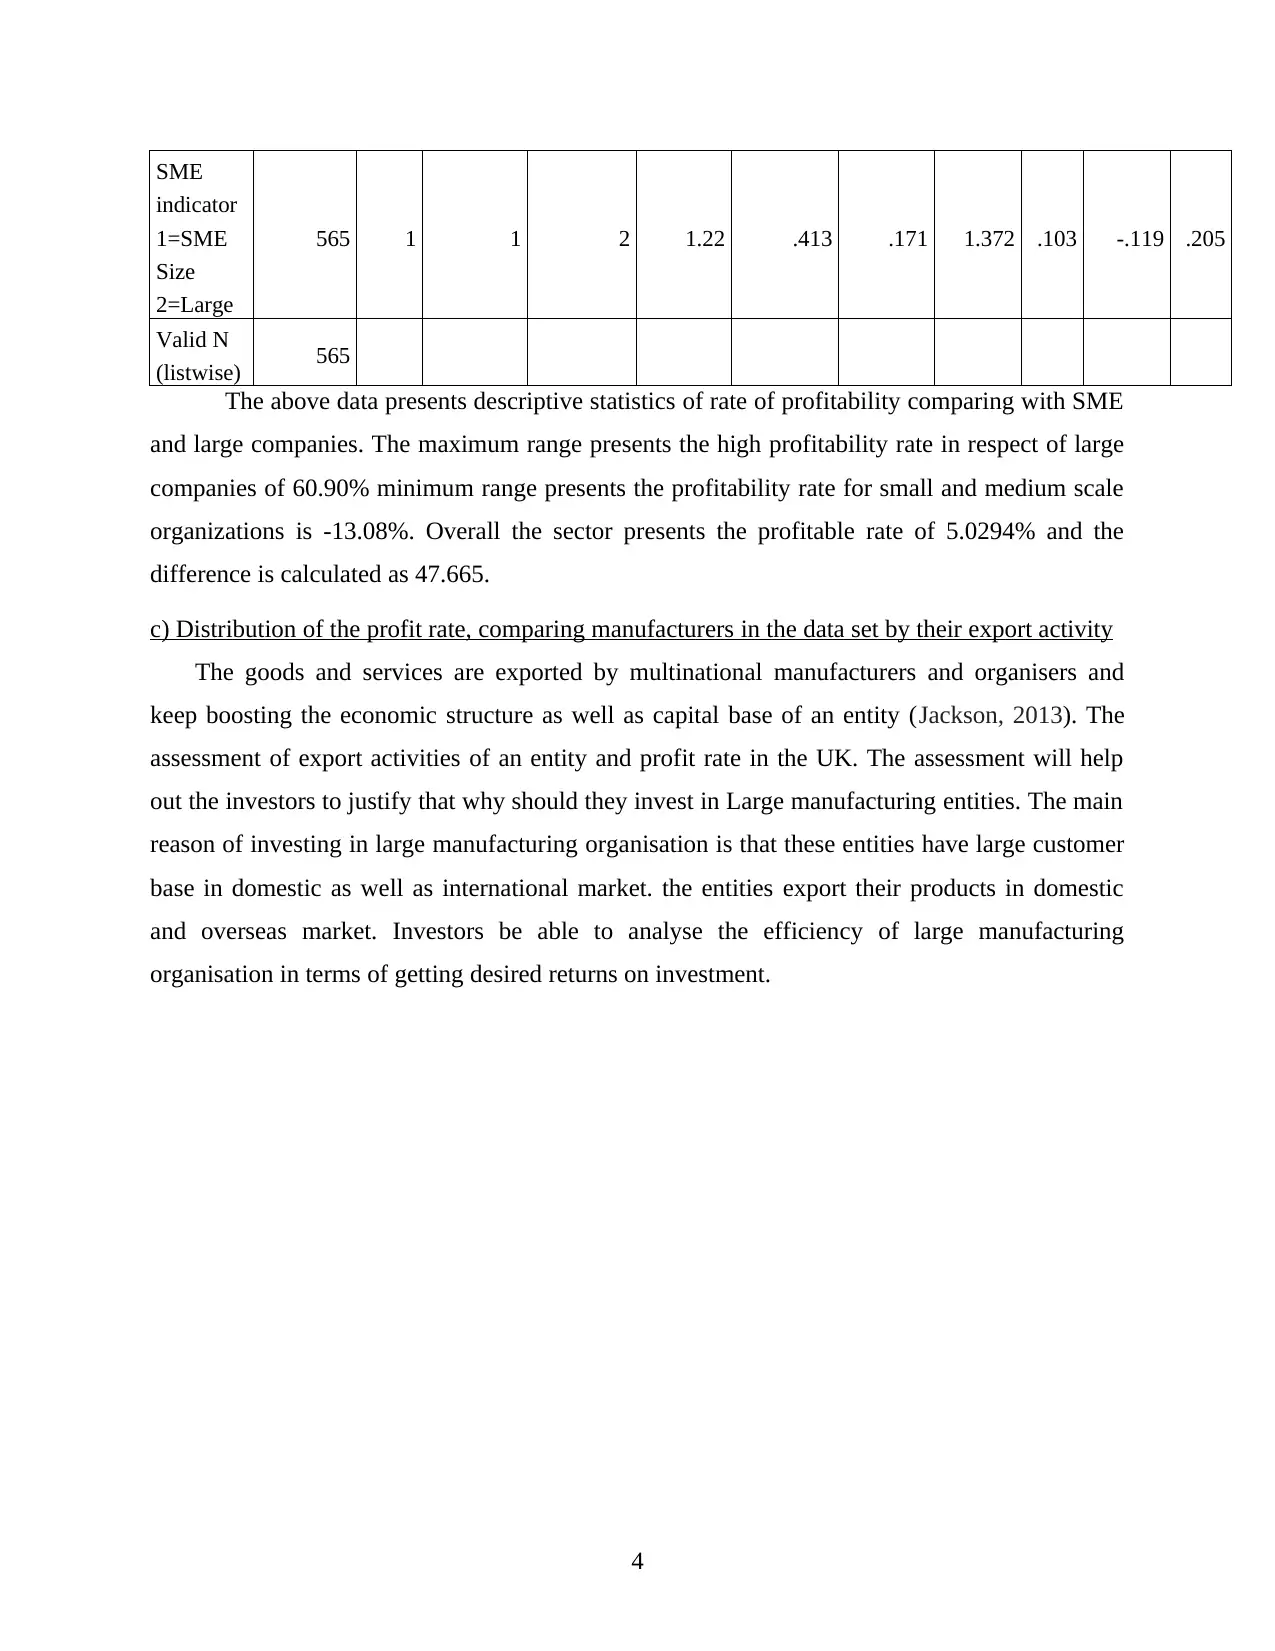
The above data presents descriptive statistics of rate of profitability comparing with SME
and large companies. The maximum range presents the high profitability rate in respect of large
companies of 60.90% minimum range presents the profitability rate for small and medium scale
organizations is -13.08%. Overall the sector presents the profitable rate of 5.0294% and the
difference is calculated as 47.665.
c) Distribution of the profit rate, comparing manufacturers in the data set by their export activity
The goods and services are exported by multinational manufacturers and organisers and
keep boosting the economic structure as well as capital base of an entity (Jackson, 2013). The
assessment of export activities of an entity and profit rate in the UK. The assessment will help
out the investors to justify that why should they invest in Large manufacturing entities. The main
reason of investing in large manufacturing organisation is that these entities have large customer
base in domestic as well as international market. the entities export their products in domestic
and overseas market. Investors be able to analyse the efficiency of large manufacturing
organisation in terms of getting desired returns on investment.
4
indicator
1=SME
Size
2=Large
565 1 1 2 1.22 .413 .171 1.372 .103 -.119 .205
Valid N
(listwise) 565
The above data presents descriptive statistics of rate of profitability comparing with SME
and large companies. The maximum range presents the high profitability rate in respect of large
companies of 60.90% minimum range presents the profitability rate for small and medium scale
organizations is -13.08%. Overall the sector presents the profitable rate of 5.0294% and the
difference is calculated as 47.665.
c) Distribution of the profit rate, comparing manufacturers in the data set by their export activity
The goods and services are exported by multinational manufacturers and organisers and
keep boosting the economic structure as well as capital base of an entity (Jackson, 2013). The
assessment of export activities of an entity and profit rate in the UK. The assessment will help
out the investors to justify that why should they invest in Large manufacturing entities. The main
reason of investing in large manufacturing organisation is that these entities have large customer
base in domestic as well as international market. the entities export their products in domestic
and overseas market. Investors be able to analyse the efficiency of large manufacturing
organisation in terms of getting desired returns on investment.
4
⊘ This is a preview!⊘
Do you want full access?
Subscribe today to unlock all pages.
Trusted by 1+ million students worldwide
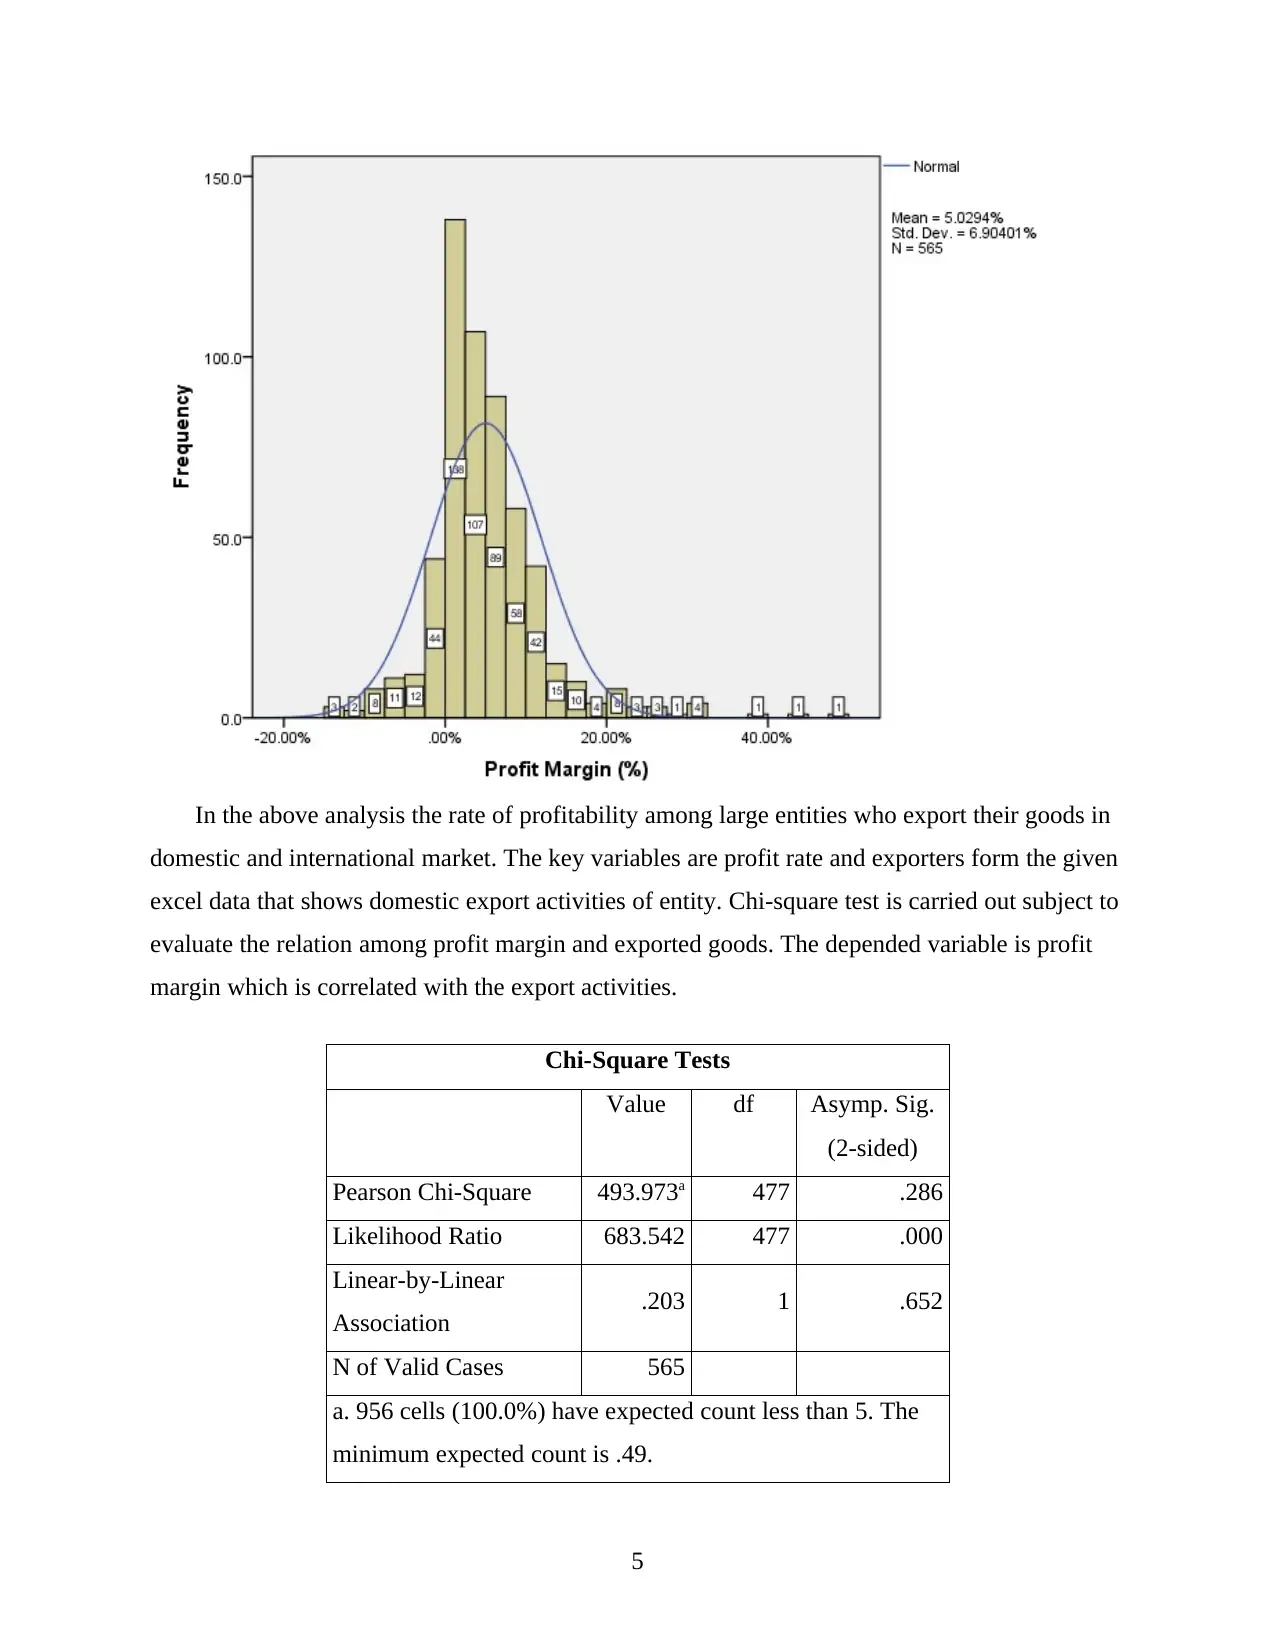
In the above analysis the rate of profitability among large entities who export their goods in
domestic and international market. The key variables are profit rate and exporters form the given
excel data that shows domestic export activities of entity. Chi-square test is carried out subject to
evaluate the relation among profit margin and exported goods. The depended variable is profit
margin which is correlated with the export activities.
Chi-Square Tests
Value df Asymp. Sig.
(2-sided)
Pearson Chi-Square 493.973a 477 .286
Likelihood Ratio 683.542 477 .000
Linear-by-Linear
Association .203 1 .652
N of Valid Cases 565
a. 956 cells (100.0%) have expected count less than 5. The
minimum expected count is .49.
5
Paraphrase This Document
Need a fresh take? Get an instant paraphrase of this document with our AI Paraphraser
The above test presents the relation among the variables as profit margin and export
activities are quite significant with profitability. The linear by liner significant difference among
variables were recorded as 0.652. Liner ratio was evaluated as 683.542.
d) Distribution of Return on Capital Employed comparing large and SME manufacturers in the
data set
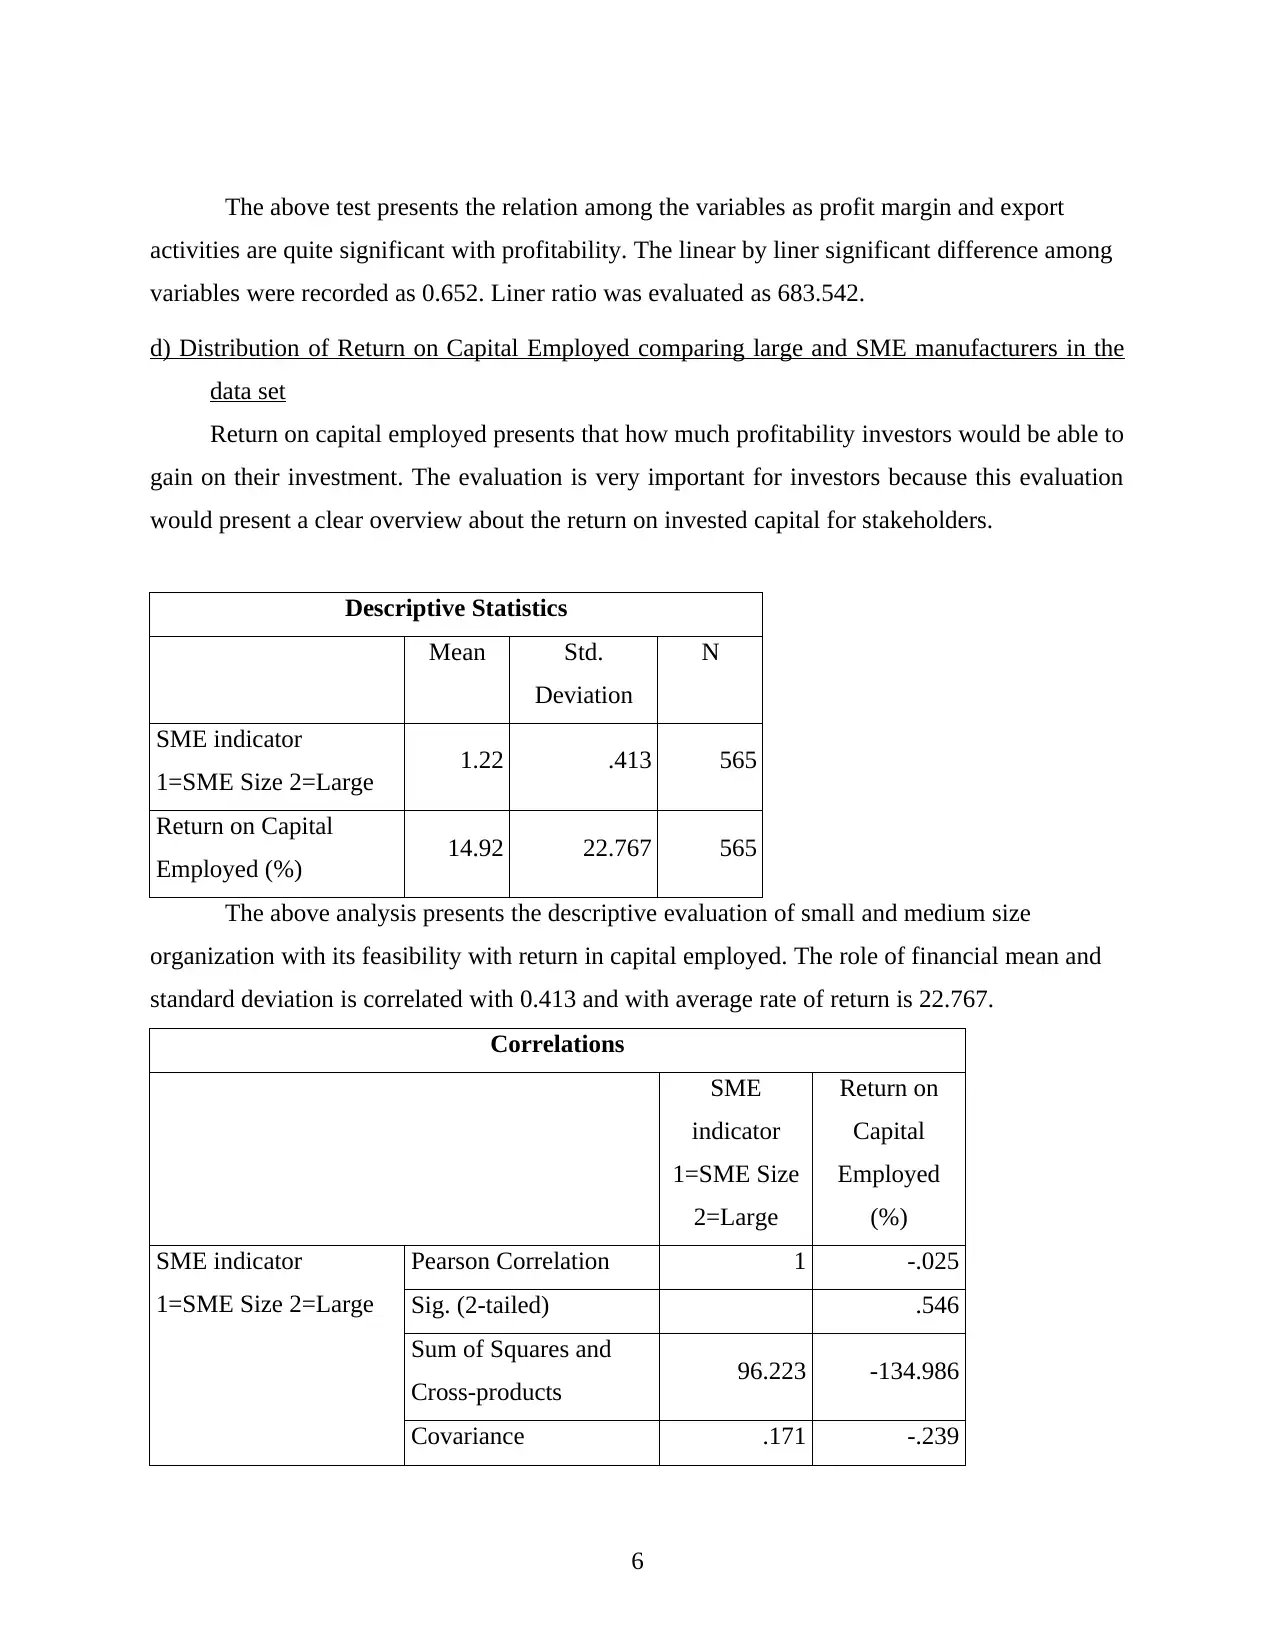
Return on capital employed presents that how much profitability investors would be able to
gain on their investment. The evaluation is very important for investors because this evaluation
would present a clear overview about the return on invested capital for stakeholders.
Descriptive Statistics
Mean Std.
Deviation
N
SME indicator
1=SME Size 2=Large 1.22 .413 565
Return on Capital
Employed (%) 14.92 22.767 565
The above analysis presents the descriptive evaluation of small and medium size
organization with its feasibility with return in capital employed. The role of financial mean and
standard deviation is correlated with 0.413 and with average rate of return is 22.767.
Correlations
SME
indicator
1=SME Size
2=Large
Return on
Capital
Employed
(%)
SME indicator
1=SME Size 2=Large
Pearson Correlation 1 -.025
Sig. (2-tailed) .546
Sum of Squares and
Cross-products 96.223 -134.986
Covariance .171 -.239
6
activities are quite significant with profitability. The linear by liner significant difference among
variables were recorded as 0.652. Liner ratio was evaluated as 683.542.
d) Distribution of Return on Capital Employed comparing large and SME manufacturers in the
data set
Return on capital employed presents that how much profitability investors would be able to
gain on their investment. The evaluation is very important for investors because this evaluation
would present a clear overview about the return on invested capital for stakeholders.
Descriptive Statistics
Mean Std.
Deviation
N
SME indicator
1=SME Size 2=Large 1.22 .413 565
Return on Capital
Employed (%) 14.92 22.767 565
The above analysis presents the descriptive evaluation of small and medium size
organization with its feasibility with return in capital employed. The role of financial mean and
standard deviation is correlated with 0.413 and with average rate of return is 22.767.
Correlations
SME
indicator
1=SME Size
2=Large
Return on
Capital
Employed
(%)
SME indicator
1=SME Size 2=Large
Pearson Correlation 1 -.025
Sig. (2-tailed) .546
Sum of Squares and
Cross-products 96.223 -134.986
Covariance .171 -.239
6
N 565 565
Return on Capital
Employed (%)
Pearson Correlation -.025 1
Sig. (2-tailed) .546
Sum of Squares and
Cross-products -134.986 292348.255
Covariance -.239 518.348
N 565 565
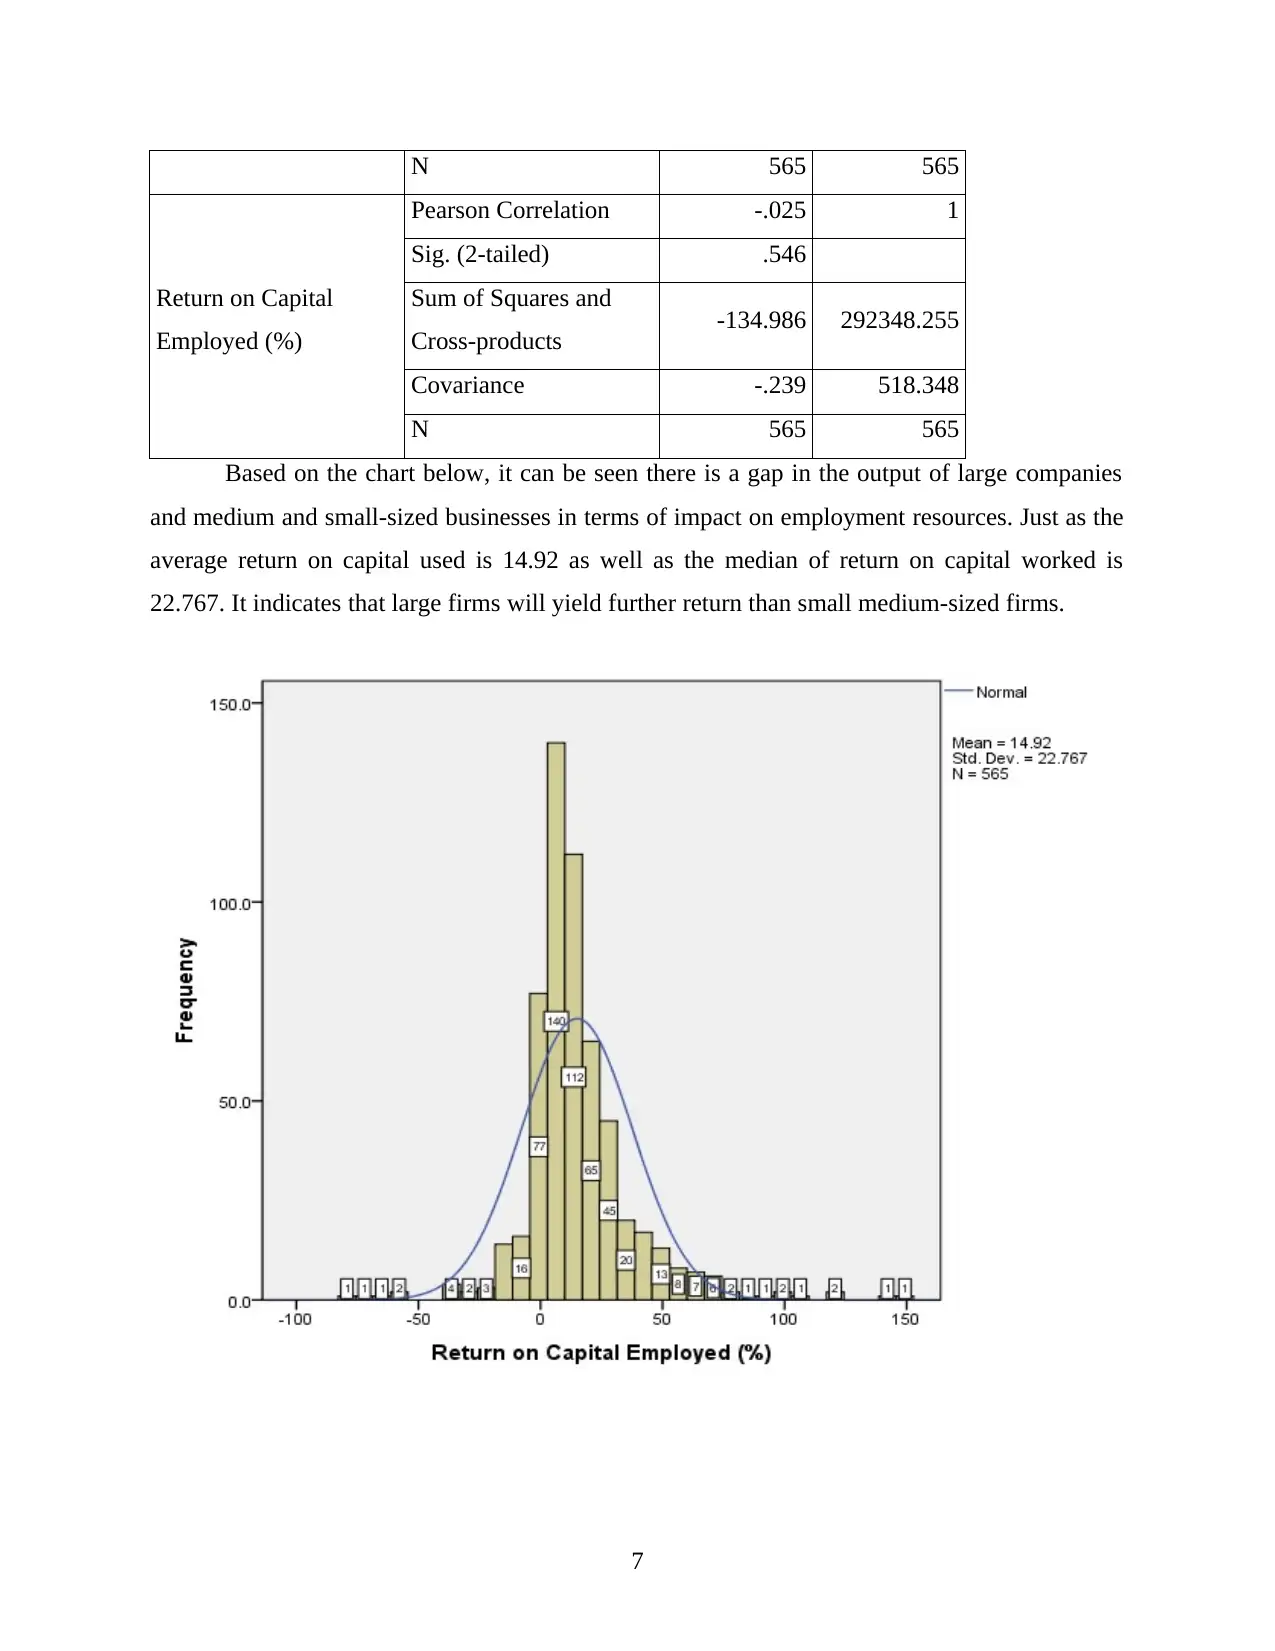
Based on the chart below, it can be seen there is a gap in the output of large companies
and medium and small-sized businesses in terms of impact on employment resources. Just as the
average return on capital used is 14.92 as well as the median of return on capital worked is
22.767. It indicates that large firms will yield further return than small medium-sized firms.
7
Return on Capital
Employed (%)
Pearson Correlation -.025 1
Sig. (2-tailed) .546
Sum of Squares and
Cross-products -134.986 292348.255
Covariance -.239 518.348
N 565 565
Based on the chart below, it can be seen there is a gap in the output of large companies
and medium and small-sized businesses in terms of impact on employment resources. Just as the
average return on capital used is 14.92 as well as the median of return on capital worked is
22.767. It indicates that large firms will yield further return than small medium-sized firms.
7
⊘ This is a preview!⊘
Do you want full access?
Subscribe today to unlock all pages.
Trusted by 1+ million students worldwide
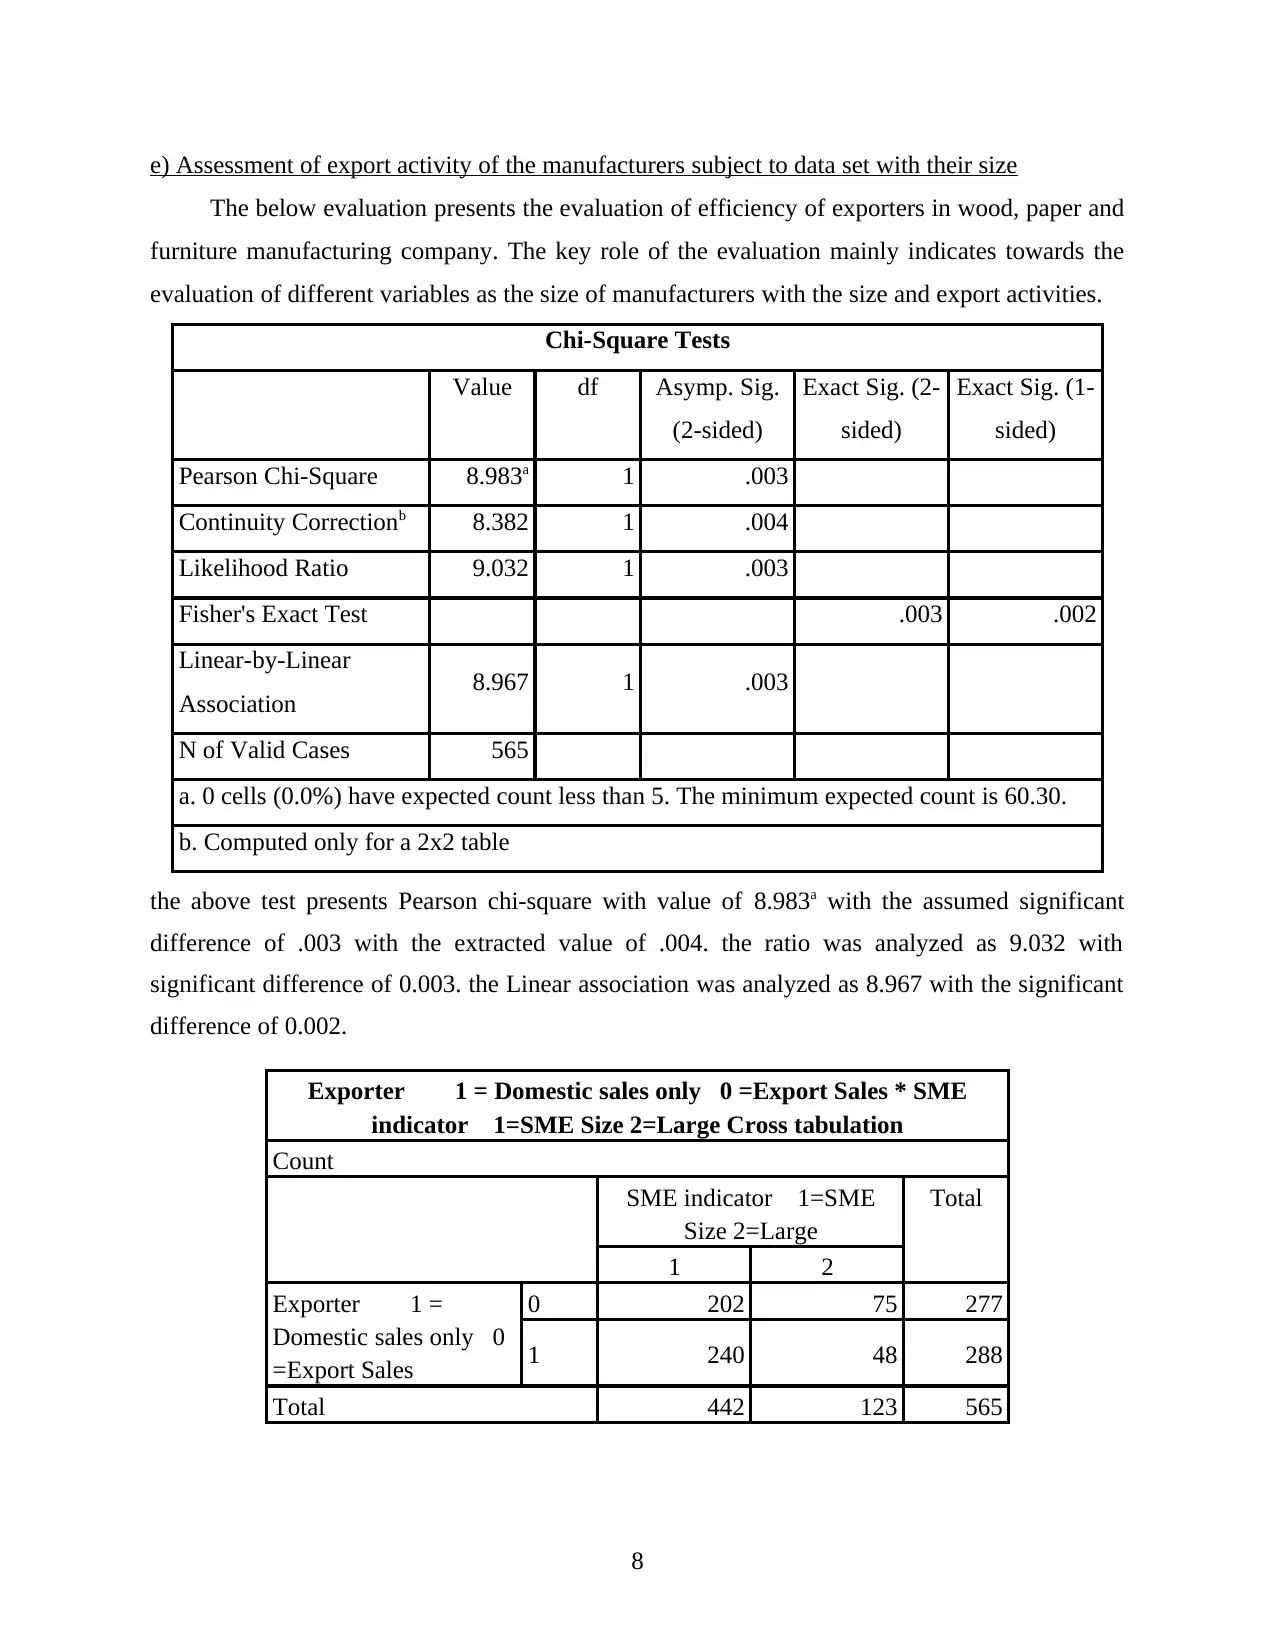
e) Assessment of export activity of the manufacturers subject to data set with their size
The below evaluation presents the evaluation of efficiency of exporters in wood, paper and
furniture manufacturing company. The key role of the evaluation mainly indicates towards the
evaluation of different variables as the size of manufacturers with the size and export activities.
Chi-Square Tests
Value df Asymp. Sig.
(2-sided)
Exact Sig. (2-
sided)
Exact Sig. (1-
sided)
Pearson Chi-Square 8.983a 1 .003
Continuity Correctionb 8.382 1 .004
Likelihood Ratio 9.032 1 .003
Fisher's Exact Test .003 .002
Linear-by-Linear
Association 8.967 1 .003
N of Valid Cases 565
a. 0 cells (0.0%) have expected count less than 5. The minimum expected count is 60.30.
b. Computed only for a 2x2 table
the above test presents Pearson chi-square with value of 8.983a with the assumed significant
difference of .003 with the extracted value of .004. the ratio was analyzed as 9.032 with
significant difference of 0.003. the Linear association was analyzed as 8.967 with the significant
difference of 0.002.
Exporter 1 = Domestic sales only 0 =Export Sales * SME
indicator 1=SME Size 2=Large Cross tabulation
Count
SME indicator 1=SME
Size 2=Large
Total
1 2
Exporter 1 =
Domestic sales only 0
=Export Sales
0 202 75 277
1 240 48 288
Total 442 123 565
8
Paraphrase This Document
Need a fresh take? Get an instant paraphrase of this document with our AI Paraphraser
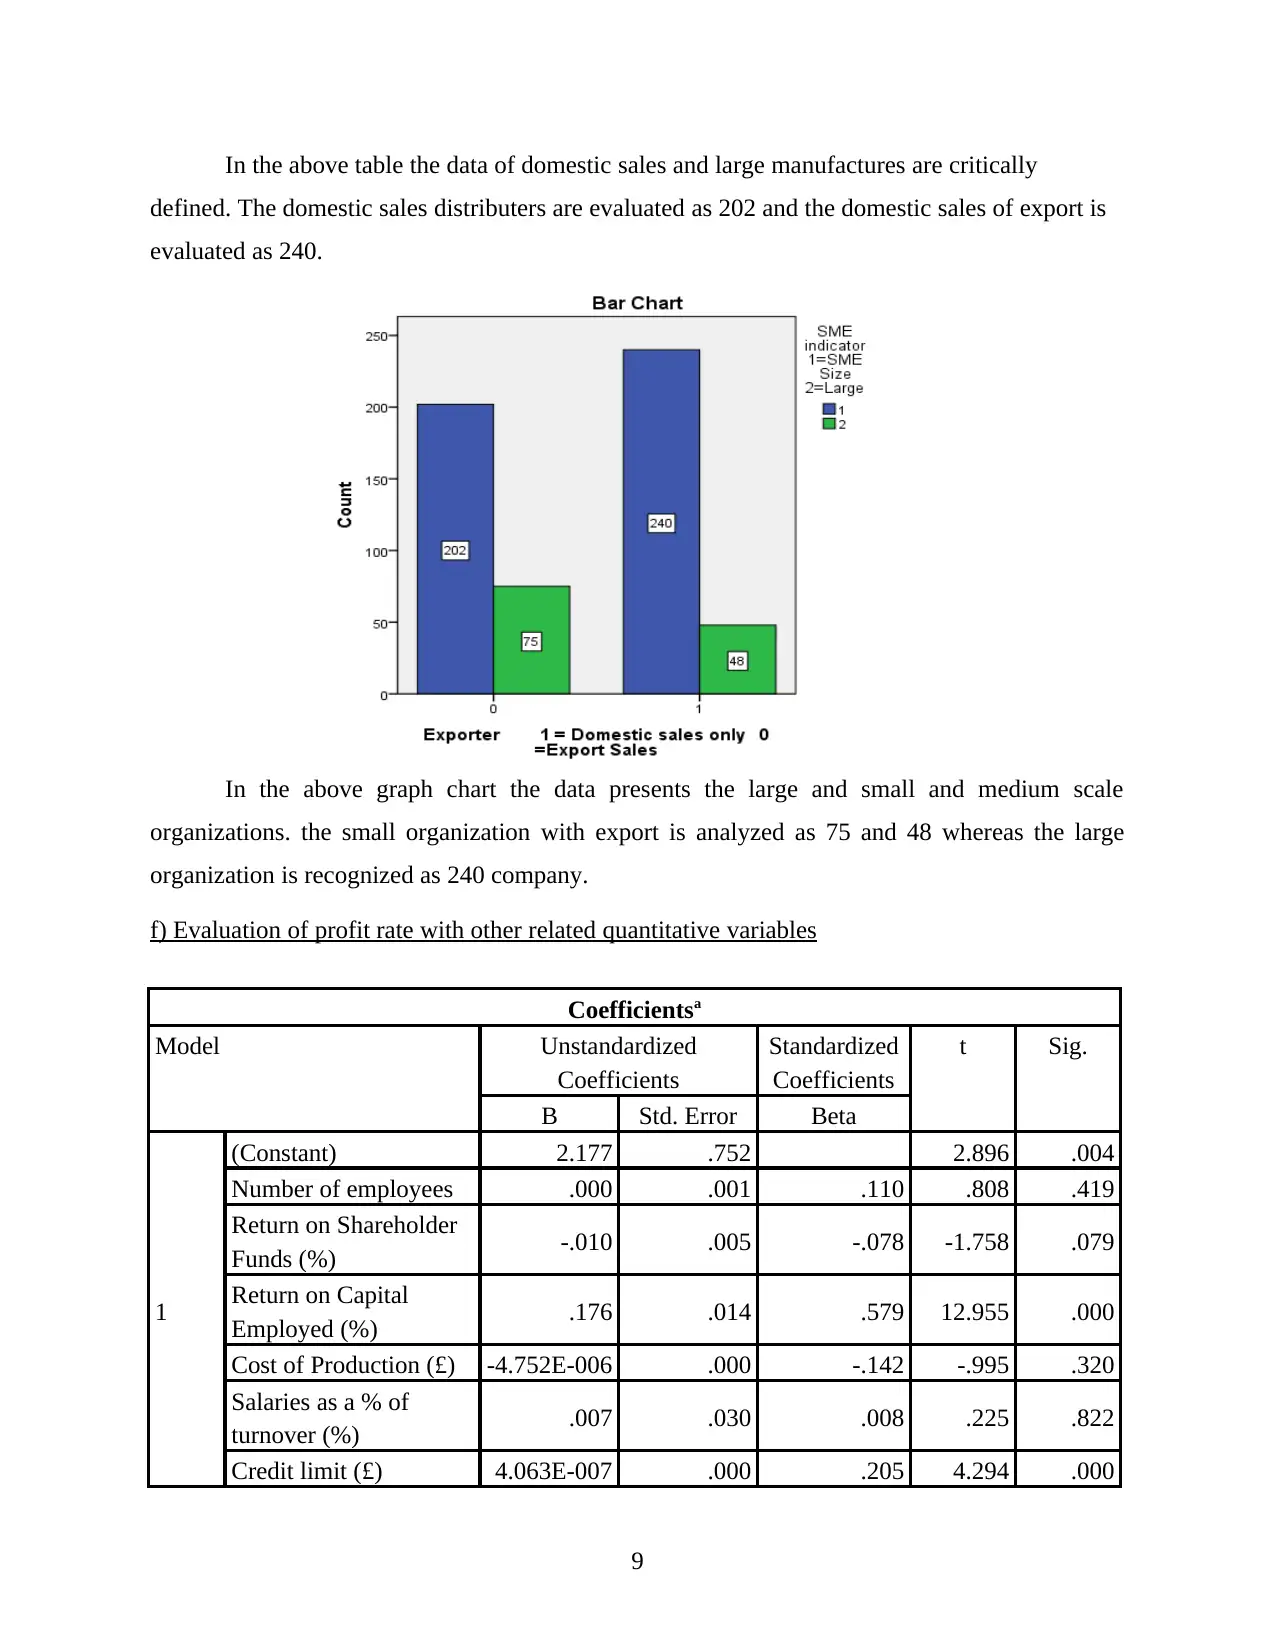
In the above table the data of domestic sales and large manufactures are critically
defined. The domestic sales distributers are evaluated as 202 and the domestic sales of export is
evaluated as 240.
In the above graph chart the data presents the large and small and medium scale
organizations. the small organization with export is analyzed as 75 and 48 whereas the large
organization is recognized as 240 company.
f) Evaluation of profit rate with other related quantitative variables
Coefficientsa
Model Unstandardized
Coefficients
Standardized
Coefficients
t Sig.
B Std. Error Beta
1
(Constant) 2.177 .752 2.896 .004
Number of employees .000 .001 .110 .808 .419
Return on Shareholder
Funds (%) -.010 .005 -.078 -1.758 .079
Return on Capital
Employed (%) .176 .014 .579 12.955 .000
Cost of Production (£) -4.752E-006 .000 -.142 -.995 .320
Salaries as a % of
turnover (%) .007 .030 .008 .225 .822
Credit limit (£) 4.063E-007 .000 .205 4.294 .000
9
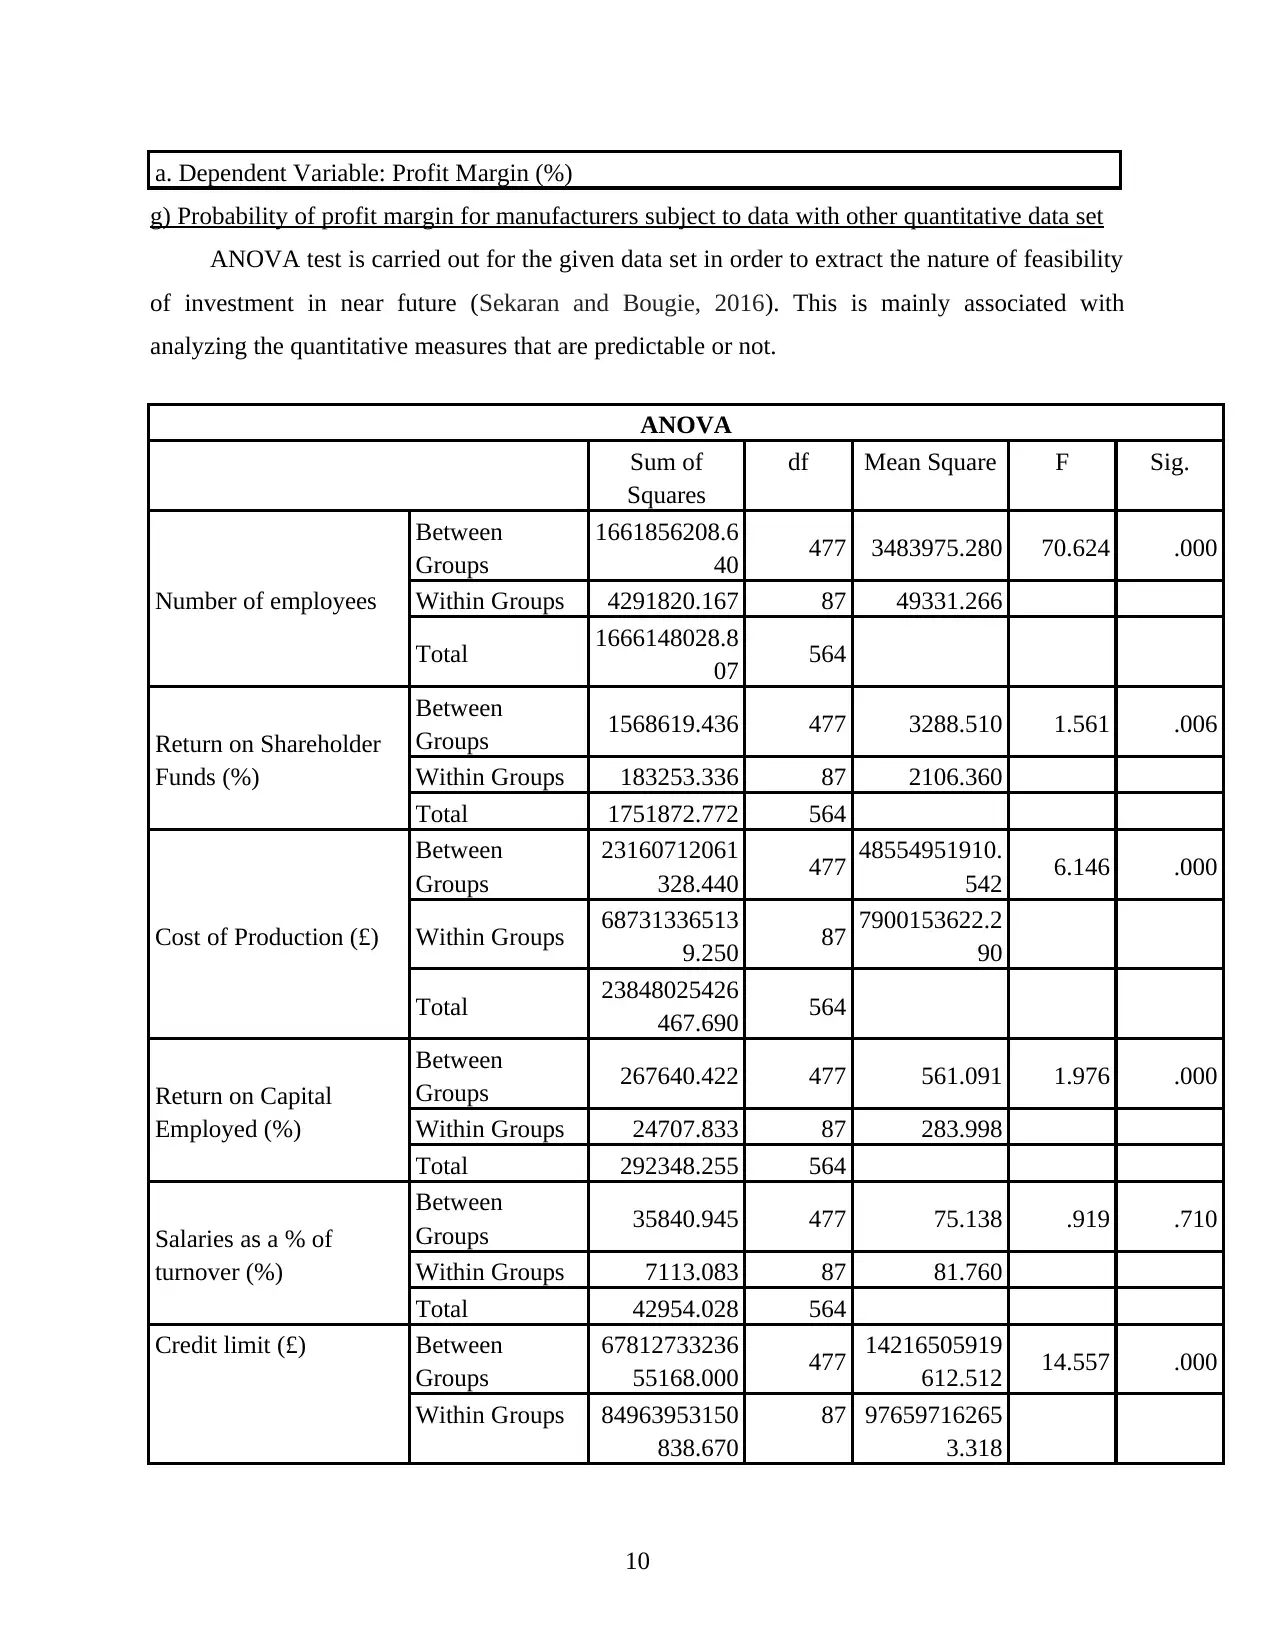
a. Dependent Variable: Profit Margin (%)
g) Probability of profit margin for manufacturers subject to data with other quantitative data set
ANOVA test is carried out for the given data set in order to extract the nature of feasibility
of investment in near future (Sekaran and Bougie, 2016). This is mainly associated with
analyzing the quantitative measures that are predictable or not.
ANOVA
Sum of
Squares
df Mean Square F Sig.
Number of employees
Between
Groups
1661856208.6
40 477 3483975.280 70.624 .000
Within Groups 4291820.167 87 49331.266
Total 1666148028.8
07 564
Return on Shareholder
Funds (%)
Between
Groups 1568619.436 477 3288.510 1.561 .006
Within Groups 183253.336 87 2106.360
Total 1751872.772 564
Cost of Production (£)
Between
Groups
23160712061
328.440 477 48554951910.
542 6.146 .000
Within Groups 68731336513
9.250 87 7900153622.2
90
Total 23848025426
467.690 564
Return on Capital
Employed (%)
Between
Groups 267640.422 477 561.091 1.976 .000
Within Groups 24707.833 87 283.998
Total 292348.255 564
Salaries as a % of
turnover (%)
Between
Groups 35840.945 477 75.138 .919 .710
Within Groups 7113.083 87 81.760
Total 42954.028 564
Credit limit (£) Between
Groups
67812733236
55168.000 477 14216505919
612.512 14.557 .000
Within Groups 84963953150
838.670
87 97659716265
3.318
10
⊘ This is a preview!⊘
Do you want full access?
Subscribe today to unlock all pages.
Trusted by 1+ million students worldwide
1 out of 14
Related Documents
![University of [University Name] 5EC511 Individual Client Report CW2](/_next/image/?url=https%3A%2F%2Fdesklib.com%2Fmedia%2Fimages%2Fgi%2Fb135193de65d4a1585a81f9151357dec.jpg&w=256&q=75)


Your All-in-One AI-Powered Toolkit for Academic Success.
+13062052269
info@desklib.com
Available 24*7 on WhatsApp / Email
![[object Object]](/_next/static/media/star-bottom.7253800d.svg)
Unlock your academic potential
Copyright © 2020–2026 A2Z Services. All Rights Reserved. Developed and managed by ZUCOL.