LCBB4001 Accounting Fundamentals: Kedison & Chocco Plc Report
VerifiedAdded on 2023/06/18
|8
|1384
|410
Homework Assignment
AI Summary
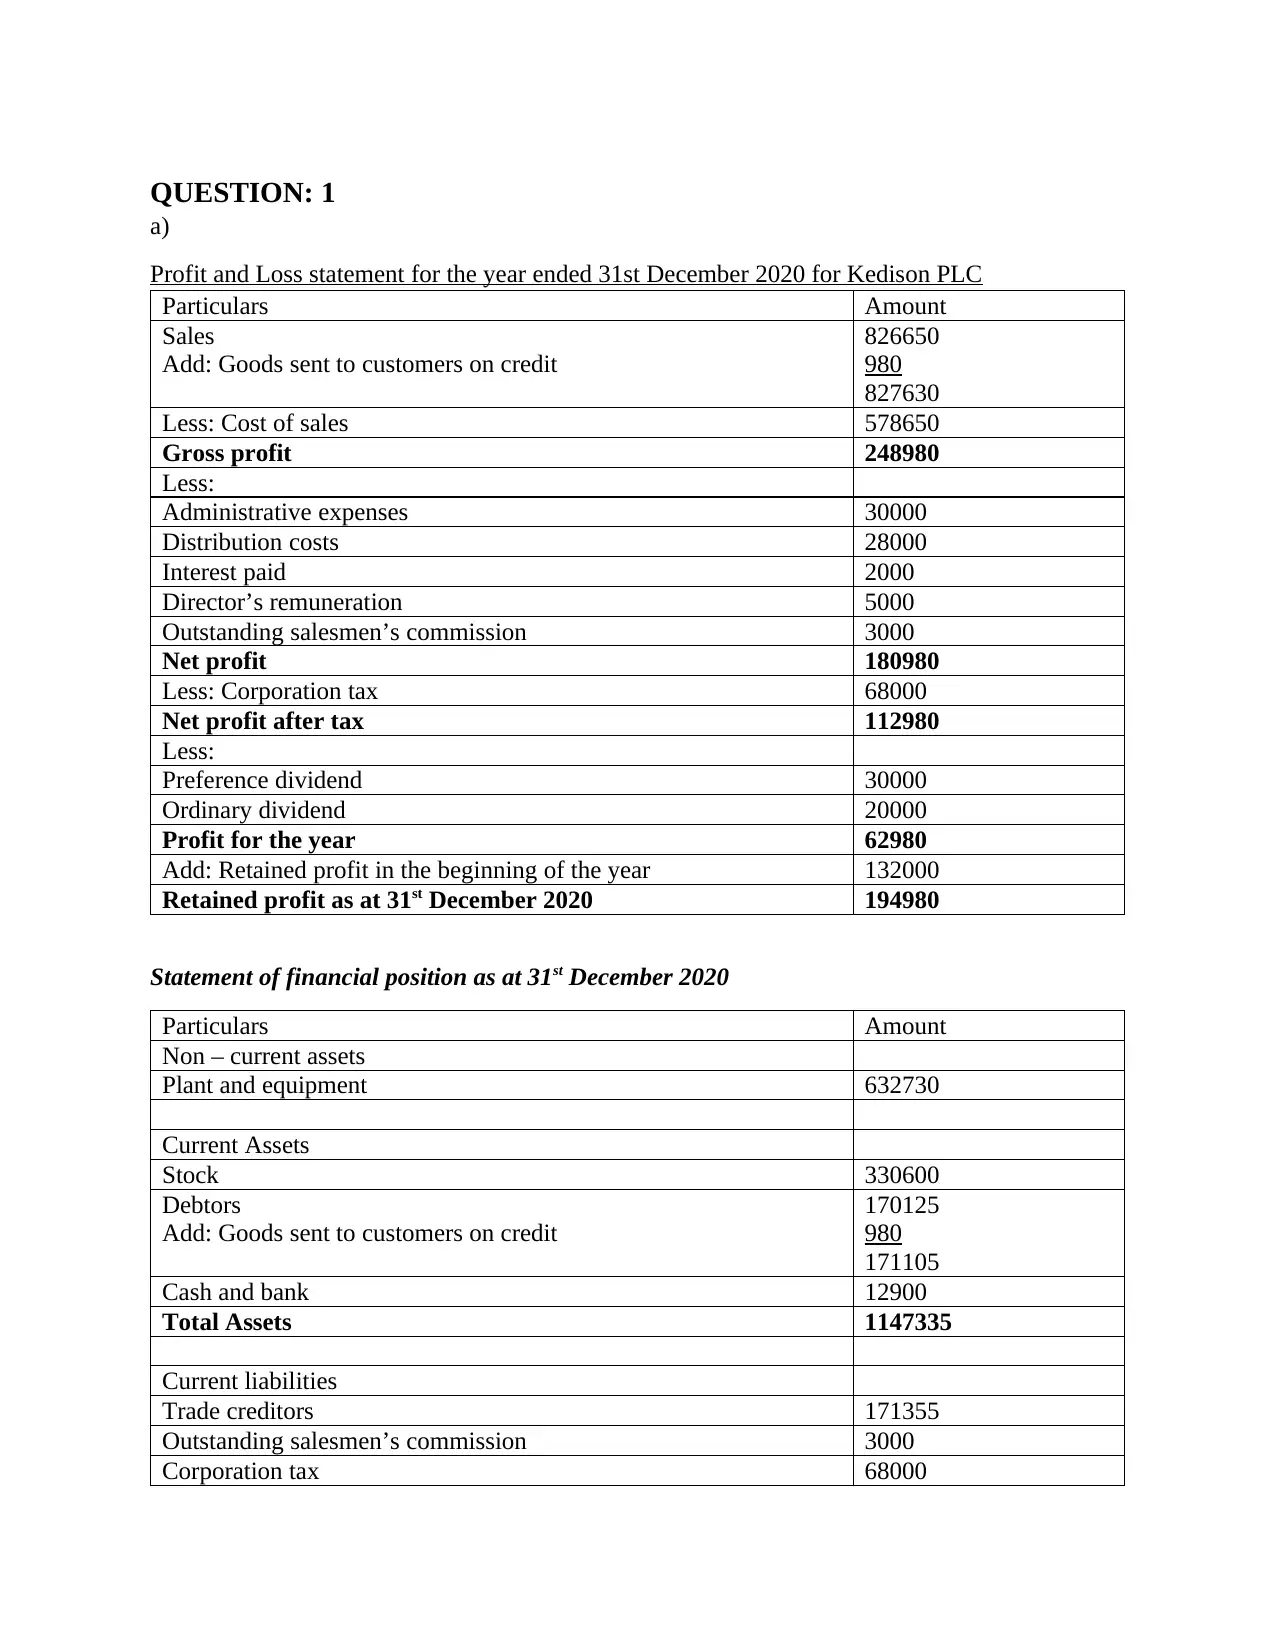
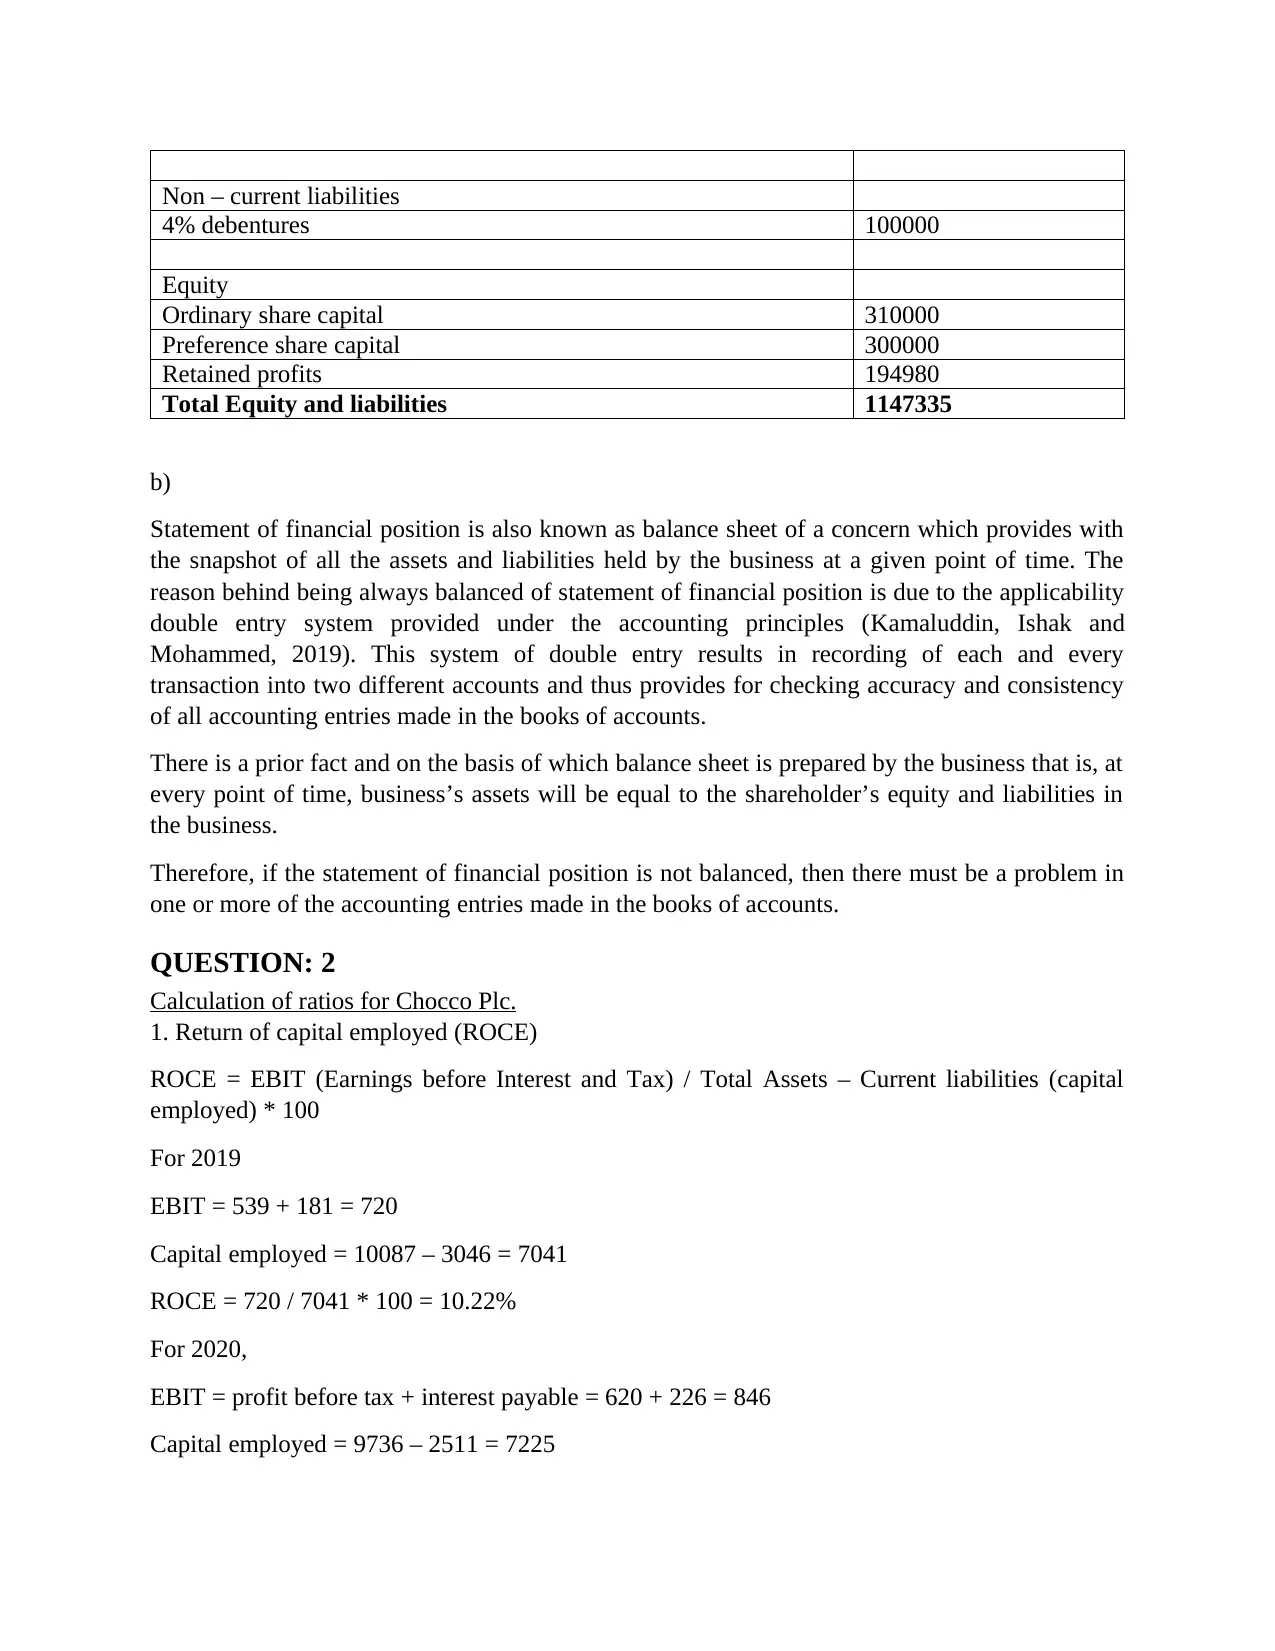
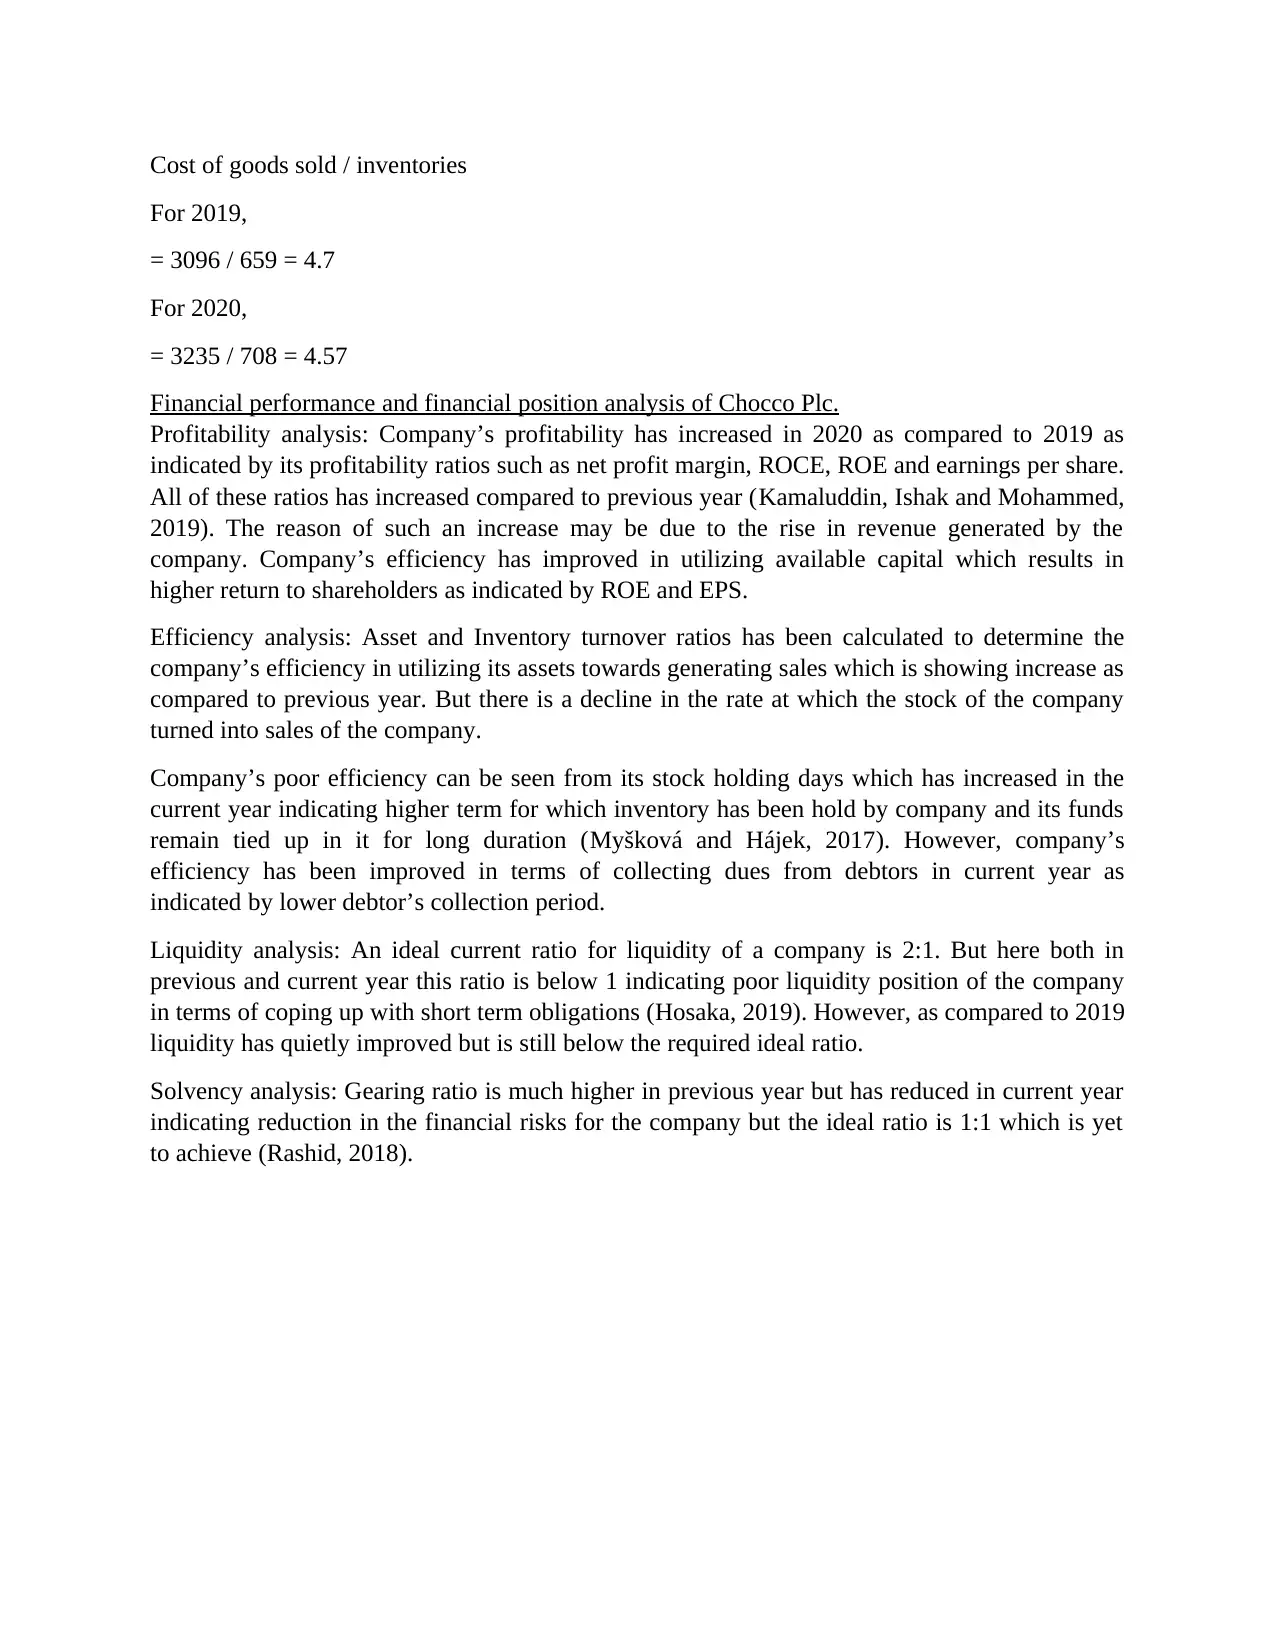
This assignment focuses on the financial analysis of two companies, Kedison PLC and Chocco Plc, using accounting fundamentals. For Kedison PLC, a profit and loss statement for the year ended December 31, 2020, is prepared, along with a statement of financial position. The assignment explains the importance of a balanced statement of financial position due to the double-entry system. For Chocco Plc, various financial ratios are calculated for 2019 and 2020, including Return on Capital Employed (ROCE), Return on Equity (ROE), Earnings Per Share (EPS), Net Profit Margin, Asset Turnover Ratio, Stock Holding Days, Debtor's Collection Period, Current Ratio, Gearing Ratio, and Inventory Turnover Ratio. The analysis interprets these ratios to assess Chocco Plc's profitability, efficiency, liquidity, and solvency, highlighting changes and trends between the two years. The document emphasizes the importance of these ratios in understanding a company's financial health and performance. Desklib provides access to similar solved assignments and past papers for students.

ACCOUNTING
FUNDAMENTALS
FUNDAMENTALS
Paraphrase This Document
Need a fresh take? Get an instant paraphrase of this document with our AI Paraphraser

Table of Contents
QUESTION: 1.................................................................................................................................3
Profit and Loss statement for the year ended 31st December 2020 for Kedison PLC................3
QUESTION: 2.................................................................................................................................4
Calculation of ratios for Chocco Plc............................................................................................4
Financial performance and financial position analysis of Chocco Plc........................................7
REFERENCES................................................................................................................................8

QUESTION: 1
a)
Profit and Loss statement for the year ended 31st December 2020 for Kedison PLC
Particulars Amount
Sales
Add: Goods sent to customers on credit
826650
980
827630
Less: Cost of sales 578650
Gross profit 248980
Less:
Administrative expenses 30000
Distribution costs 28000
Interest paid 2000
Director’s remuneration 5000
Outstanding salesmen’s commission 3000
Net profit 180980
Less: Corporation tax 68000
Net profit after tax 112980
Less:
Preference dividend 30000
Ordinary dividend 20000
Profit for the year 62980
Add: Retained profit in the beginning of the year 132000
Retained profit as at 31st December 2020 194980
Statement of financial position as at 31st December 2020
Particulars Amount
Non – current assets
Plant and equipment 632730
Current Assets
Stock 330600
Debtors
Add: Goods sent to customers on credit
170125
980
171105
Cash and bank 12900
Total Assets 1147335
Current liabilities
Trade creditors 171355
Outstanding salesmen’s commission 3000
Corporation tax 68000
⊘ This is a preview!⊘
Do you want full access?
Subscribe today to unlock all pages.

Trusted by 1+ million students worldwide

Non – current liabilities
4% debentures 100000
Equity
Ordinary share capital 310000
Preference share capital 300000
Retained profits 194980
Total Equity and liabilities 1147335
b)
Statement of financial position is also known as balance sheet of a concern which provides with
the snapshot of all the assets and liabilities held by the business at a given point of time. The
reason behind being always balanced of statement of financial position is due to the applicability
double entry system provided under the accounting principles (Kamaluddin, Ishak and
Mohammed, 2019). This system of double entry results in recording of each and every
transaction into two different accounts and thus provides for checking accuracy and consistency
of all accounting entries made in the books of accounts.
There is a prior fact and on the basis of which balance sheet is prepared by the business that is, at
every point of time, business’s assets will be equal to the shareholder’s equity and liabilities in
the business.
Therefore, if the statement of financial position is not balanced, then there must be a problem in
one or more of the accounting entries made in the books of accounts.
QUESTION: 2
Calculation of ratios for Chocco Plc.
1. Return of capital employed (ROCE)
ROCE = EBIT (Earnings before Interest and Tax) / Total Assets – Current liabilities (capital
employed) * 100
For 2019
EBIT = 539 + 181 = 720
Capital employed = 10087 – 3046 = 7041
ROCE = 720 / 7041 * 100 = 10.22%
For 2020,
EBIT = profit before tax + interest payable = 620 + 226 = 846
Capital employed = 9736 – 2511 = 7225
Paraphrase This Document
Need a fresh take? Get an instant paraphrase of this document with our AI Paraphraser

ROCE = 846 / 7225 * 100 = 11.71%
2. ROE
Net income / Shareholder’s equity * 100
For 2019,
ROE = profit for the year / shareholder’s equity *100 = 366 / 2912 * 100 = 12.57%
For 2020,
ROE = 431 / 3088 * 100 = 13.96%
3. Earnings per share
Earnings available for shareholder or profit after tax / number of shares Outstanding
Number of shares outstanding = 300 / 0.5 = 600
For 2019,
EPS = 366 / 600 = 0.61
For 2020,
EPS = 431 / 600 = 0.72
4. Net profit margin
Net profit for the year / sales * 100
For 2019,
Net profit margin = 366 / 6441 * 100 = 5.68%
For 2020,
Net profit margin = 431 / 6738 * 100 = 6.4%
5. Asset turnover ratio
Revenue from sales / total assets
For 2019,
= 6441 / 10087 = 0.64
For 2020,
= 6738 / 9736 = 0.69
6. Stock holding days

Inventory / cost of goods sold * 365
For 2019,
= 659 / 3096 * 365 = 77.69 days
For 2020,
= 708 / 3235 * 365 = 79.88 days
7. Debtor’s Collection period
Trade receivable / Revenue from sales * 365
For 2019,
= 1287 / 6441 * 365 = 72.93 days
For 2020,
= 1249 / 6738 * 365 = 67.66 days
8. Current ratio
Current Assets / current liabilities
For 2019,
= 2355 / 3046 = 0.77
For 2020,
= 2303 / 2511 = 0.92
9. Gearing ratio
Total debt / Total equity
For 2019,
Total debt = loans and other borrowings + other creditors = 4129 + 2391 = 6520
Gearing ratio = 6520 / 2912 = 2.24 times
For 2020,
Total debt = 4137 + 1928 = 6065
Gearing ratio = 6065 / 3088 = 1.96 times
10. Inventory turnover ratio
For 2019,
= 659 / 3096 * 365 = 77.69 days
For 2020,
= 708 / 3235 * 365 = 79.88 days
7. Debtor’s Collection period
Trade receivable / Revenue from sales * 365
For 2019,
= 1287 / 6441 * 365 = 72.93 days
For 2020,
= 1249 / 6738 * 365 = 67.66 days
8. Current ratio
Current Assets / current liabilities
For 2019,
= 2355 / 3046 = 0.77
For 2020,
= 2303 / 2511 = 0.92
9. Gearing ratio
Total debt / Total equity
For 2019,
Total debt = loans and other borrowings + other creditors = 4129 + 2391 = 6520
Gearing ratio = 6520 / 2912 = 2.24 times
For 2020,
Total debt = 4137 + 1928 = 6065
Gearing ratio = 6065 / 3088 = 1.96 times
10. Inventory turnover ratio
⊘ This is a preview!⊘
Do you want full access?
Subscribe today to unlock all pages.

Trusted by 1+ million students worldwide

Cost of goods sold / inventories
For 2019,
= 3096 / 659 = 4.7
For 2020,
= 3235 / 708 = 4.57
Financial performance and financial position analysis of Chocco Plc.
Profitability analysis: Company’s profitability has increased in 2020 as compared to 2019 as
indicated by its profitability ratios such as net profit margin, ROCE, ROE and earnings per share.
All of these ratios has increased compared to previous year (Kamaluddin, Ishak and Mohammed,
2019). The reason of such an increase may be due to the rise in revenue generated by the
company. Company’s efficiency has improved in utilizing available capital which results in
higher return to shareholders as indicated by ROE and EPS.
Efficiency analysis: Asset and Inventory turnover ratios has been calculated to determine the
company’s efficiency in utilizing its assets towards generating sales which is showing increase as
compared to previous year. But there is a decline in the rate at which the stock of the company
turned into sales of the company.
Company’s poor efficiency can be seen from its stock holding days which has increased in the
current year indicating higher term for which inventory has been hold by company and its funds
remain tied up in it for long duration (Myšková and Hájek, 2017). However, company’s
efficiency has been improved in terms of collecting dues from debtors in current year as
indicated by lower debtor’s collection period.
Liquidity analysis: An ideal current ratio for liquidity of a company is 2:1. But here both in
previous and current year this ratio is below 1 indicating poor liquidity position of the company
in terms of coping up with short term obligations (Hosaka, 2019). However, as compared to 2019
liquidity has quietly improved but is still below the required ideal ratio.
Solvency analysis: Gearing ratio is much higher in previous year but has reduced in current year
indicating reduction in the financial risks for the company but the ideal ratio is 1:1 which is yet
to achieve (Rashid, 2018).
Paraphrase This Document
Need a fresh take? Get an instant paraphrase of this document with our AI Paraphraser

REFERENCES
Rashid, C. A., 2018. Efficiency of financial ratios analysis for evaluating companies’
liquidity. International Journal of Social Sciences & Educational Studies, 4(4), p.110.
Hosaka, T., 2019. Bankruptcy prediction using imaged financial ratios and convolutional neural
networks. Expert systems with applications, 117, pp.287-299.
Myšková, R. and Hájek, P., 2017. Comprehensive assessment of firm financial performance
using financial ratios and linguistic analysis of annual reports. Journal of International Studies,
volume 10, issue: 4.
Kamaluddin, A., Ishak, N. and Mohammed, N. F., 2019. Financial distress prediction through
cash flow ratios analysis. International Journal of Financial Research, 10(3), pp.63-76.
1 out of 8
Related Documents

Your All-in-One AI-Powered Toolkit for Academic Success.
+13062052269
info@desklib.com
Available 24*7 on WhatsApp / Email
Unlock your academic potential
Copyright © 2020–2025 A2Z Services. All Rights Reserved. Developed and managed by ZUCOL.