Accounting for Business: Ratio Analysis and Investment Decisions
VerifiedAdded on 2023/06/04
|10
|1738
|251
Report
AI Summary
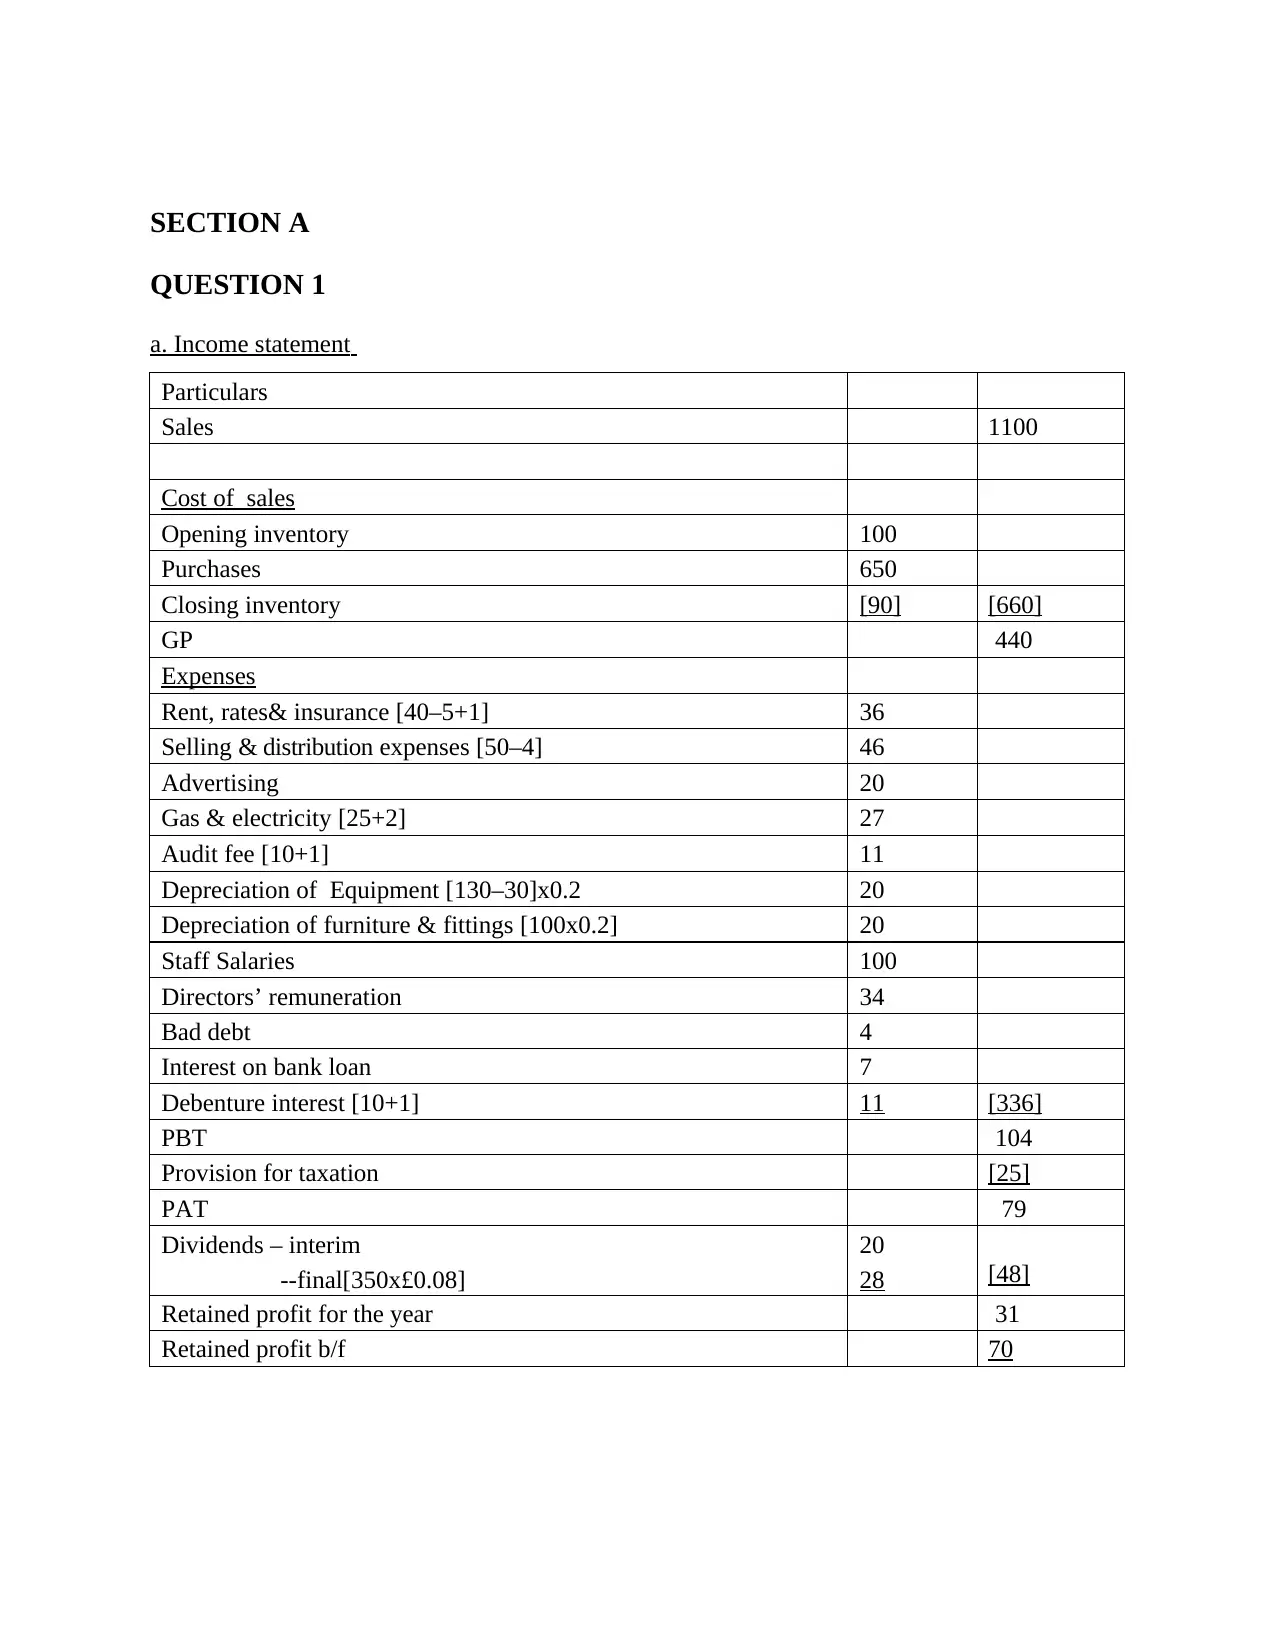
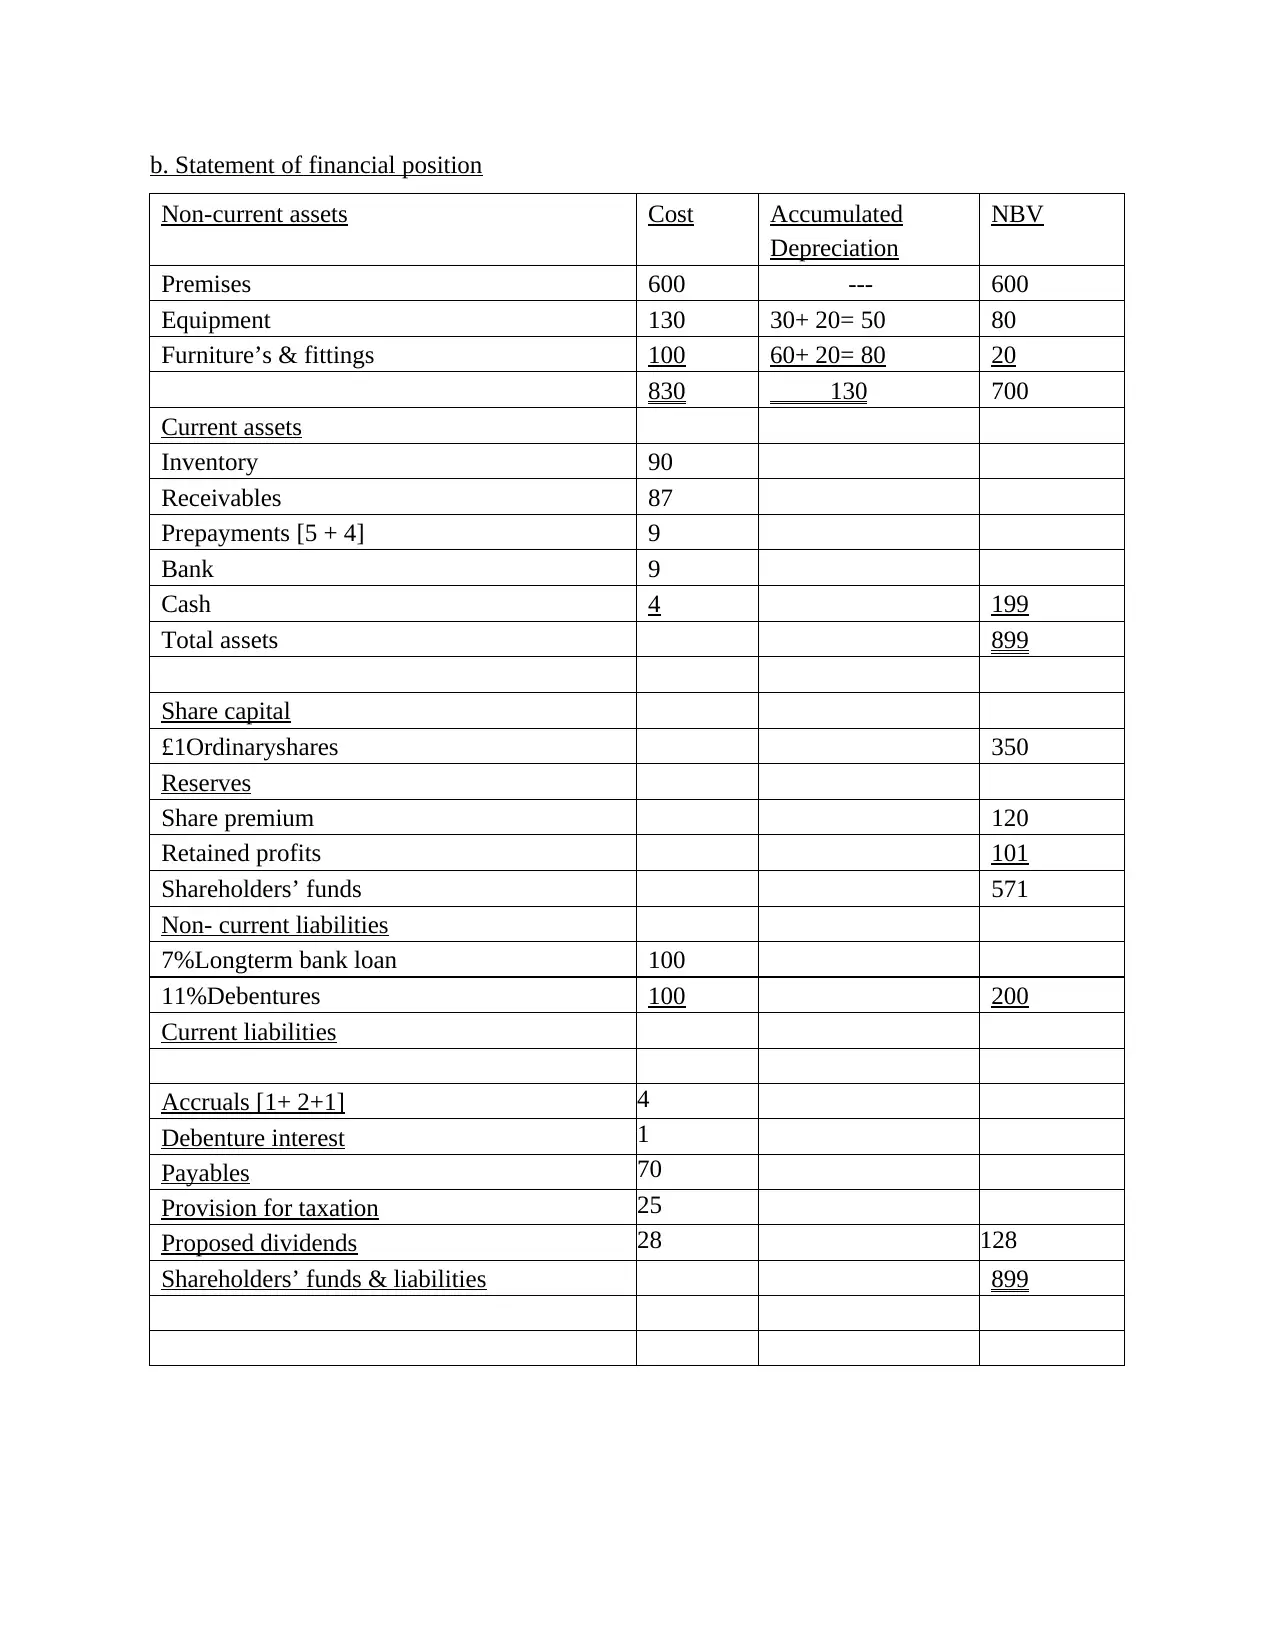
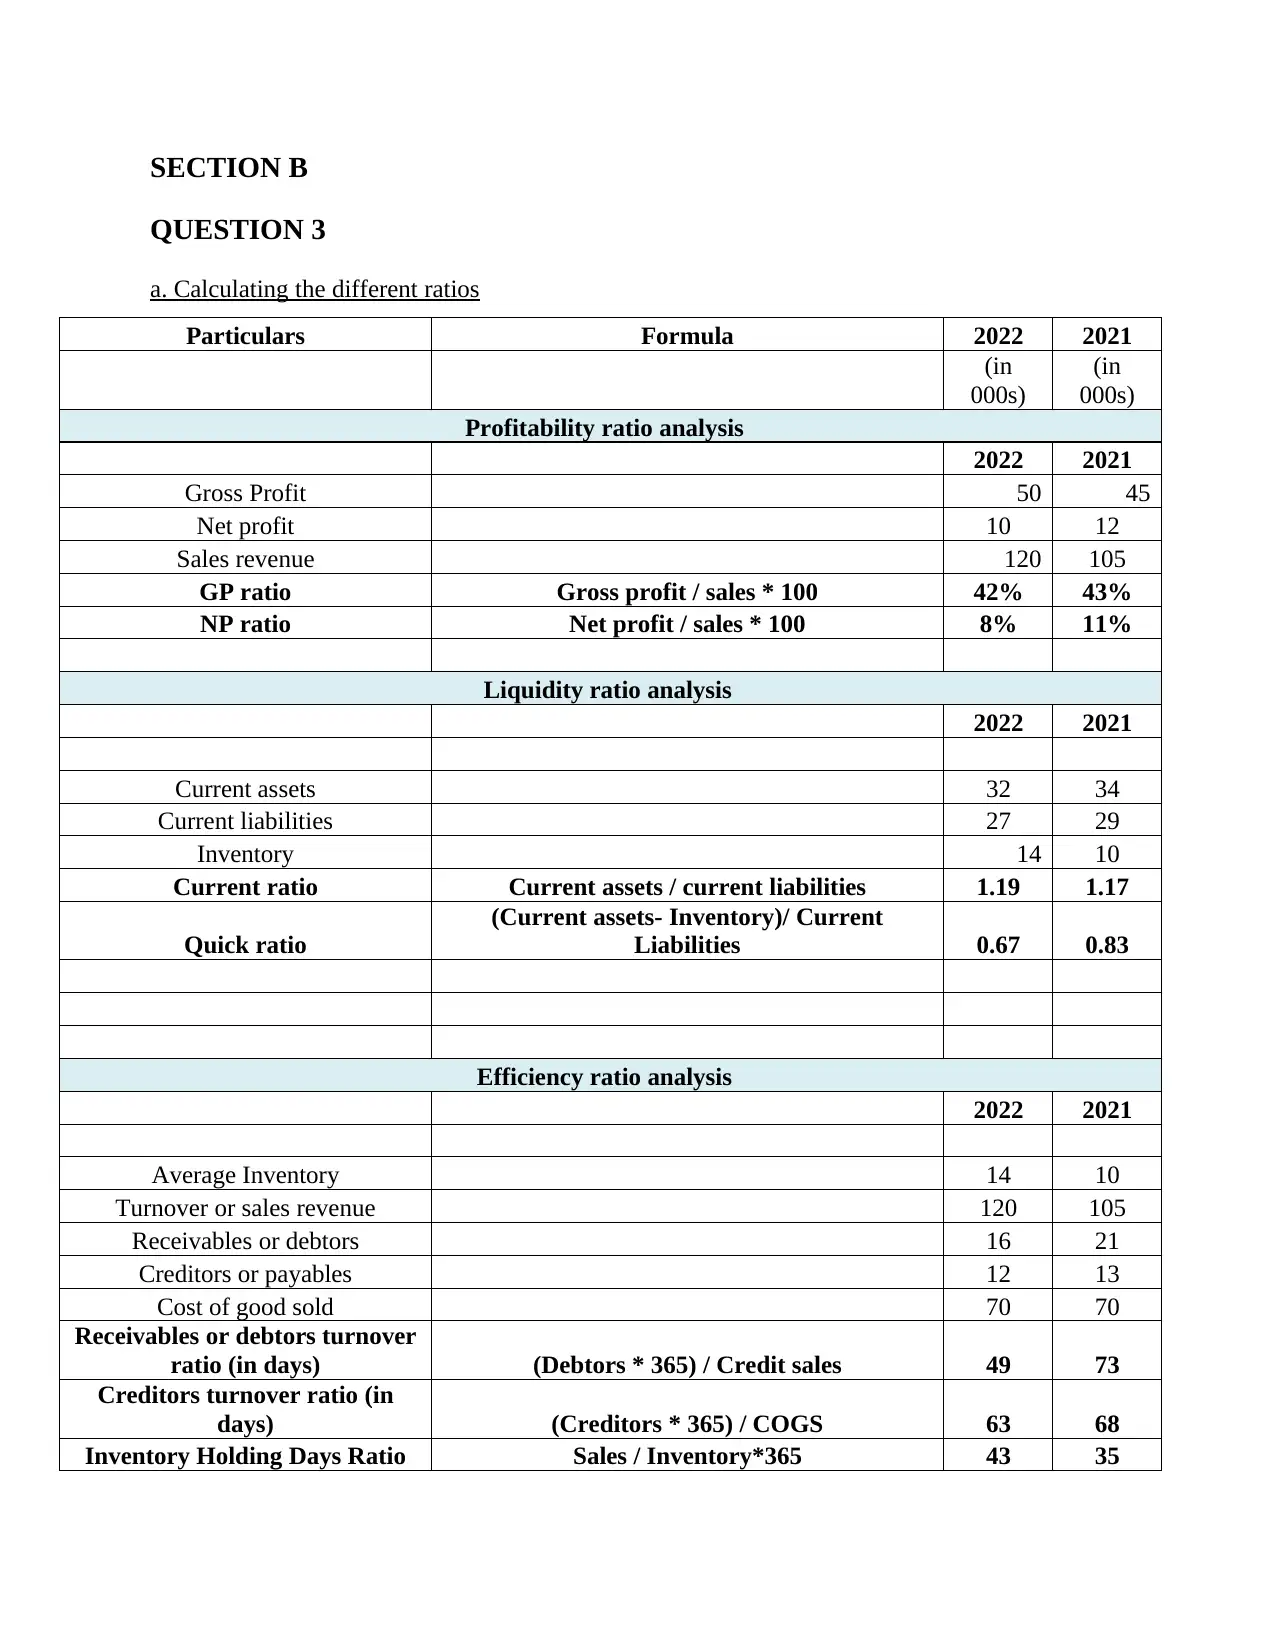
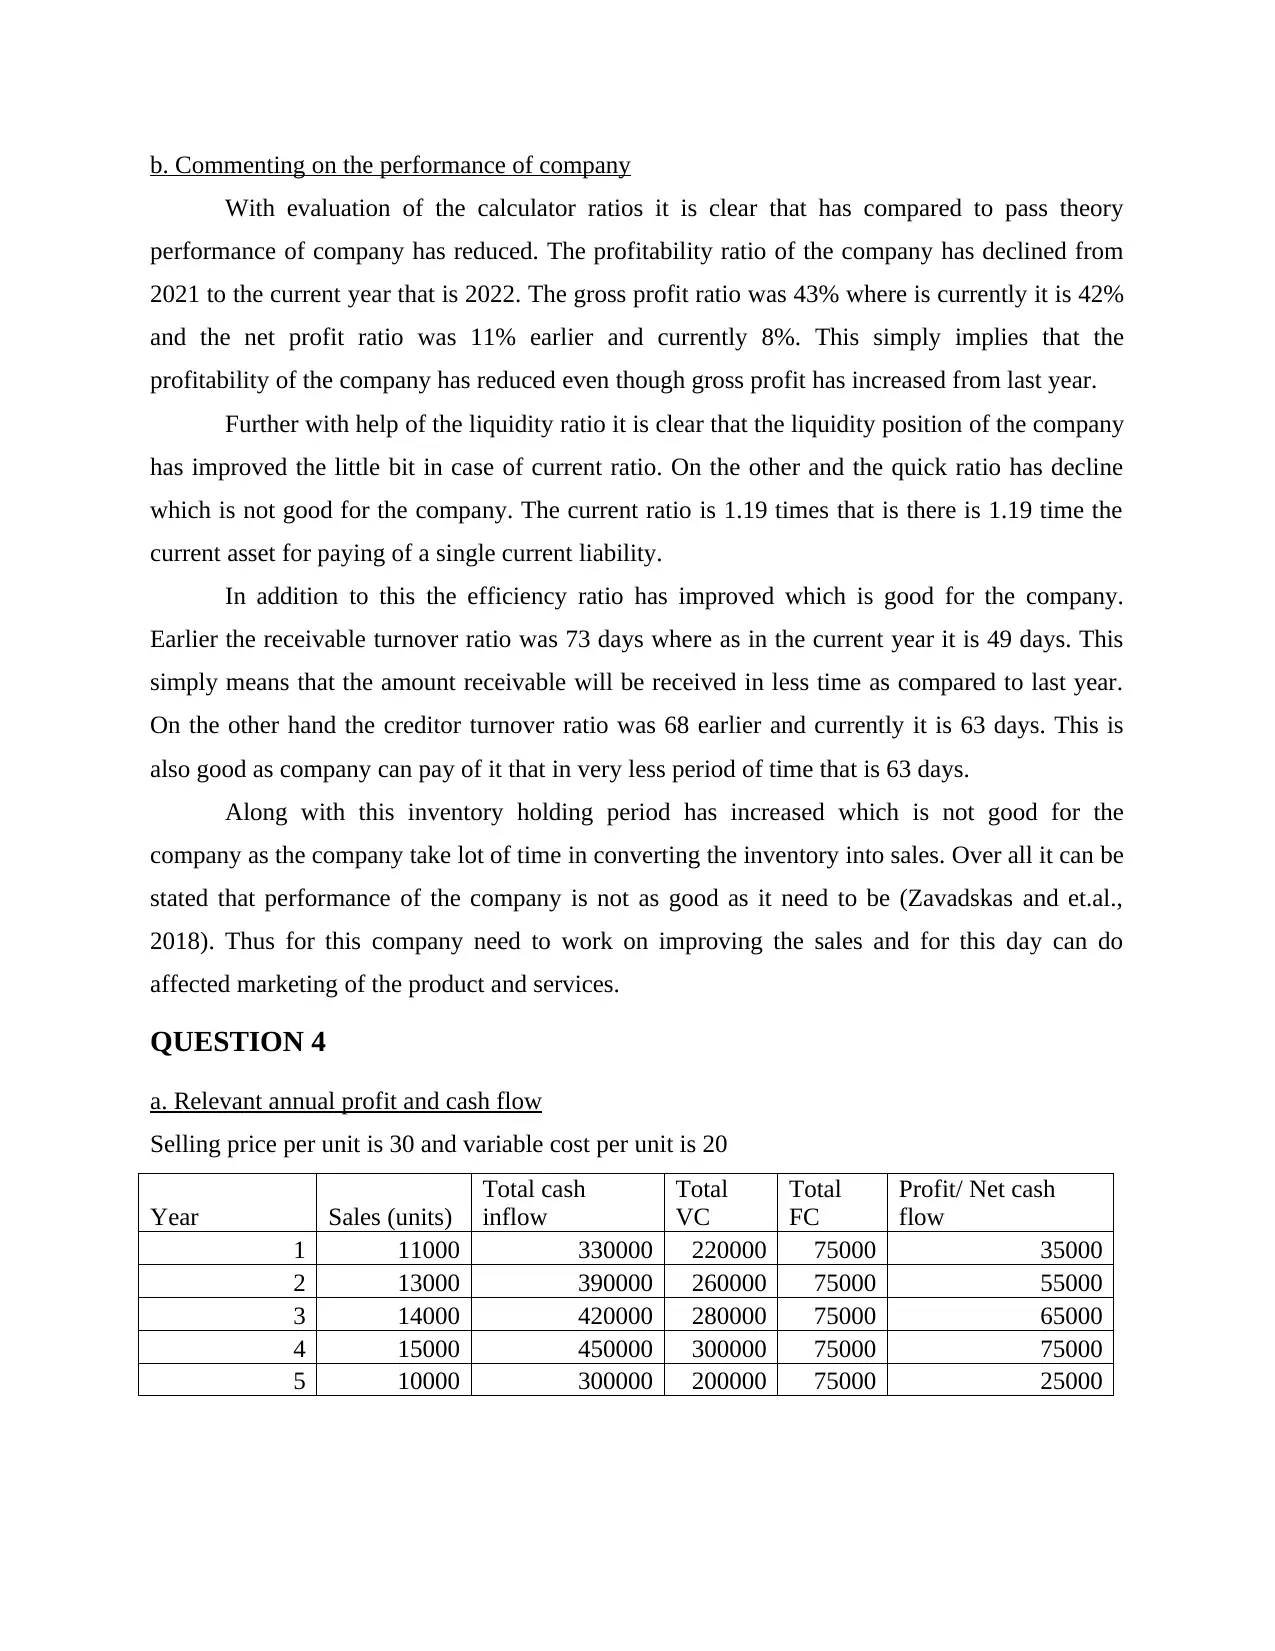
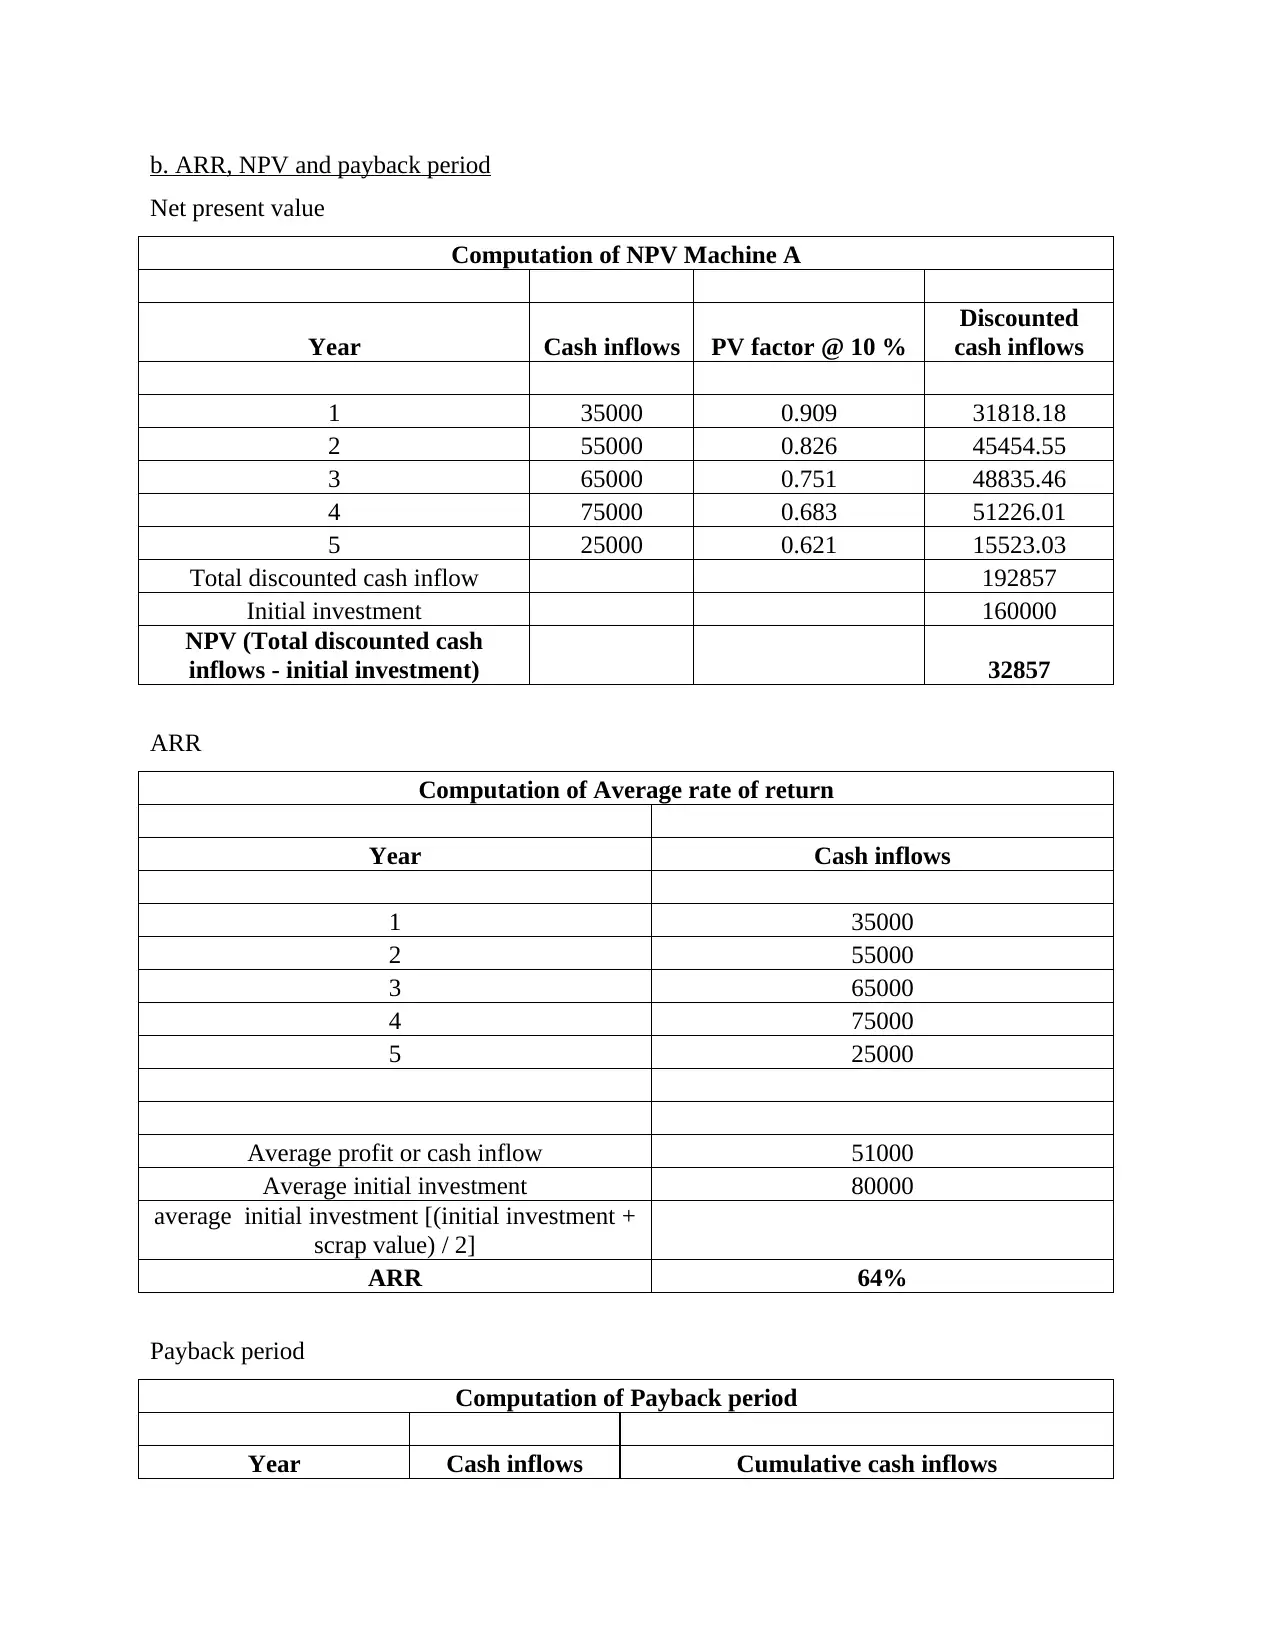
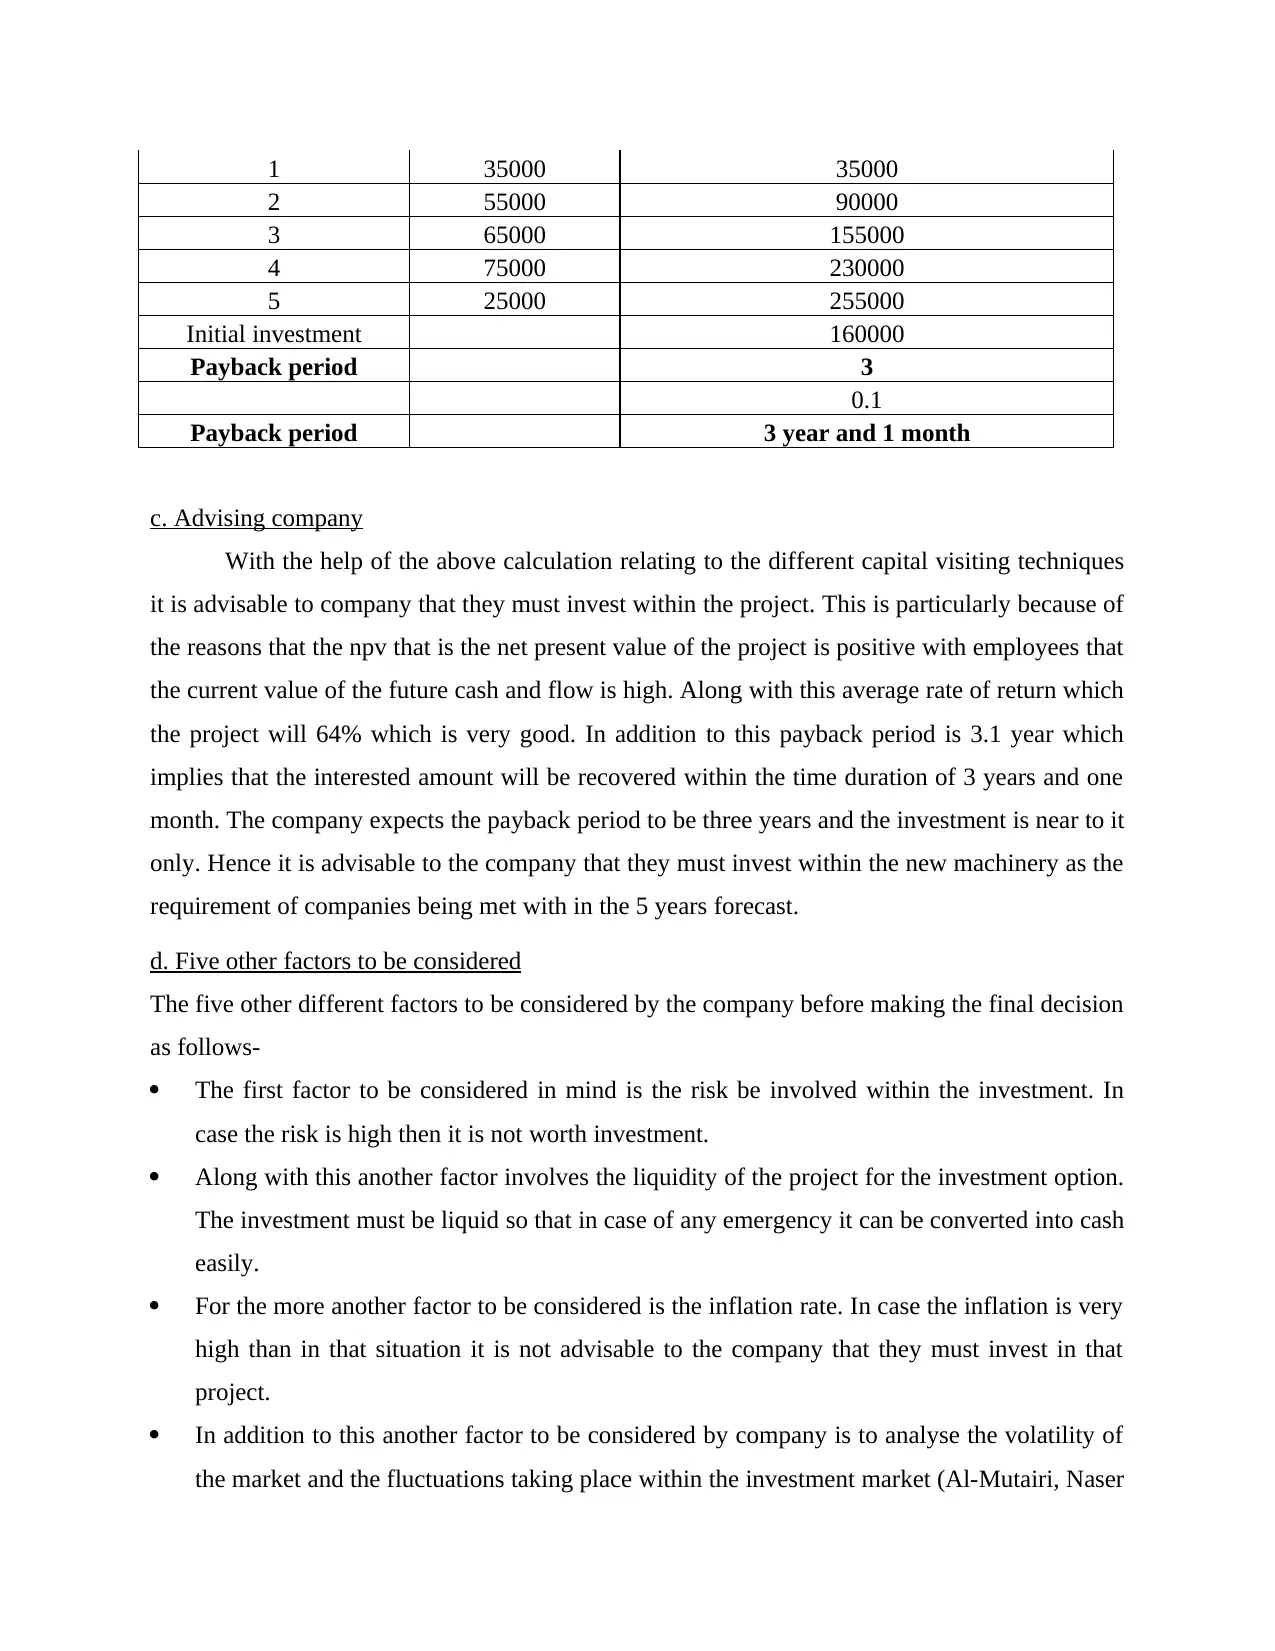
This accounting report meticulously analyzes financial statements, including the income statement and the statement of financial position, to assess a company's performance. The report delves into profitability, liquidity, and efficiency ratios, comparing the company's performance over two years. It evaluates investment decisions using techniques such as ARR, NPV, and payback period, offering recommendations on whether the company should invest in a new machine. Furthermore, it identifies crucial factors for investment decisions, such as risk, liquidity, and market volatility, and explains the advantages of the internal rate of return (IRR). The report provides a comprehensive overview of financial analysis and investment strategies, making it a valuable resource for students studying accounting and finance. This report is available on Desklib, a platform offering AI-based study tools to help students excel.
Contribute Materials
Your contribution can guide someone’s learning journey. Share your
documents today.

Accounting for Business
Secure Best Marks with AI Grader
Need help grading? Try our AI Grader for instant feedback on your assignments.

TABLE OF CONTENTS
SECTION A.....................................................................................................................................3
QUESTION 1...................................................................................................................................3
a. Income statement.....................................................................................................................3
b. Statement of financial position...............................................................................................4
SECTION B.....................................................................................................................................5
QUESTION 3...................................................................................................................................5
a. Calculating the different ratios................................................................................................5
b. Commenting on the performance of company........................................................................6
QUESTION 4...................................................................................................................................6
a. Relevant annual profit and cash flow......................................................................................6
b. ARR, NPV and payback period..............................................................................................7
c. Advising company...................................................................................................................8
d. Five other factors to be considered.........................................................................................8
e. IRR and its advantages............................................................................................................9
REFERENCES..............................................................................................................................10

SECTION A
QUESTION 1
a. Income statement
Particulars
Sales 1100
Cost of sales
Opening inventory 100
Purchases 650
Closing inventory [90] [660]
GP 440
Expenses
Rent, rates& insurance [40–5+1] 36
Selling & distribution expenses [50–4] 46
Advertising 20
Gas & electricity [25+2] 27
Audit fee [10+1] 11
Depreciation of Equipment [130–30]x0.2 20
Depreciation of furniture & fittings [100x0.2] 20
Staff Salaries 100
Directors’ remuneration 34
Bad debt 4
Interest on bank loan 7
Debenture interest [10+1] 11 [336]
PBT 104
Provision for taxation [25]
PAT 79
Dividends – interim
--final[350x£0.08]
20
28 [48]
Retained profit for the year 31
Retained profit b/f 70

b. Statement of financial position
Non-current assets Cost Accumulated
Depreciation
NBV
Premises 600 --- 600
Equipment 130 30+ 20= 50 80
Furniture’s & fittings 100 60+ 20= 80 20
830 130 700
Current assets
Inventory 90
Receivables 87
Prepayments [5 + 4] 9
Bank 9
Cash 4 199
Total assets 899
Share capital
£1Ordinaryshares 350
Reserves
Share premium 120
Retained profits 101
Shareholders’ funds 571
Non- current liabilities
7%Longterm bank loan 100
11%Debentures 100 200
Current liabilities
Accruals [1+ 2+1] 4
Debenture interest 1
Payables 70
Provision for taxation 25
Proposed dividends 28 128
Shareholders’ funds & liabilities 899
Secure Best Marks with AI Grader
Need help grading? Try our AI Grader for instant feedback on your assignments.

SECTION B
QUESTION 3
a. Calculating the different ratios
Particulars Formula 2022 2021
(in
000s)
(in
000s)
Profitability ratio analysis
2022 2021
Gross Profit 50 45
Net profit 10 12
Sales revenue 120 105
GP ratio Gross profit / sales * 100 42% 43%
NP ratio Net profit / sales * 100 8% 11%
Liquidity ratio analysis
2022 2021
Current assets 32 34
Current liabilities 27 29
Inventory 14 10
Current ratio Current assets / current liabilities 1.19 1.17
Quick ratio
(Current assets- Inventory)/ Current
Liabilities 0.67 0.83
Efficiency ratio analysis
2022 2021
Average Inventory 14 10
Turnover or sales revenue 120 105
Receivables or debtors 16 21
Creditors or payables 12 13
Cost of good sold 70 70
Receivables or debtors turnover
ratio (in days) (Debtors * 365) / Credit sales 49 73
Creditors turnover ratio (in
days) (Creditors * 365) / COGS 63 68
Inventory Holding Days Ratio Sales / Inventory*365 43 35

b. Commenting on the performance of company
With evaluation of the calculator ratios it is clear that has compared to pass theory
performance of company has reduced. The profitability ratio of the company has declined from
2021 to the current year that is 2022. The gross profit ratio was 43% where is currently it is 42%
and the net profit ratio was 11% earlier and currently 8%. This simply implies that the
profitability of the company has reduced even though gross profit has increased from last year.
Further with help of the liquidity ratio it is clear that the liquidity position of the company
has improved the little bit in case of current ratio. On the other and the quick ratio has decline
which is not good for the company. The current ratio is 1.19 times that is there is 1.19 time the
current asset for paying of a single current liability.
In addition to this the efficiency ratio has improved which is good for the company.
Earlier the receivable turnover ratio was 73 days where as in the current year it is 49 days. This
simply means that the amount receivable will be received in less time as compared to last year.
On the other hand the creditor turnover ratio was 68 earlier and currently it is 63 days. This is
also good as company can pay of it that in very less period of time that is 63 days.
Along with this inventory holding period has increased which is not good for the
company as the company take lot of time in converting the inventory into sales. Over all it can be
stated that performance of the company is not as good as it need to be (Zavadskas and et.al.,
2018). Thus for this company need to work on improving the sales and for this day can do
affected marketing of the product and services.
QUESTION 4
a. Relevant annual profit and cash flow
Selling price per unit is 30 and variable cost per unit is 20
Year Sales (units)
Total cash
inflow
Total
VC
Total
FC
Profit/ Net cash
flow
1 11000 330000 220000 75000 35000
2 13000 390000 260000 75000 55000
3 14000 420000 280000 75000 65000
4 15000 450000 300000 75000 75000
5 10000 300000 200000 75000 25000

b. ARR, NPV and payback period
Net present value
Computation of NPV Machine A
Year Cash inflows PV factor @ 10 %
Discounted
cash inflows
1 35000 0.909 31818.18
2 55000 0.826 45454.55
3 65000 0.751 48835.46
4 75000 0.683 51226.01
5 25000 0.621 15523.03
Total discounted cash inflow 192857
Initial investment 160000
NPV (Total discounted cash
inflows - initial investment) 32857
ARR
Computation of Average rate of return
Year Cash inflows
1 35000
2 55000
3 65000
4 75000
5 25000
Average profit or cash inflow 51000
Average initial investment 80000
average initial investment [(initial investment +
scrap value) / 2]
ARR 64%
Payback period
Computation of Payback period
Year Cash inflows Cumulative cash inflows
Paraphrase This Document
Need a fresh take? Get an instant paraphrase of this document with our AI Paraphraser

1 35000 35000
2 55000 90000
3 65000 155000
4 75000 230000
5 25000 255000
Initial investment 160000
Payback period 3
0.1
Payback period 3 year and 1 month
c. Advising company
With the help of the above calculation relating to the different capital visiting techniques
it is advisable to company that they must invest within the project. This is particularly because of
the reasons that the npv that is the net present value of the project is positive with employees that
the current value of the future cash and flow is high. Along with this average rate of return which
the project will 64% which is very good. In addition to this payback period is 3.1 year which
implies that the interested amount will be recovered within the time duration of 3 years and one
month. The company expects the payback period to be three years and the investment is near to it
only. Hence it is advisable to the company that they must invest within the new machinery as the
requirement of companies being met with in the 5 years forecast.
d. Five other factors to be considered
The five other different factors to be considered by the company before making the final decision
as follows-
The first factor to be considered in mind is the risk be involved within the investment. In
case the risk is high then it is not worth investment.
Along with this another factor involves the liquidity of the project for the investment option.
The investment must be liquid so that in case of any emergency it can be converted into cash
easily.
For the more another factor to be considered is the inflation rate. In case the inflation is very
high than in that situation it is not advisable to the company that they must invest in that
project.
In addition to this another factor to be considered by company is to analyse the volatility of
the market and the fluctuations taking place within the investment market (Al-Mutairi, Naser

and Saeid, 2018). This study is very essential in order to ensure that the interested amount
will be yielding a good amount of profit.
Along with this another factor to be considered while deciding the investment is the budget
that is the budget to be used while investment. In case the budget set is high then the
investment option need to be good.
e. IRR and its advantages
The IRR that is the internal rate of return is a capital budgeting tool which assist the
company in analysing the net present value of the project will stop this helps the company
analysing the backpack how much return the company will be earning with the investment being
done (Hazen and Magni, 2021). In case the IRR is higher than it is good for the company and the
investment is worth. The benefit of using IRR is follows-
The first benefit of using this technique is that it under takes the time value of money which
provide the exact profitability of the project which is good.
In addition to this another benefit is that it is easy and simple to use and understand it.

REFERENCES
Books and Journals
Al-Mutairi, A., Naser, K. and Saeid, M., 2018. Capital budgeting practices by non-financial
companies listed on Kuwait Stock Exchange (KSE). Cogent Economics &
Finance. 6(1). p.1468232.
Hazen, G. and Magni, C. A., 2021. Average internal rate of return for risky projects. The
Engineering Economist. 66(2). pp.90-120.
Zavadskas, E. K. and et.al., 2018. A novel multicriteria approach–rough step-wise weight
assessment ratio analysis method (R-SWARA) and its application in logistics. Studies in
Informatics and Control. 27(1). pp.97-106.
1 out of 10
Related Documents

Your All-in-One AI-Powered Toolkit for Academic Success.
+13062052269
info@desklib.com
Available 24*7 on WhatsApp / Email
Unlock your academic potential
© 2024 | Zucol Services PVT LTD | All rights reserved.