Financial Accounting and Management Report for Collins Colman
VerifiedAdded on 2023/01/07
|17
|3935
|59
Report
AI Summary
This report provides a comprehensive financial analysis of Collins Colman Ltd, covering various aspects of financial and management accounting. It begins with the preparation of financial statements, including the income statement and statement of financial position for the year ended December 31, 2019. The report then delves into management accounting concepts such as break-even analysis and margin of safety, calculating these metrics for the company's microwave sales. It assesses the profitability of different sales scenarios and evaluates the impact of a new sales strategy. Furthermore, the report explores investment appraisal techniques, including payback period, accounting rate of return, and net present value, to determine the viability of purchasing a new machine. It provides recommendations based on these calculations and discusses the merits and demerits of different investment appraisal methods and the use of budgets for strategic planning. The analysis highlights the company's financial position, liquidity, and profitability, offering insights for improved financial management and strategic decision-making.

INTRODUCTION TO
ACCOUNTING AND FINANCE
ACCOUNTING AND FINANCE
Paraphrase This Document
Need a fresh take? Get an instant paraphrase of this document with our AI Paraphraser

TABLE OF CONTENTS
TABLE OF CONTENTS................................................................................................................2
INTRODUTION..............................................................................................................................1
PART A...........................................................................................................................................1
a. Statement of Income for the year ended 31st December 2019................................................1
b. Statement of Financial Position for the year ended 31st December 2019................................3
PART B...........................................................................................................................................5
a. Contribution of the microwave towards covering the fixed costs...........................................5
b. Breakeven point and the margin of safety in the terms of both the units of the microwaves
and the revenues on selling the microwaves for 40.....................................................................5
c. Profits made by Parksmead Limited if produced and selling 60000 of the microwaves.........6
d. Analysing the new strategy of Parksmead limited increasing the sales units by 15% and
sales price by 8% for making advertisement expenses of 135000..............................................7
e. Explanation underpinning the assumptions attached with break even models including its
implementation for the business..................................................................................................8
PART C...........................................................................................................................................9
a. Calculating Payback period, Accounting rate of return and Net Present Value of machine
and recommendations for purchase of machine..........................................................................9
b. Report analysing and explaining merits and demerits of different investment appraisal
techniques..................................................................................................................................11
c. Report identifying and explaining key benefits and limitations of using budget as the tool
for strategic planning.................................................................................................................12
REFERENCES..............................................................................................................................14
INTRODUTION
Financial accounting refers to process of preparing the financial statements which
companies uses for showing or presenting the financial position and performance of the firm to
outside parties or users of the financial statements. Financial accounting keeps track record of the
financial transactions. It involves recording, summarising and presenting in financial reports
which includes income statement, balance sheet and the cash flow statement. Financial
statements are produced on set scheduled basis(Loughran and McDonald, 2016). Financial
accounting helps the management to take informed decisions regarding the performance of
business and to take necessary measures for improving the performance of company. The report
is based over making concepts and techniques of financial accounting which involves the
business to take important decisions after analysing the current performance. Report also
includes concepts of management accounting such as break even, margin of safety and
investment appraisal techniques that helps the business to management in analysing proposed
strategies and investments.
PART A
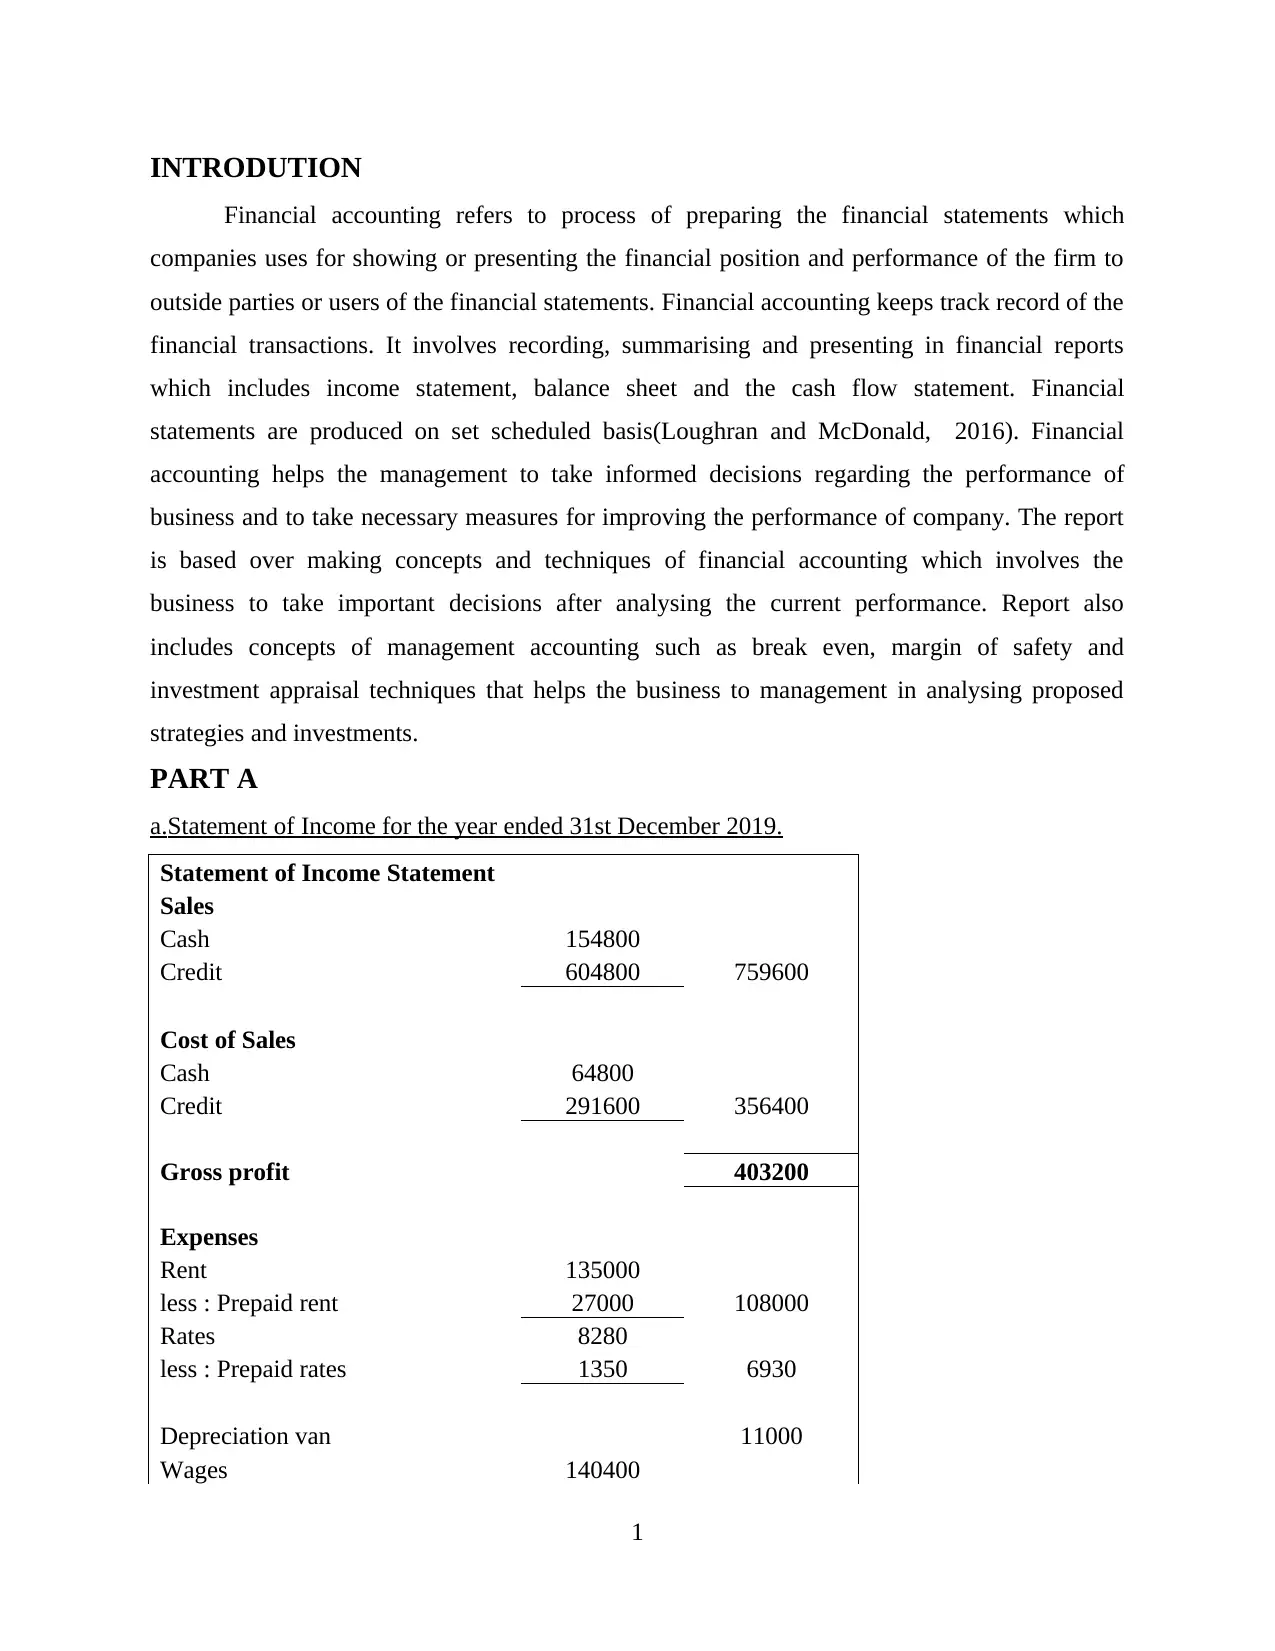
a.Statement of Income for the year ended 31st December 2019.
Statement of Income Statement
Sales
Cash 154800
Credit 604800 759600
Cost of Sales
Cash 64800
Credit 291600 356400
Gross profit 403200
Expenses
Rent 135000
less : Prepaid rent 27000 108000
Rates 8280
less : Prepaid rates 1350 6930
Depreciation van 11000
Wages 140400
1
Financial accounting refers to process of preparing the financial statements which
companies uses for showing or presenting the financial position and performance of the firm to
outside parties or users of the financial statements. Financial accounting keeps track record of the
financial transactions. It involves recording, summarising and presenting in financial reports
which includes income statement, balance sheet and the cash flow statement. Financial
statements are produced on set scheduled basis(Loughran and McDonald, 2016). Financial
accounting helps the management to take informed decisions regarding the performance of
business and to take necessary measures for improving the performance of company. The report
is based over making concepts and techniques of financial accounting which involves the
business to take important decisions after analysing the current performance. Report also
includes concepts of management accounting such as break even, margin of safety and
investment appraisal techniques that helps the business to management in analysing proposed
strategies and investments.
PART A
a.Statement of Income for the year ended 31st December 2019.
Statement of Income Statement
Sales
Cash 154800
Credit 604800 759600
Cost of Sales
Cash 64800
Credit 291600 356400
Gross profit 403200
Expenses
Rent 135000
less : Prepaid rent 27000 108000
Rates 8280
less : Prepaid rates 1350 6930
Depreciation van 11000
Wages 140400
1
⊘ This is a preview!⊘
Do you want full access?
Subscribe today to unlock all pages.
Trusted by 1+ million students worldwide

Add ; Outstanding Wages 2610 143010
Electricity Bills 6840
Van Expenses 40320
Total Expenses 316100
Net Profit 87100
Workings
Rent
Annual Rent 108000
Rent Paid 135000
Prepaid Rent -27000
Rate
Jan - March 2019 2880
April - December 5400 * (9/12)
4050
Total rates for the year 6930
Prepaid 5400-4050
Jan - March 2020 1350
Van
Cost of van 72000
Useful Life 6
Residual value 6000
Depreciation
(72000-
6000)/6
11000
Trade Receivables
Sales 604800
Cash Collections 525600
Bad Debts 1800
Tr Receivables at year
end 77400
Trade Payables
2
Paraphrase This Document
Need a fresh take? Get an instant paraphrase of this document with our AI Paraphraser
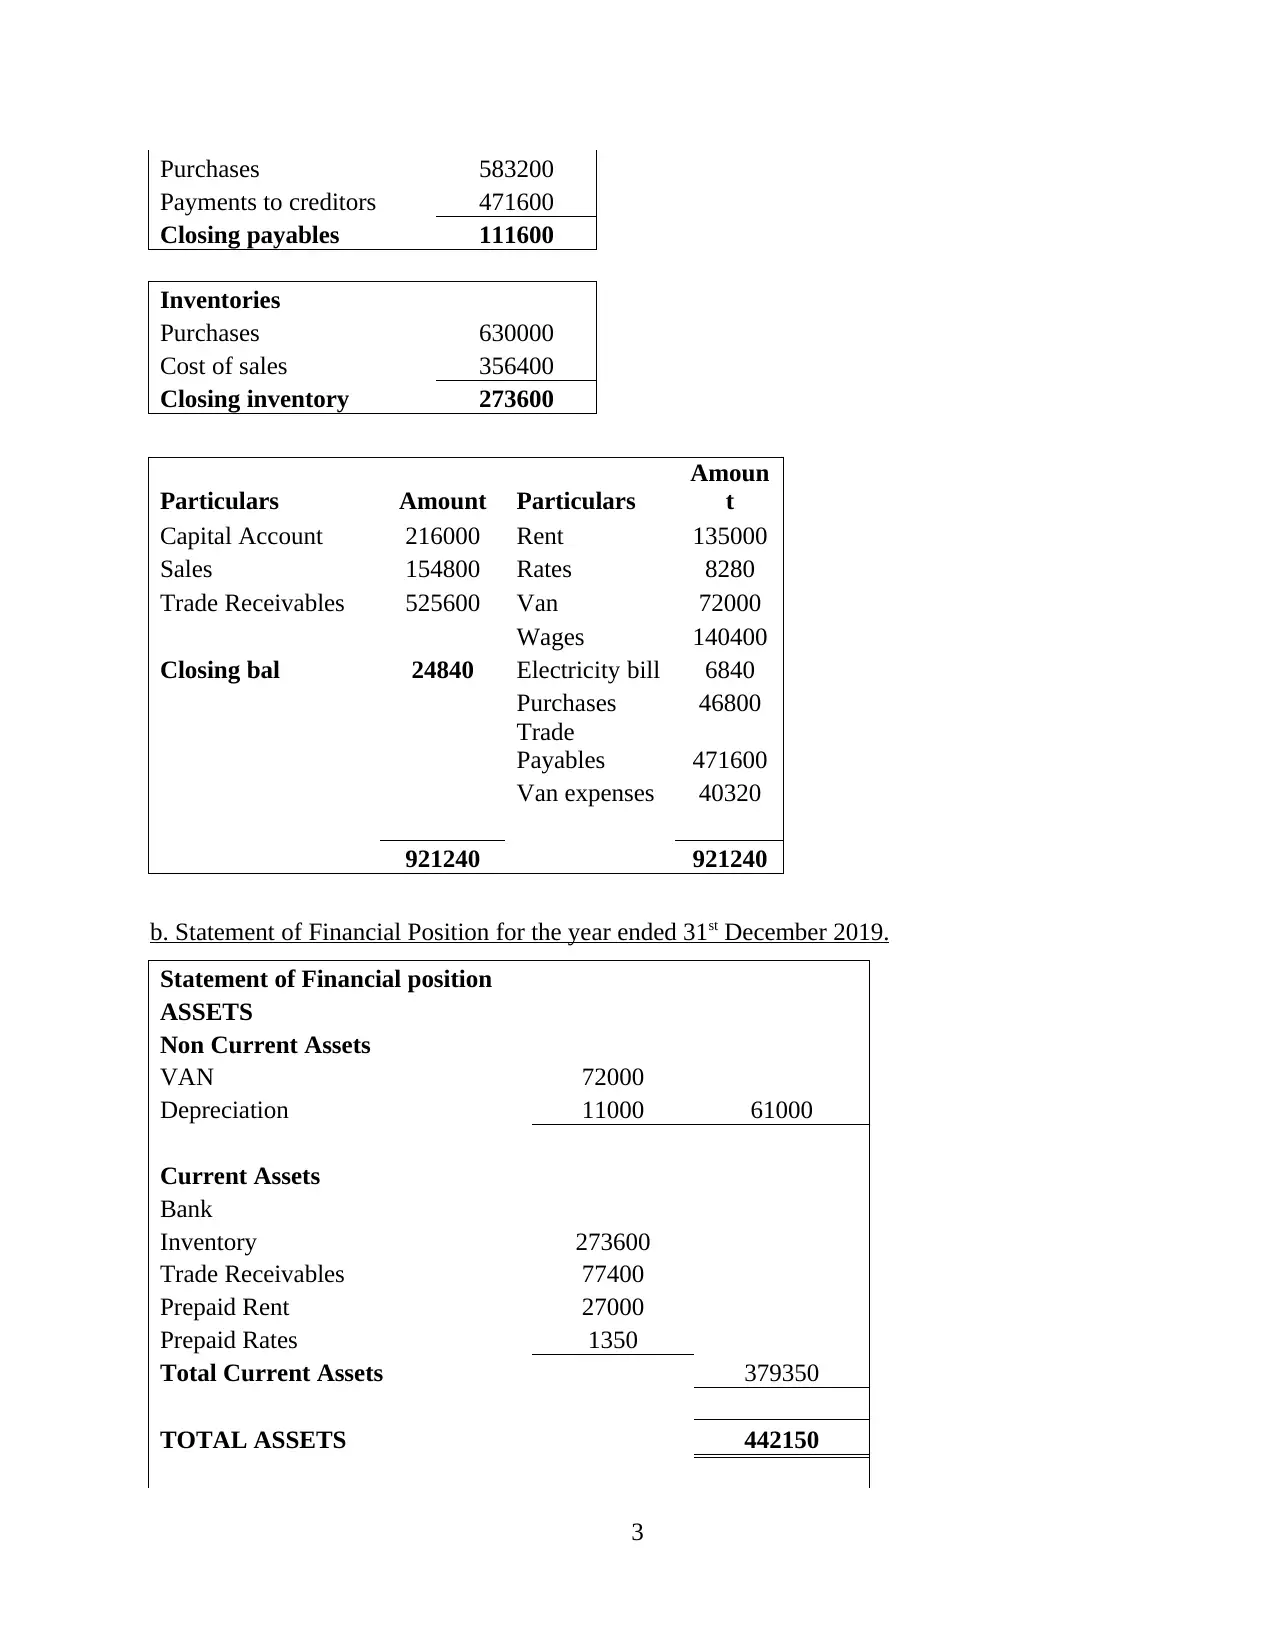
Purchases 583200
Payments to creditors 471600
Closing payables 111600
Inventories
Purchases 630000
Cost of sales 356400
Closing inventory 273600
Particulars Amount Particulars
Amoun
t
Capital Account 216000 Rent 135000
Sales 154800 Rates 8280
Trade Receivables 525600 Van 72000
Wages 140400
Closing bal 24840 Electricity bill 6840
Purchases 46800
Trade
Payables 471600
Van expenses 40320
921240 921240
b. Statement of Financial Position for the year ended 31st December 2019.
Statement of Financial position
ASSETS
Non Current Assets
VAN 72000
Depreciation 11000 61000
Current Assets
Bank
Inventory 273600
Trade Receivables 77400
Prepaid Rent 27000
Prepaid Rates 1350
Total Current Assets 379350
TOTAL ASSETS 442150
3

EQUITY AND LIABILITIES
Equity 216000
Retained Earnings 87100
Total Equity 303100
LIABILITIES
Non Current Liabilities
Borrowings 0 0
Current Liabilities
Bank Overdraft 24840
Trade Payables 111600
Outstanding wages 2610 139050
TOTAL EQUITY &
LIABILITIES 442150
Analysis
Collins Colman limited has started new business which began trading from 1st January
2019. Financial position of the company does not seem to be strong. It could be analysed that
liquidity position of the company is very weak. It is having negative cash balance in the first
year. The income statement shows profits where the cash position of company is negative which
shows that it is very essential to analyse both income and position statement of company. The
situation can cause significant implications over the stakeholders and people planning to invest
in the company. Colman limited is required to take considerable steps for improving the
performance of business so that it could manage the operations of business by bringing the
liquidity position to positive (Atrill and McLaney, 2006). It has to increase the current assets and
control over expenses. It could also loans for meeting the working capital requirements of the
business. This will enable the company to run its operations properly.
PART B
a. Contribution of the microwave towards covering the fixed costs
Selling Price 40
Variable Costs
Materials 15.75
Labour 8.85
4
⊘ This is a preview!⊘
Do you want full access?
Subscribe today to unlock all pages.
Trusted by 1+ million students worldwide
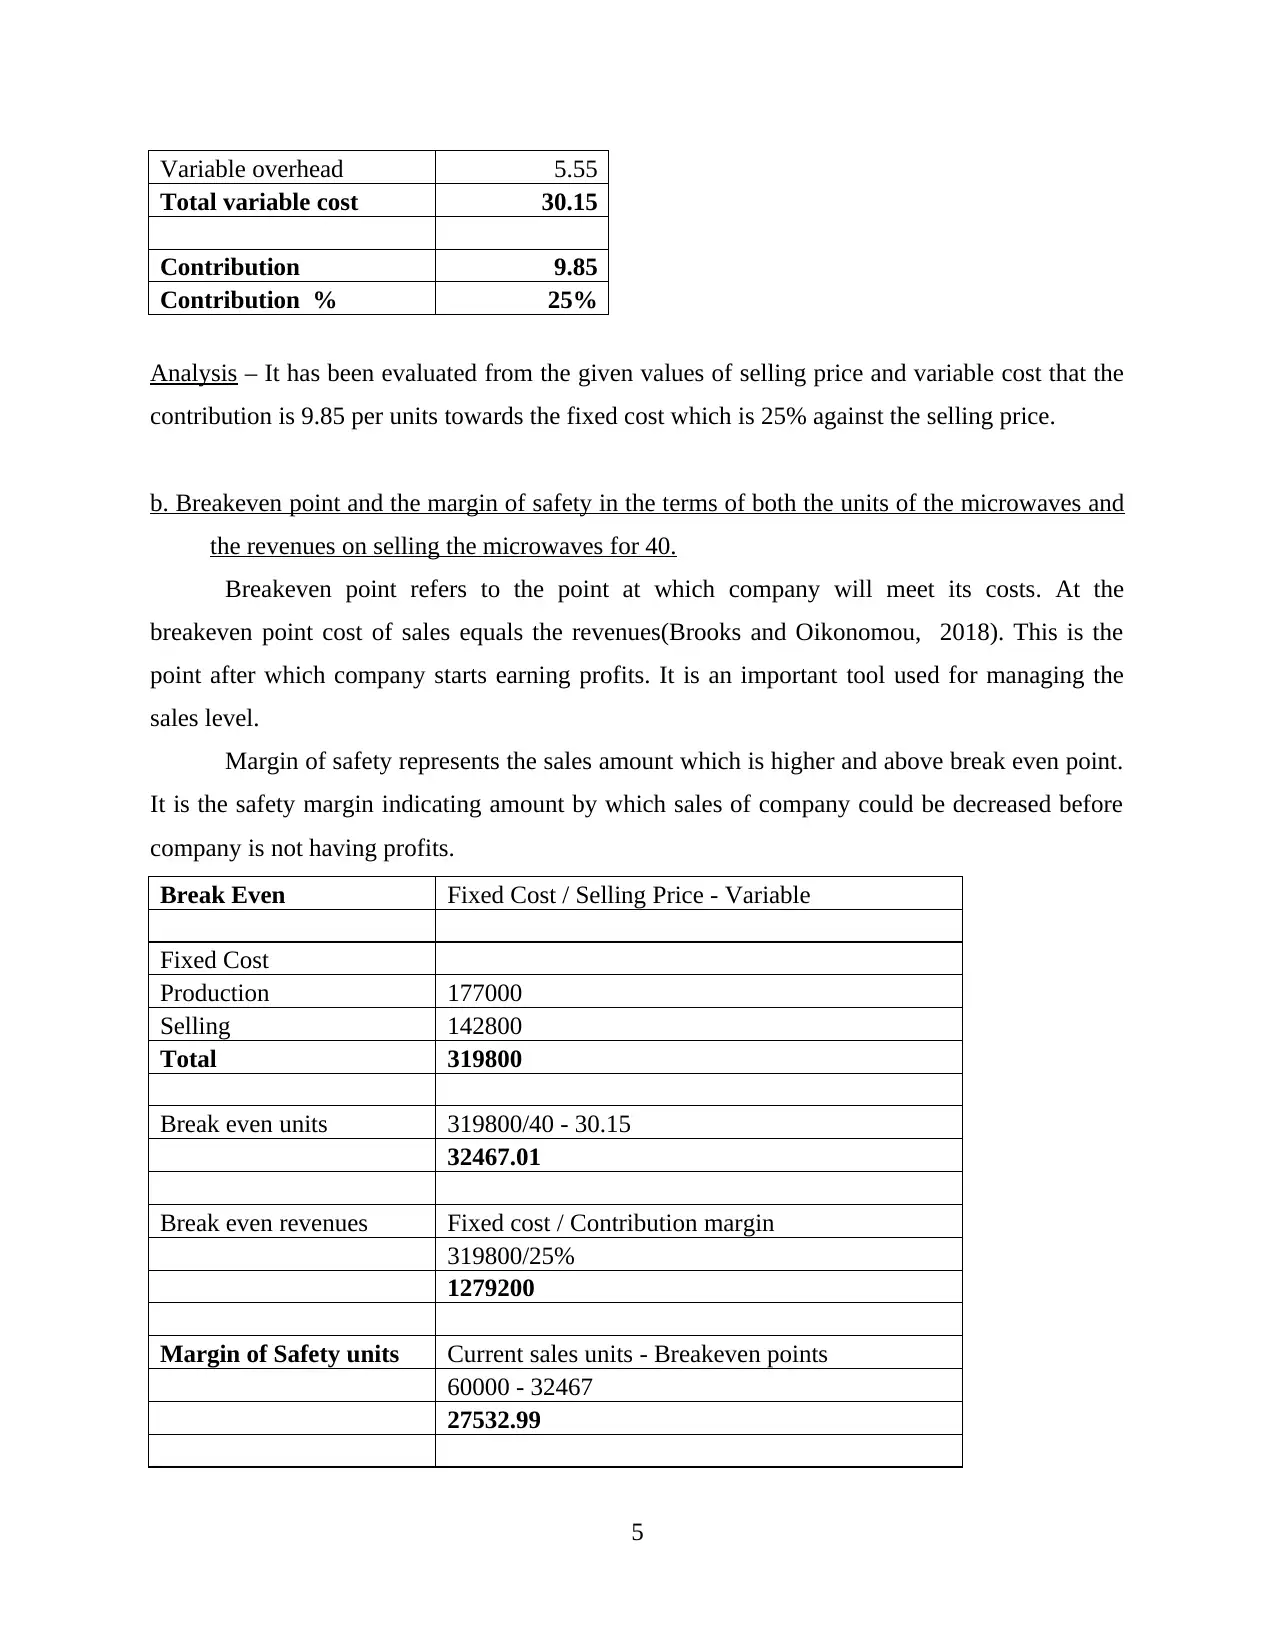
Variable overhead 5.55
Total variable cost 30.15
Contribution 9.85
Contribution % 25%
Analysis – It has been evaluated from the given values of selling price and variable cost that the
contribution is 9.85 per units towards the fixed cost which is 25% against the selling price.
b. Breakeven point and the margin of safety in the terms of both the units of the microwaves and
the revenues on selling the microwaves for 40.
Breakeven point refers to the point at which company will meet its costs. At the
breakeven point cost of sales equals the revenues(Brooks and Oikonomou, 2018). This is the
point after which company starts earning profits. It is an important tool used for managing the
sales level.
Margin of safety represents the sales amount which is higher and above break even point.
It is the safety margin indicating amount by which sales of company could be decreased before
company is not having profits.
Break Even Fixed Cost / Selling Price - Variable
Fixed Cost
Production 177000
Selling 142800
Total 319800
Break even units 319800/40 - 30.15
32467.01
Break even revenues Fixed cost / Contribution margin
319800/25%
1279200
Margin of Safety units Current sales units - Breakeven points
60000 - 32467
27532.99
5
Paraphrase This Document
Need a fresh take? Get an instant paraphrase of this document with our AI Paraphraser

Margin of safety in units Current sales - Break even sales
Current sales 2400000
Break even sales 1279200
Margin of safety 1120800
Analysis – It could be analysed that the company is presently having selling price of 40 and
variable costs of 30.15. The fixed cost of company from production and selling totalled to
319800. The break even units of company are 32467 microwaves and in revenues is 1,279,200.
On the other margin of safety is in units is 27532 microwaves and in revenues is
1,120,800. This is the amount that could be decreased if company do not have any profit.
c. Profits made by Parksmead Limited if produced and selling 60000 of the microwaves
Calculation of Profits
Units 60000
Sales 40 2400000
Variable Cost
Materials 15.75 945000
Labour 8.85 531000
Variable overhead 5.55 333000
Contribution 591000
Fixed Cost
Production 177000
Selling plc 142800
Profit 271200
Analysis –
It could be analysed that at the sales and production level of 60000 microwaves will be
earning profits of 271,200 after meeting all the variable and fixed costs. The variable cost per
unit is 30.15 and for 60000 units it has totalled to 1809000 and fixed costs are 319,800.
6
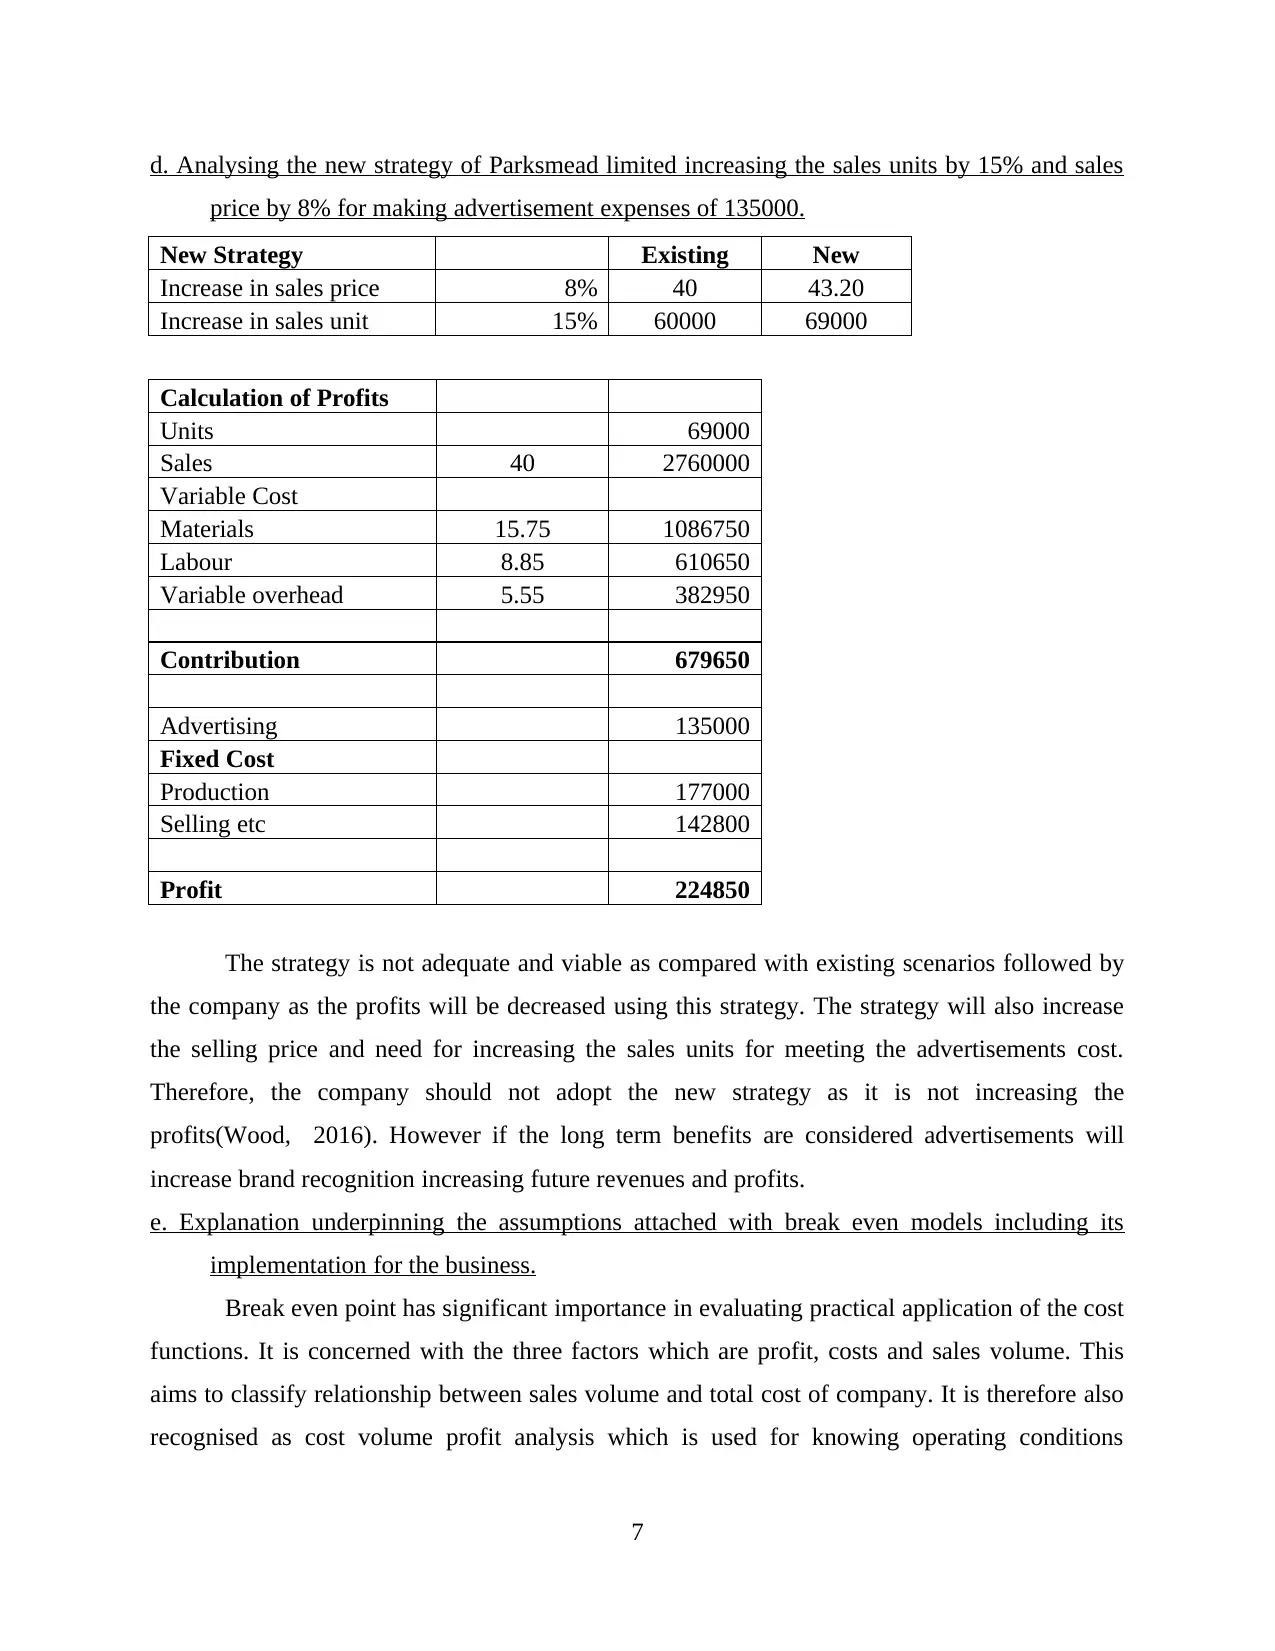
d. Analysing the new strategy of Parksmead limited increasing the sales units by 15% and sales
price by 8% for making advertisement expenses of 135000.
New Strategy Existing New
Increase in sales price 8% 40 43.20
Increase in sales unit 15% 60000 69000
Calculation of Profits
Units 69000
Sales 40 2760000
Variable Cost
Materials 15.75 1086750
Labour 8.85 610650
Variable overhead 5.55 382950
Contribution 679650
Advertising 135000
Fixed Cost
Production 177000
Selling etc 142800
Profit 224850
The strategy is not adequate and viable as compared with existing scenarios followed by
the company as the profits will be decreased using this strategy. The strategy will also increase
the selling price and need for increasing the sales units for meeting the advertisements cost.
Therefore, the company should not adopt the new strategy as it is not increasing the
profits(Wood, 2016). However if the long term benefits are considered advertisements will
increase brand recognition increasing future revenues and profits.
e. Explanation underpinning the assumptions attached with break even models including its
implementation for the business.
Break even point has significant importance in evaluating practical application of the cost
functions. It is concerned with the three factors which are profit, costs and sales volume. This
aims to classify relationship between sales volume and total cost of company. It is therefore also
recognised as cost volume profit analysis which is used for knowing operating conditions
7
⊘ This is a preview!⊘
Do you want full access?
Subscribe today to unlock all pages.
Trusted by 1+ million students worldwide

existing when company breaks even. There are number of assumptions taken in the break even
analysis which are ;
All costs are classified in variable and fixed costs and does not considers semi – variable
costs.
Behaviour of different costs is linear which means costs shown on graph will form
straight line.
Total amount of the fixed cost remains constant at every output level and the variable
costs fluctuate in proportion of the output.
Selling price will be constant at every level of output that means prices of units will not
be changing at different sales level.
Price for the inputs such as material, labour, etc remains constant for the calculations.
No change will be there for efficiency of the men & machines and the technological
methods will be constant.
Output or sales volume is the only factor affecting the cost.
The break even could be applied successfully by the range of differing businesses. It
enables the business to decide the sales which is required to be achieved for covering the cost
and for earning desirable profits. It could be used for different types of businesses to make the
strategies regarding their sales level and also for the purpose of controlling the costs(Goodacre,
Gaunt and Henry, 2017). It could be used by both manufacturing and service companies as both
industries have variable cost and fixed cost that could be used for identifying breakeven point for
covering cost and earning profit.
PART C
a. Calculating Payback period, Accounting rate of return and Net Present Value of machine and
recommendations for purchase of machine
Cost of new machine 8000000
Cash Flows
Cash Inflows 3400000
Cash Outflow -1280000
less : Depreciation -1400000
Cash Flows 720000
Add : depreciation 1400000
8
Paraphrase This Document
Need a fresh take? Get an instant paraphrase of this document with our AI Paraphraser
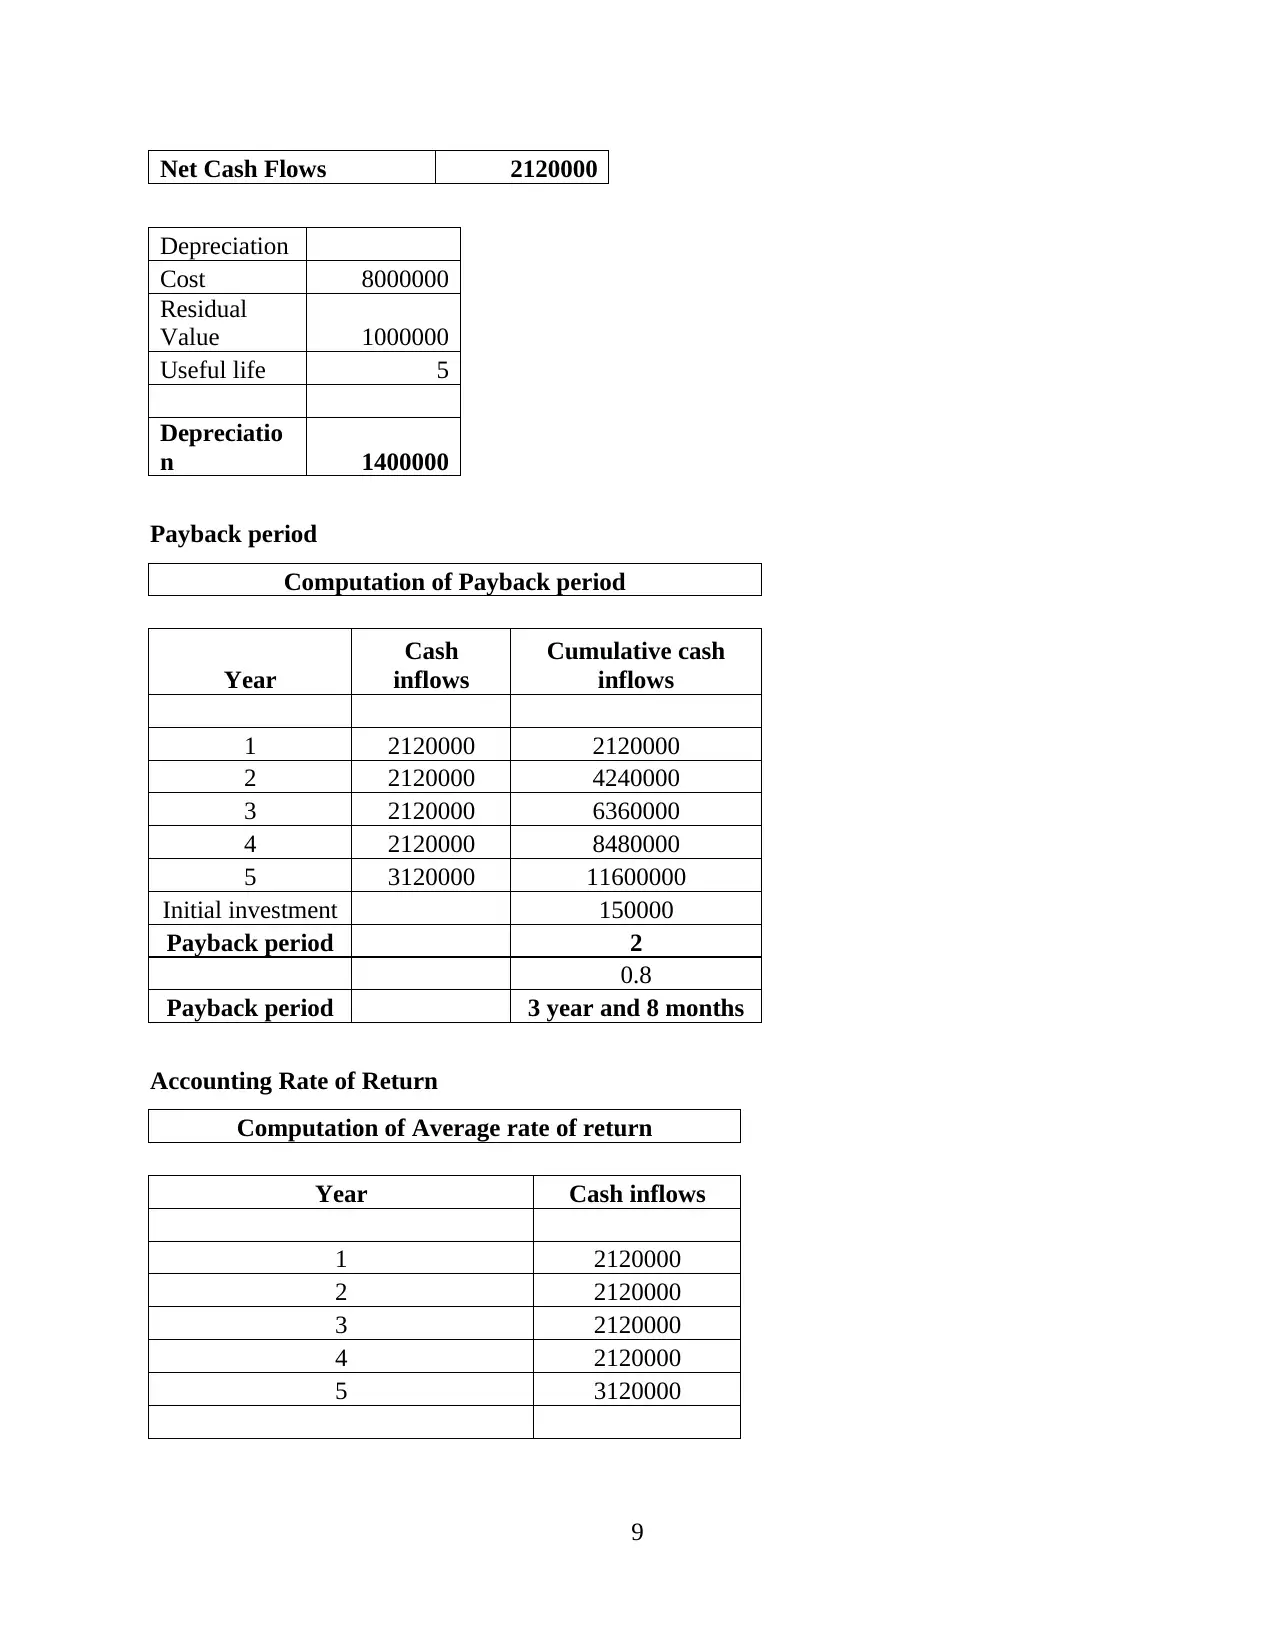
Net Cash Flows 2120000
Depreciation
Cost 8000000
Residual
Value 1000000
Useful life 5
Depreciatio
n 1400000
Payback period
Computation of Payback period
Year
Cash
inflows
Cumulative cash
inflows
1 2120000 2120000
2 2120000 4240000
3 2120000 6360000
4 2120000 8480000
5 3120000 11600000
Initial investment 150000
Payback period 2
0.8
Payback period 3 year and 8 months
Accounting Rate of Return
Computation of Average rate of return
Year Cash inflows
1 2120000
2 2120000
3 2120000
4 2120000
5 3120000
9

Average profit or cash inflow 2320000
Average initial investment 8000000
average initial investment [(initial
investment + scrap value) / 2]
ARR 29%
Net Present Value
Computation of NPV
Year
Cash
inflows
PV
factor @
9%
Discounted
cash inflows
1 2120000 0.917 1944954
2 2120000 0.842 1784362
3 2120000 0.772 1637029
4 2120000 0.708 1501861
5 3120000 0.650 2027786
Total discounted cash inflow 8895992
Initial investment 8000000
NPV (Total discounted cash
inflows - initial investment) 895992
Recommendation
It could be evaluated from the above analysis that the project of machine is viable as the
NPV of the project is positive. The ARR of the project is 29% that adequate and high. Payback
period of the machine is 3 years and 8 months which is higher. NPV and ARR suggests the
project to be viable and acceptable where the longer payback period reduces the profits that
could be generated from the project(Chang and Chow, 2019). Outcomes of investment appraisals
shows that the project is viable and the cash flows from the machine will cover the cost and also
allow company to earn profits for one year. Therefore the project should be accepted by the
company.
10
⊘ This is a preview!⊘
Do you want full access?
Subscribe today to unlock all pages.
Trusted by 1+ million students worldwide
1 out of 17
Related Documents


Your All-in-One AI-Powered Toolkit for Academic Success.
+13062052269
info@desklib.com
Available 24*7 on WhatsApp / Email
![[object Object]](/_next/static/media/star-bottom.7253800d.svg)
Unlock your academic potential
Copyright © 2020–2026 A2Z Services. All Rights Reserved. Developed and managed by ZUCOL.