Financial Analysis of Britvic Plc and Nichols Plc Comparison
VerifiedAdded on 2023/01/18
|26
|5258
|35
Report
AI Summary
This report presents a detailed financial analysis of Britvic Plc, a UK-based soft drink company, and compares its performance to its competitor, Nichols Plc. The analysis includes an executive summary, an introduction to Britvic Plc's operations and financial performance, and a comprehensive ratio analysis covering liquidity, activity, debt, and profitability ratios for both companies. The report evaluates Britvic Plc's working capital management and assesses a proposed project, considering various scenarios and funding options. It identifies project risks, critically discusses the methodologies employed, and concludes with a final recommendation. The financial data and ratios are used to evaluate the company's performance over a period of time. The report also explores the financial health of the company by evaluating ratios for both the companies and the market share of the companies.
Running head: ACCOUNTING AND MANAGERIAL FINANCE
Accounting and managerial finance
Name of the project
Name of the university
Student ID
Author note
Accounting and managerial finance
Name of the project
Name of the university
Student ID
Author note
Paraphrase This Document
Need a fresh take? Get an instant paraphrase of this document with our AI Paraphraser
1ACCOUNTING AND MANAGERIAL FINANCE
Table of Contents
1. Executive summary..................................................................................................................2
2. Rational of the project..............................................................................................................3
Question 1........................................................................................................................................3
Requirement (a)...........................................................................................................................3
3. Ratio analysis...........................................................................................................................4
Requirement (b)...........................................................................................................................4
Requirement (c).........................................................................................................................10
Requirement (d).........................................................................................................................11
4. Project financials....................................................................................................................14
Question 2......................................................................................................................................14
Requirement (a).........................................................................................................................14
Requirement (b).........................................................................................................................17
Requirement (c).........................................................................................................................19
5. Project risks............................................................................................................................21
6. Critical discussion of the methods..........................................................................................21
Requirement (d).........................................................................................................................21
7. Final recommendation............................................................................................................22
Reference.......................................................................................................................................23
2ACCOUNTING AND MANAGERIAL FINANCE
1. Executive summary
Question one of the tasks is to carry out detailed financial analysis of Britvic Plc using the
financial key ratios and analysing the financial statements of the entity. The report will further,
compare the performance of the company against its main competitor Nichols Plc which is the
supplier of soft drinks to the catering, wholesale, retail, licensed and leisure industries in UK.
The report will focus on critical evaluation of Britvic Plc and will analyse its working capital
management. Question 2 will analyse the project that is intended to be carry out by the company
and taking into consideration various scenarios presentation will be prepared to the investment
board regarding the acceptability of the project. Recommendation will be provided taking into
consideration different funding choice and other information provided in the question.
⊘ This is a preview!⊘
Do you want full access?
Subscribe today to unlock all pages.
Trusted by 1+ million students worldwide
3ACCOUNTING AND MANAGERIAL FINANCE
2. Rational of the project
Question 1
Requirement (a)
Introduction
Britvic Plc which is the soft drink company is UK based entity. It operates in soft drink
manufacturing and distribution industry and operates through 6 segments including GB carbs,
GB stills, France, Brazil, Ireland and International. Across the 4 markets the entity has developed
the strong portfolio of own iconic brands including Tango, Robinsons, J2O, MiWadi, Teisseire,
Maguary, Fruite and DaFruta. Apart from that, In Ireland and GB it sells and produces various
soft drinks for famous soft drink company PepsiCo including 7UP, Pepsi, Mountain Dew and
SoBe under the exclusive agreement with PepsiCo. It is the largest supplier for branded soft
drinks and number 2 suppliers for branded carbonated soft drinks in GB and is the industry
leader in France and Ireland (Britvic.com 2019).
Looking into the financial performance of the entity for the last 5 years it can be
identified that the revenues as well as the net profit margin of the entity are in increasing trend.
Further, the entity is regular paying dividend the payment of dividend for the last 5 years is in
increasing trend. However, it has been observed that apart from the cost of sales, selling and
distribution expenses is one of the major expenses for the entity and the entity is spending
considerable amount in this head (Britvic.com 2019). Looking into the balance sheet of the entity
it can be identified that current ratio of the company has been reduced after the year 2015 as the
liabilities started increasing as compared to the current assets. However, the leverage position of
Paraphrase This Document
Need a fresh take? Get an instant paraphrase of this document with our AI Paraphraser
4ACCOUNTING AND MANAGERIAL FINANCE
the entity over the years has been improved as the entity started paying off the long term
borrowing and additional funding has been raised through equity. Further, the earnings per share
over the last 5 years are in increasing trends and the entity is regular in paying dividend
(Britvic.com 2019).
3. Ratio analysis
Requirement (b)
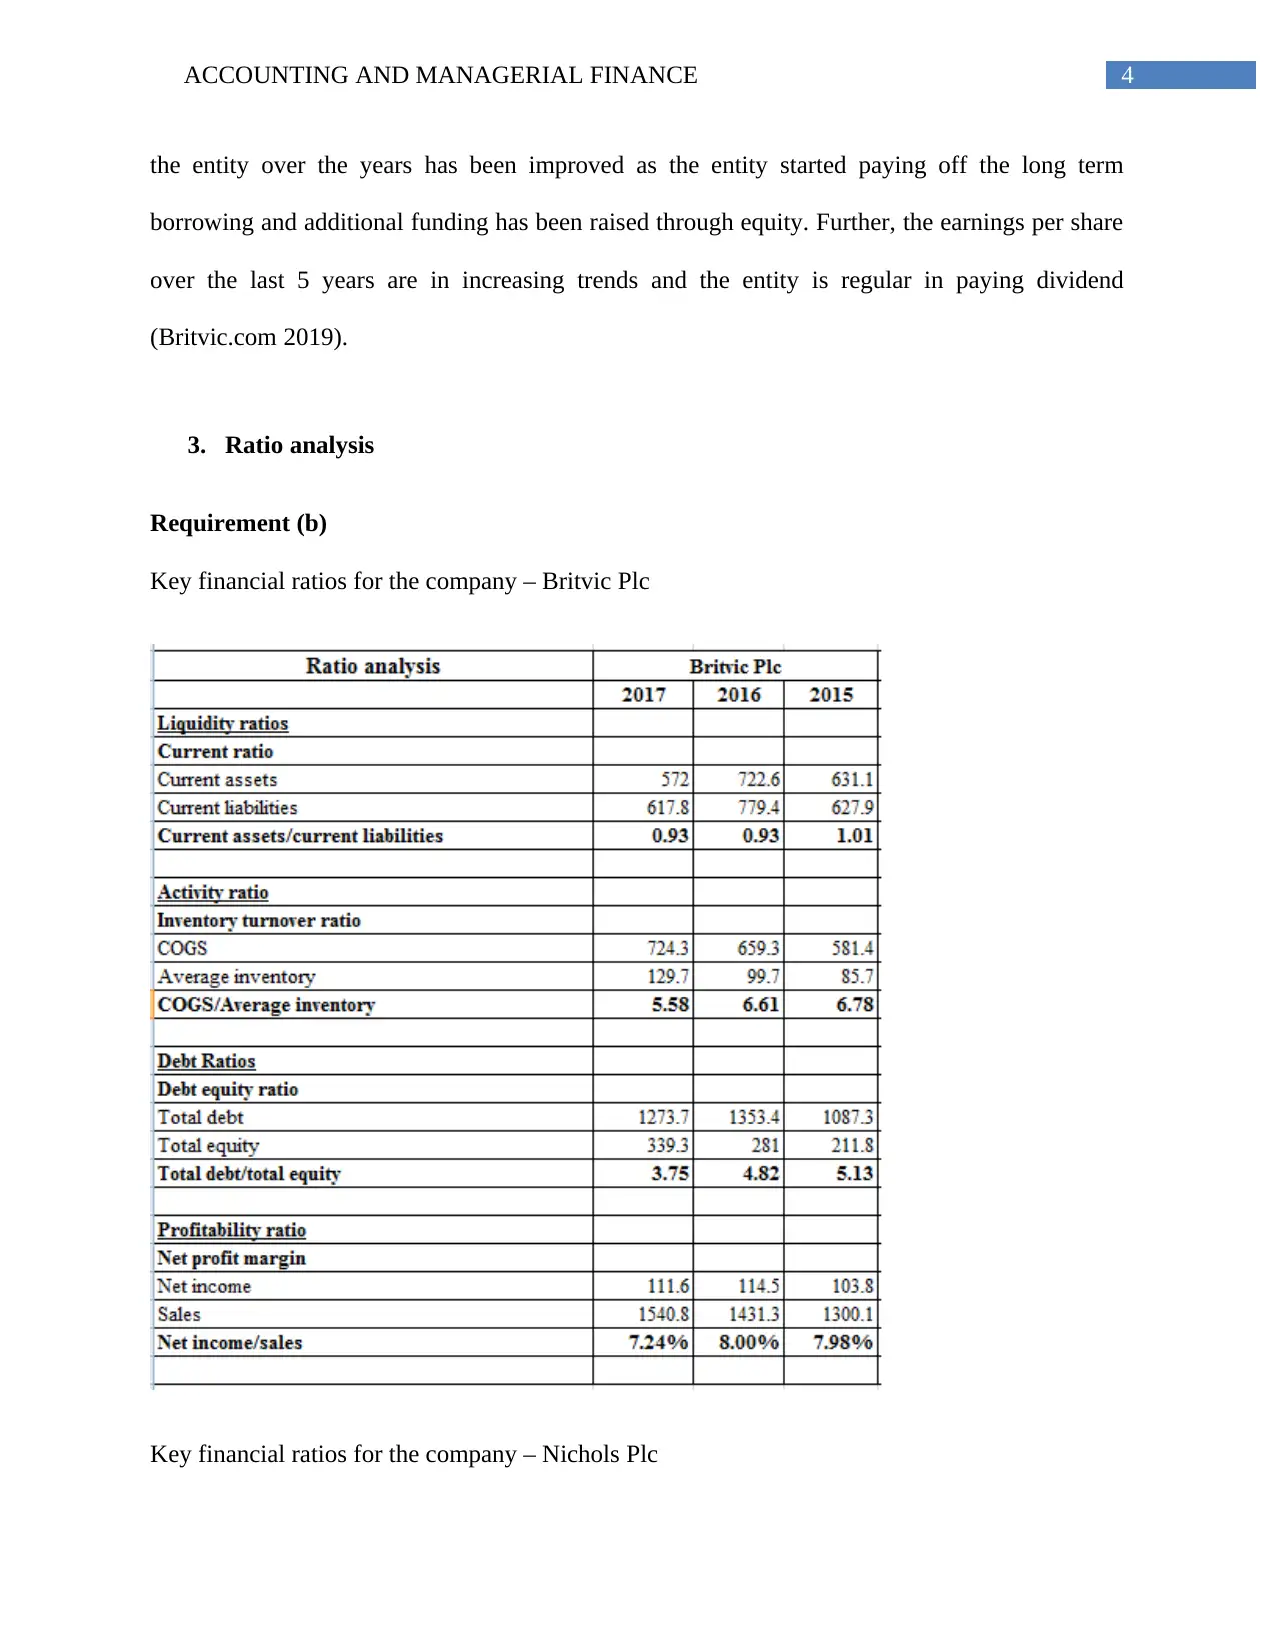
Key financial ratios for the company – Britvic Plc
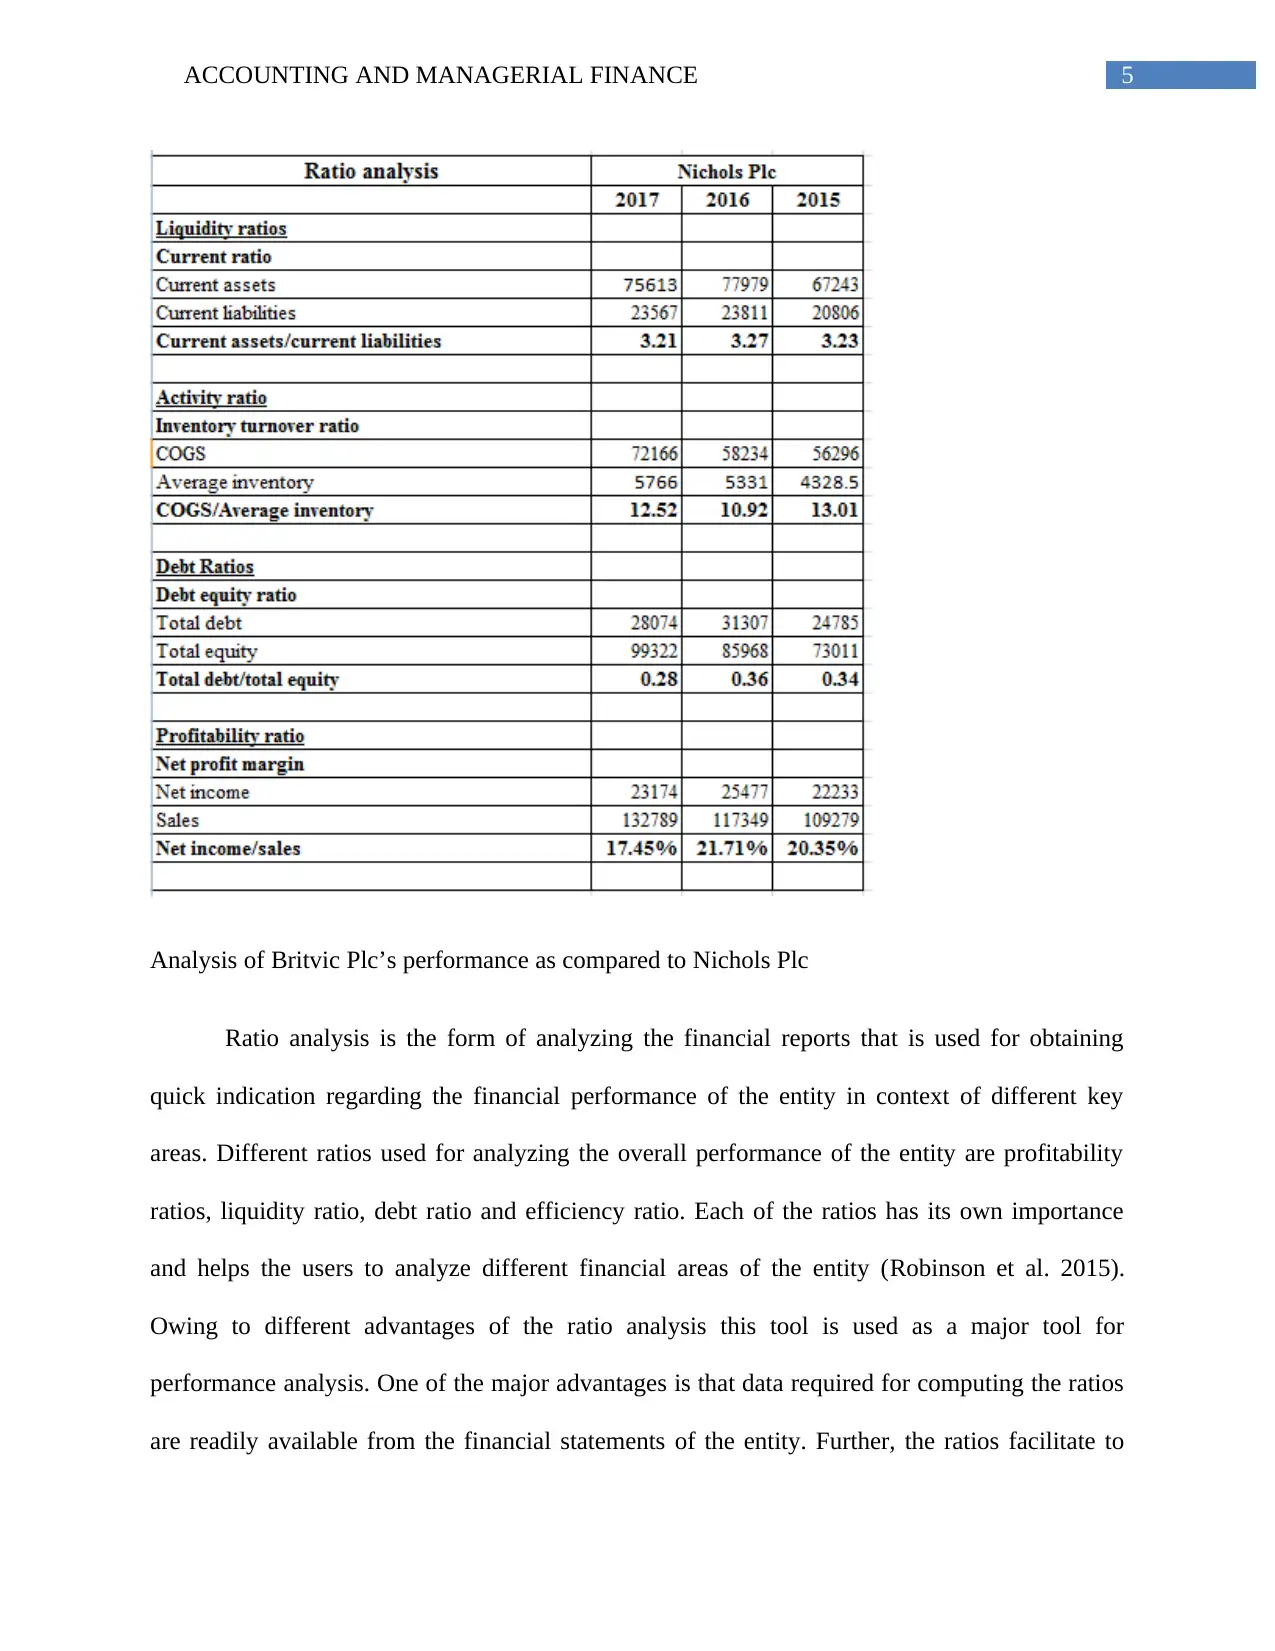
Key financial ratios for the company – Nichols Plc
the entity over the years has been improved as the entity started paying off the long term
borrowing and additional funding has been raised through equity. Further, the earnings per share
over the last 5 years are in increasing trends and the entity is regular in paying dividend
(Britvic.com 2019).
3. Ratio analysis
Requirement (b)
Key financial ratios for the company – Britvic Plc
Key financial ratios for the company – Nichols Plc
5ACCOUNTING AND MANAGERIAL FINANCE
Analysis of Britvic Plc’s performance as compared to Nichols Plc
Ratio analysis is the form of analyzing the financial reports that is used for obtaining
quick indication regarding the financial performance of the entity in context of different key
areas. Different ratios used for analyzing the overall performance of the entity are profitability
ratios, liquidity ratio, debt ratio and efficiency ratio. Each of the ratios has its own importance
and helps the users to analyze different financial areas of the entity (Robinson et al. 2015).
Owing to different advantages of the ratio analysis this tool is used as a major tool for
performance analysis. One of the major advantages is that data required for computing the ratios
are readily available from the financial statements of the entity. Further, the ratios facilitate to
⊘ This is a preview!⊘
Do you want full access?
Subscribe today to unlock all pages.
Trusted by 1+ million students worldwide
6ACCOUNTING AND MANAGERIAL FINANCE
make comparison with other entity’s performance. Apart from that, it can be used to perform
trend analysis and identifying the areas where the performances have been deteriorated or
improved (Wahlen, Baginski and Bradshaw 2014)
Liquidity ratio –
In accounting, liquidity is depicted as the entity’s ability in terms of meeting the financial
obligation as it becomes due. Hence, the liquidity ratio is used for measuring the ability of the
organization to meet the short term debts. Liquidity ratio represents the number of times the
current assets of the entity can cover up the short term payables. If the result is more than 1 it
signifies that the current assets are sufficient to pay off the current obligations. On the contrary,
the liquid ratio of less than 1 signifies that the company’s current assets are not sufficient to pay
off the current obligations (Easton and Sommers 2018)
One of the most used liquid ratios is current ratio that measures the current liabilities of
the entity against its current assets. It is used to measure the entity’s liquidity position quickly. It
is computed through dividing the current assets by the current liabilities. Here, all the current
assets and all the current liabilities of the company are taken into consideration. Looking into the
current ratio of the company it can be identified that current ratio of Britvic Plc is in reducing
trend and over the last 3 years it has been reduced from 1.01 to 0.93. Major reason behind the
reduction of current asset was decrease in cash and cash equivalent that was significantly
reduced to $ 82.5 million in 2017 from $ 205.9 million (DeFusco et al. 2015). It is indicating that
the company’s current assets are not sufficient to meet the current debt obligations. On the other
hand, if the current ratio of its competitor Nichols Plc is considered it can be identified that
through the company’s current ratio over the last 3 years has been reduced from 3.23 to 3.21, for
Paraphrase This Document
Need a fresh take? Get an instant paraphrase of this document with our AI Paraphraser
7ACCOUNTING AND MANAGERIAL FINANCE
all the 3 years its current ratio is quite high as compared to Britvic Plc and are sufficient to meet
the short term debt obligation (Nicholsplc.co.uk 2019).
Activity ratio –
Activity ratios are used to measure the company’s ability in context of converting the
balance sheet accounts into the revenues. It is used for assessing the efficiency of the entity with
regard to generation of revenues in cash form and the sales on the basis of its liability, assets, and
capital accounts. It determines the relationship among the sales and the given assets, say,
inventories. It indicates the ratio among how much investment is made for the particular assets
and the time taken to convert the same into cash (Coates 2014)
One of the most used activity ratios is inventory turnover ratio that measures the time
taken by the entity to replace or to sale the entire stock of inventories. It focuses on relationship
among the COGS and the average stock maintained by the entity (Entwistle 2015). Hence, it is
also known as the stock velocity ratio. It is computed through dividing the COGS by the average
inventories. Looking into the inventory turnover ratio of the company it can be identified that
inventory turnover ratio of Britvic Plc is in reducing trend and over the last 3 years it has been
reduced from 6.78 to 5.58. It is indicating that the company’s efficiency in replacing or selling its
assets is reduced over the years. Major reason of the reduction is the cost of sales of the entity
has been increased at higher pace as compared to the increase in inventories (Britvic.com 2019).
On the other hand, if the inventory turnover ratio of its competitor Nichols Plc is considered it
can be identified that though the company’s inventory turnover ratio over the last 3 years has
been reduced from 13.01 to 10.92, for all the 3 years its inventory turnover ratio is quite high as
8ACCOUNTING AND MANAGERIAL FINANCE
compared to Britvic Plc and are efficient in replacing or selling its inventories (Nicholsplc.co.uk
2019).
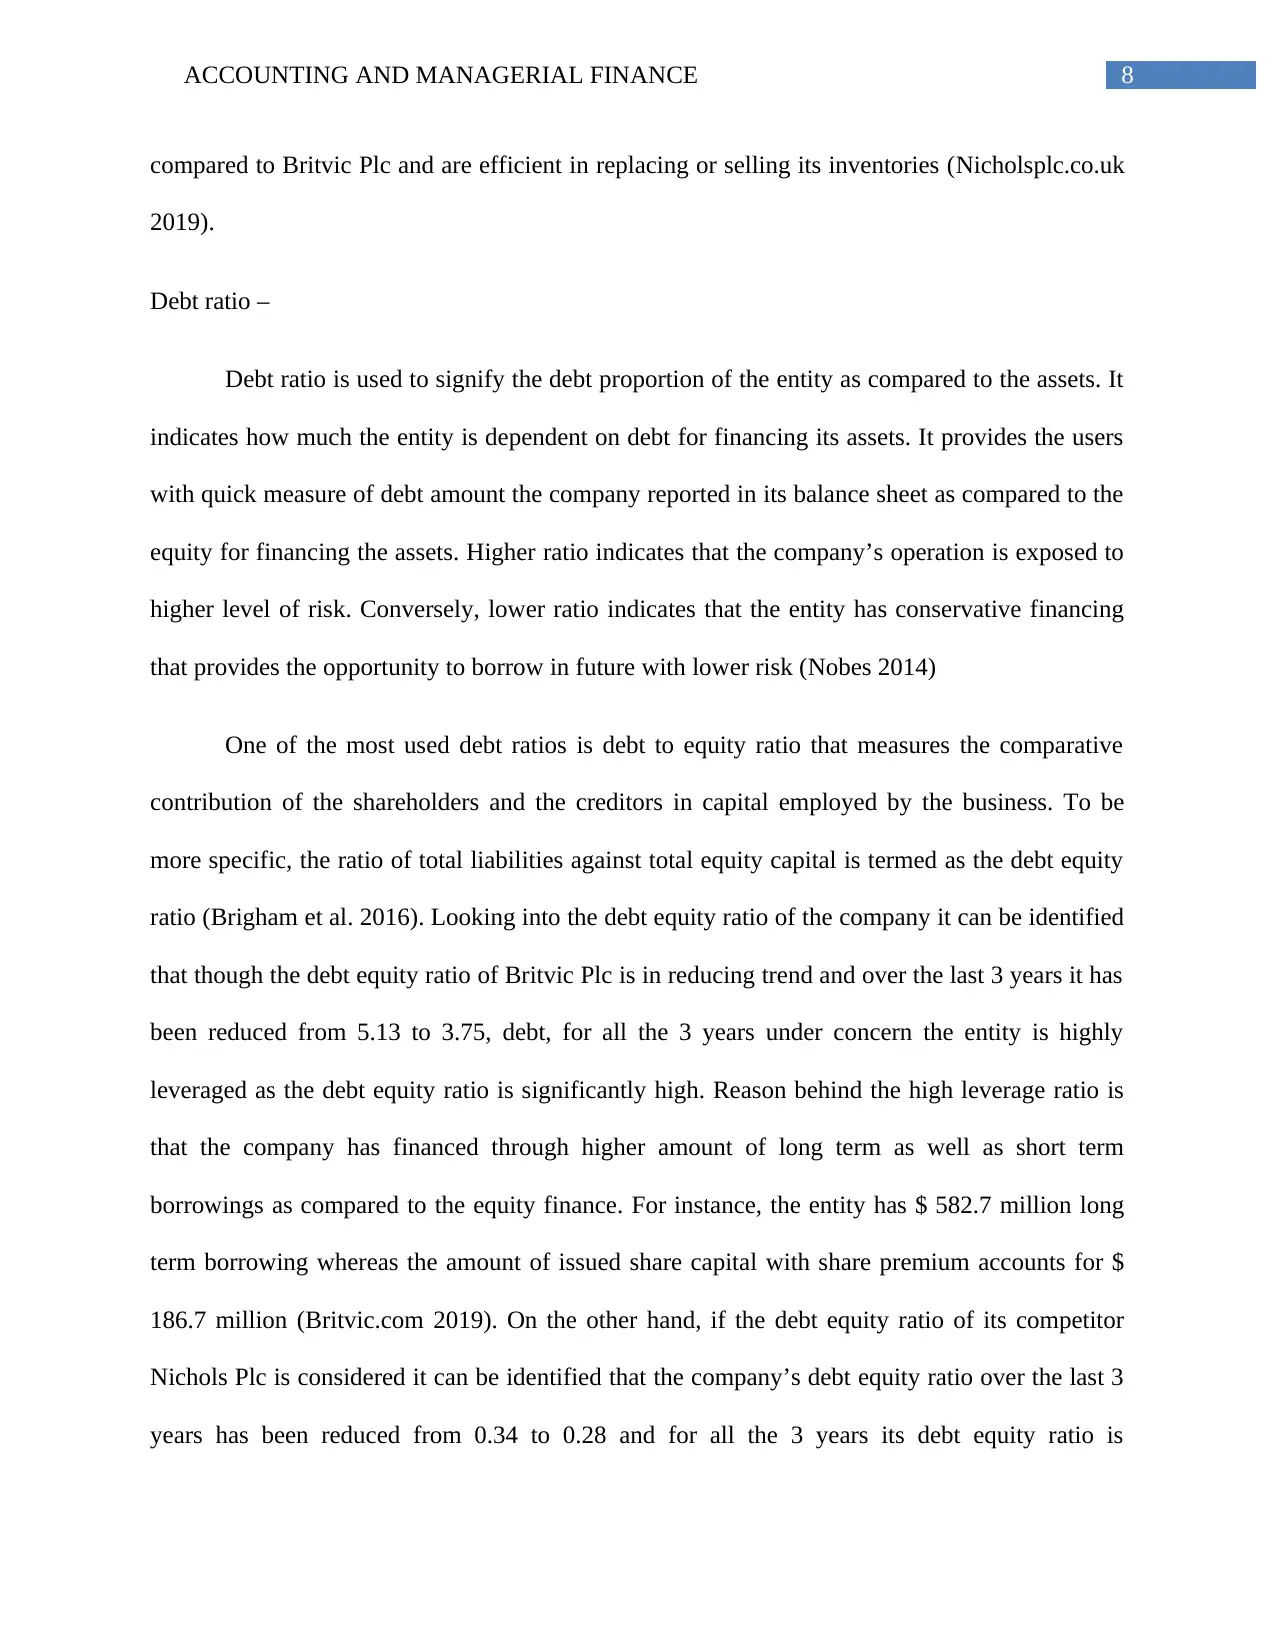
Debt ratio –
Debt ratio is used to signify the debt proportion of the entity as compared to the assets. It
indicates how much the entity is dependent on debt for financing its assets. It provides the users
with quick measure of debt amount the company reported in its balance sheet as compared to the
equity for financing the assets. Higher ratio indicates that the company’s operation is exposed to
higher level of risk. Conversely, lower ratio indicates that the entity has conservative financing
that provides the opportunity to borrow in future with lower risk (Nobes 2014)
One of the most used debt ratios is debt to equity ratio that measures the comparative
contribution of the shareholders and the creditors in capital employed by the business. To be
more specific, the ratio of total liabilities against total equity capital is termed as the debt equity
ratio (Brigham et al. 2016). Looking into the debt equity ratio of the company it can be identified
that though the debt equity ratio of Britvic Plc is in reducing trend and over the last 3 years it has
been reduced from 5.13 to 3.75, debt, for all the 3 years under concern the entity is highly
leveraged as the debt equity ratio is significantly high. Reason behind the high leverage ratio is
that the company has financed through higher amount of long term as well as short term
borrowings as compared to the equity finance. For instance, the entity has $ 582.7 million long
term borrowing whereas the amount of issued share capital with share premium accounts for $
186.7 million (Britvic.com 2019). On the other hand, if the debt equity ratio of its competitor
Nichols Plc is considered it can be identified that the company’s debt equity ratio over the last 3
years has been reduced from 0.34 to 0.28 and for all the 3 years its debt equity ratio is
compared to Britvic Plc and are efficient in replacing or selling its inventories (Nicholsplc.co.uk
2019).
Debt ratio –
Debt ratio is used to signify the debt proportion of the entity as compared to the assets. It
indicates how much the entity is dependent on debt for financing its assets. It provides the users
with quick measure of debt amount the company reported in its balance sheet as compared to the
equity for financing the assets. Higher ratio indicates that the company’s operation is exposed to
higher level of risk. Conversely, lower ratio indicates that the entity has conservative financing
that provides the opportunity to borrow in future with lower risk (Nobes 2014)
One of the most used debt ratios is debt to equity ratio that measures the comparative
contribution of the shareholders and the creditors in capital employed by the business. To be
more specific, the ratio of total liabilities against total equity capital is termed as the debt equity
ratio (Brigham et al. 2016). Looking into the debt equity ratio of the company it can be identified
that though the debt equity ratio of Britvic Plc is in reducing trend and over the last 3 years it has
been reduced from 5.13 to 3.75, debt, for all the 3 years under concern the entity is highly
leveraged as the debt equity ratio is significantly high. Reason behind the high leverage ratio is
that the company has financed through higher amount of long term as well as short term
borrowings as compared to the equity finance. For instance, the entity has $ 582.7 million long
term borrowing whereas the amount of issued share capital with share premium accounts for $
186.7 million (Britvic.com 2019). On the other hand, if the debt equity ratio of its competitor
Nichols Plc is considered it can be identified that the company’s debt equity ratio over the last 3
years has been reduced from 0.34 to 0.28 and for all the 3 years its debt equity ratio is
⊘ This is a preview!⊘
Do you want full access?
Subscribe today to unlock all pages.
Trusted by 1+ million students worldwide
9ACCOUNTING AND MANAGERIAL FINANCE
significantly low as compared to Britvic Plc and are hence, it will be considered as lower
leverages and less exposed to financial risk (Nicholsplc.co.uk 2019).
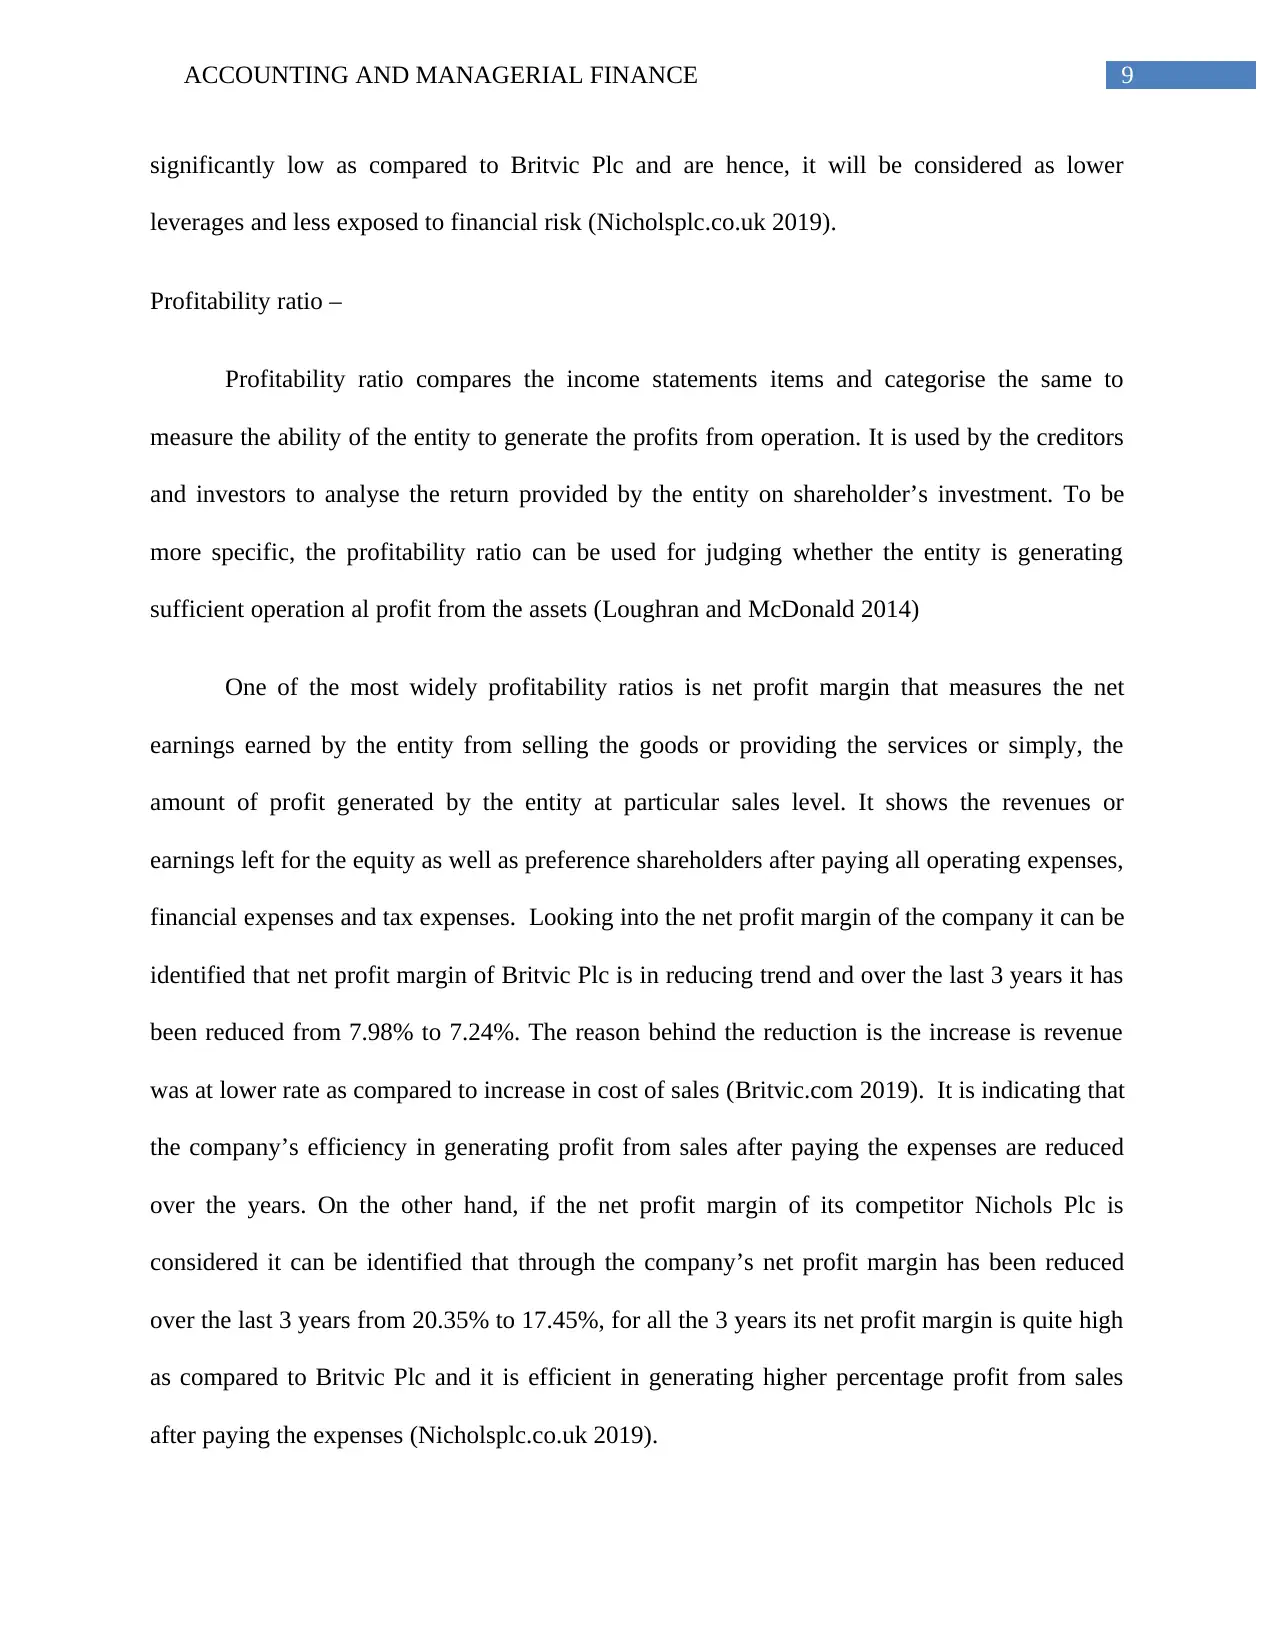
Profitability ratio –
Profitability ratio compares the income statements items and categorise the same to
measure the ability of the entity to generate the profits from operation. It is used by the creditors
and investors to analyse the return provided by the entity on shareholder’s investment. To be
more specific, the profitability ratio can be used for judging whether the entity is generating
sufficient operation al profit from the assets (Loughran and McDonald 2014)
One of the most widely profitability ratios is net profit margin that measures the net
earnings earned by the entity from selling the goods or providing the services or simply, the
amount of profit generated by the entity at particular sales level. It shows the revenues or
earnings left for the equity as well as preference shareholders after paying all operating expenses,
financial expenses and tax expenses. Looking into the net profit margin of the company it can be
identified that net profit margin of Britvic Plc is in reducing trend and over the last 3 years it has
been reduced from 7.98% to 7.24%. The reason behind the reduction is the increase is revenue
was at lower rate as compared to increase in cost of sales (Britvic.com 2019). It is indicating that
the company’s efficiency in generating profit from sales after paying the expenses are reduced
over the years. On the other hand, if the net profit margin of its competitor Nichols Plc is
considered it can be identified that through the company’s net profit margin has been reduced
over the last 3 years from 20.35% to 17.45%, for all the 3 years its net profit margin is quite high
as compared to Britvic Plc and it is efficient in generating higher percentage profit from sales
after paying the expenses (Nicholsplc.co.uk 2019).
significantly low as compared to Britvic Plc and are hence, it will be considered as lower
leverages and less exposed to financial risk (Nicholsplc.co.uk 2019).
Profitability ratio –
Profitability ratio compares the income statements items and categorise the same to
measure the ability of the entity to generate the profits from operation. It is used by the creditors
and investors to analyse the return provided by the entity on shareholder’s investment. To be
more specific, the profitability ratio can be used for judging whether the entity is generating
sufficient operation al profit from the assets (Loughran and McDonald 2014)
One of the most widely profitability ratios is net profit margin that measures the net
earnings earned by the entity from selling the goods or providing the services or simply, the
amount of profit generated by the entity at particular sales level. It shows the revenues or
earnings left for the equity as well as preference shareholders after paying all operating expenses,
financial expenses and tax expenses. Looking into the net profit margin of the company it can be
identified that net profit margin of Britvic Plc is in reducing trend and over the last 3 years it has
been reduced from 7.98% to 7.24%. The reason behind the reduction is the increase is revenue
was at lower rate as compared to increase in cost of sales (Britvic.com 2019). It is indicating that
the company’s efficiency in generating profit from sales after paying the expenses are reduced
over the years. On the other hand, if the net profit margin of its competitor Nichols Plc is
considered it can be identified that through the company’s net profit margin has been reduced
over the last 3 years from 20.35% to 17.45%, for all the 3 years its net profit margin is quite high
as compared to Britvic Plc and it is efficient in generating higher percentage profit from sales
after paying the expenses (Nicholsplc.co.uk 2019).
Paraphrase This Document
Need a fresh take? Get an instant paraphrase of this document with our AI Paraphraser
10ACCOUNTING AND MANAGERIAL FINANCE
Hence, if the overall financial performance of Britvic Plc is compared with its competitor
Nichols Plc it can be stated that the Nichols Plc’s performance is better as compared to Britvic
Plc in all aspects including liquidity, solvency, efficiency and profitability.
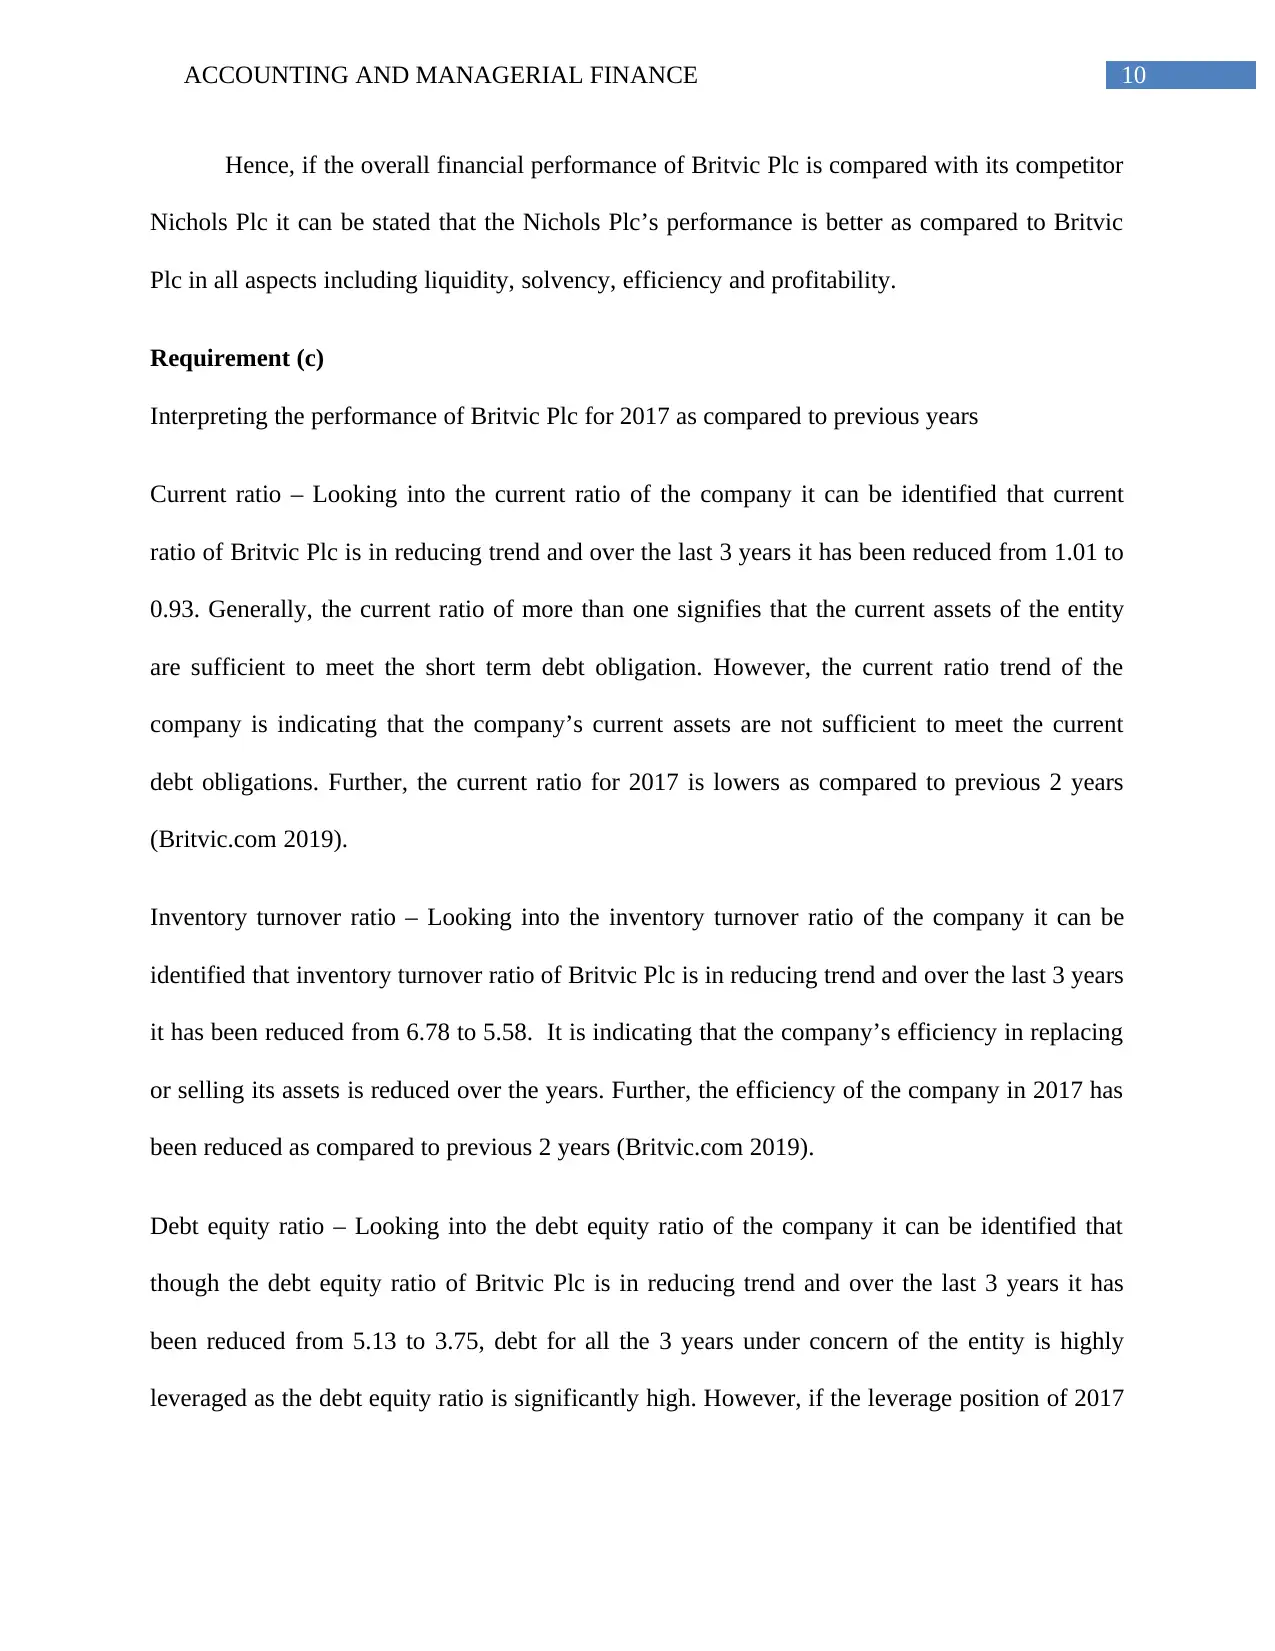
Requirement (c)
Interpreting the performance of Britvic Plc for 2017 as compared to previous years
Current ratio – Looking into the current ratio of the company it can be identified that current
ratio of Britvic Plc is in reducing trend and over the last 3 years it has been reduced from 1.01 to
0.93. Generally, the current ratio of more than one signifies that the current assets of the entity
are sufficient to meet the short term debt obligation. However, the current ratio trend of the
company is indicating that the company’s current assets are not sufficient to meet the current
debt obligations. Further, the current ratio for 2017 is lowers as compared to previous 2 years
(Britvic.com 2019).
Inventory turnover ratio – Looking into the inventory turnover ratio of the company it can be
identified that inventory turnover ratio of Britvic Plc is in reducing trend and over the last 3 years
it has been reduced from 6.78 to 5.58. It is indicating that the company’s efficiency in replacing
or selling its assets is reduced over the years. Further, the efficiency of the company in 2017 has
been reduced as compared to previous 2 years (Britvic.com 2019).
Debt equity ratio – Looking into the debt equity ratio of the company it can be identified that
though the debt equity ratio of Britvic Plc is in reducing trend and over the last 3 years it has
been reduced from 5.13 to 3.75, debt for all the 3 years under concern of the entity is highly
leveraged as the debt equity ratio is significantly high. However, if the leverage position of 2017
Hence, if the overall financial performance of Britvic Plc is compared with its competitor
Nichols Plc it can be stated that the Nichols Plc’s performance is better as compared to Britvic
Plc in all aspects including liquidity, solvency, efficiency and profitability.
Requirement (c)
Interpreting the performance of Britvic Plc for 2017 as compared to previous years
Current ratio – Looking into the current ratio of the company it can be identified that current
ratio of Britvic Plc is in reducing trend and over the last 3 years it has been reduced from 1.01 to
0.93. Generally, the current ratio of more than one signifies that the current assets of the entity
are sufficient to meet the short term debt obligation. However, the current ratio trend of the
company is indicating that the company’s current assets are not sufficient to meet the current
debt obligations. Further, the current ratio for 2017 is lowers as compared to previous 2 years
(Britvic.com 2019).
Inventory turnover ratio – Looking into the inventory turnover ratio of the company it can be
identified that inventory turnover ratio of Britvic Plc is in reducing trend and over the last 3 years
it has been reduced from 6.78 to 5.58. It is indicating that the company’s efficiency in replacing
or selling its assets is reduced over the years. Further, the efficiency of the company in 2017 has
been reduced as compared to previous 2 years (Britvic.com 2019).
Debt equity ratio – Looking into the debt equity ratio of the company it can be identified that
though the debt equity ratio of Britvic Plc is in reducing trend and over the last 3 years it has
been reduced from 5.13 to 3.75, debt for all the 3 years under concern of the entity is highly
leveraged as the debt equity ratio is significantly high. However, if the leverage position of 2017
11ACCOUNTING AND MANAGERIAL FINANCE
is compared with previous 2 years it can be identified that the leverage position has been
improved in 2017 (Britvic.com 2019).
Net profit margin – Looking into the net profit margin of the company it can be identified that
net profit margin of Britvic Plc is in reducing trend and over the last 3 years it has been reduced
from 7.98% to 7.24%. Hence, the profitability position of the entity for the year 2017 has been
deteriorated as compared to previous 2 years. It is indicating that the company’s efficiency in
generating profit from sales after paying the expenses are reduced over the years (Britvic.com
2019).
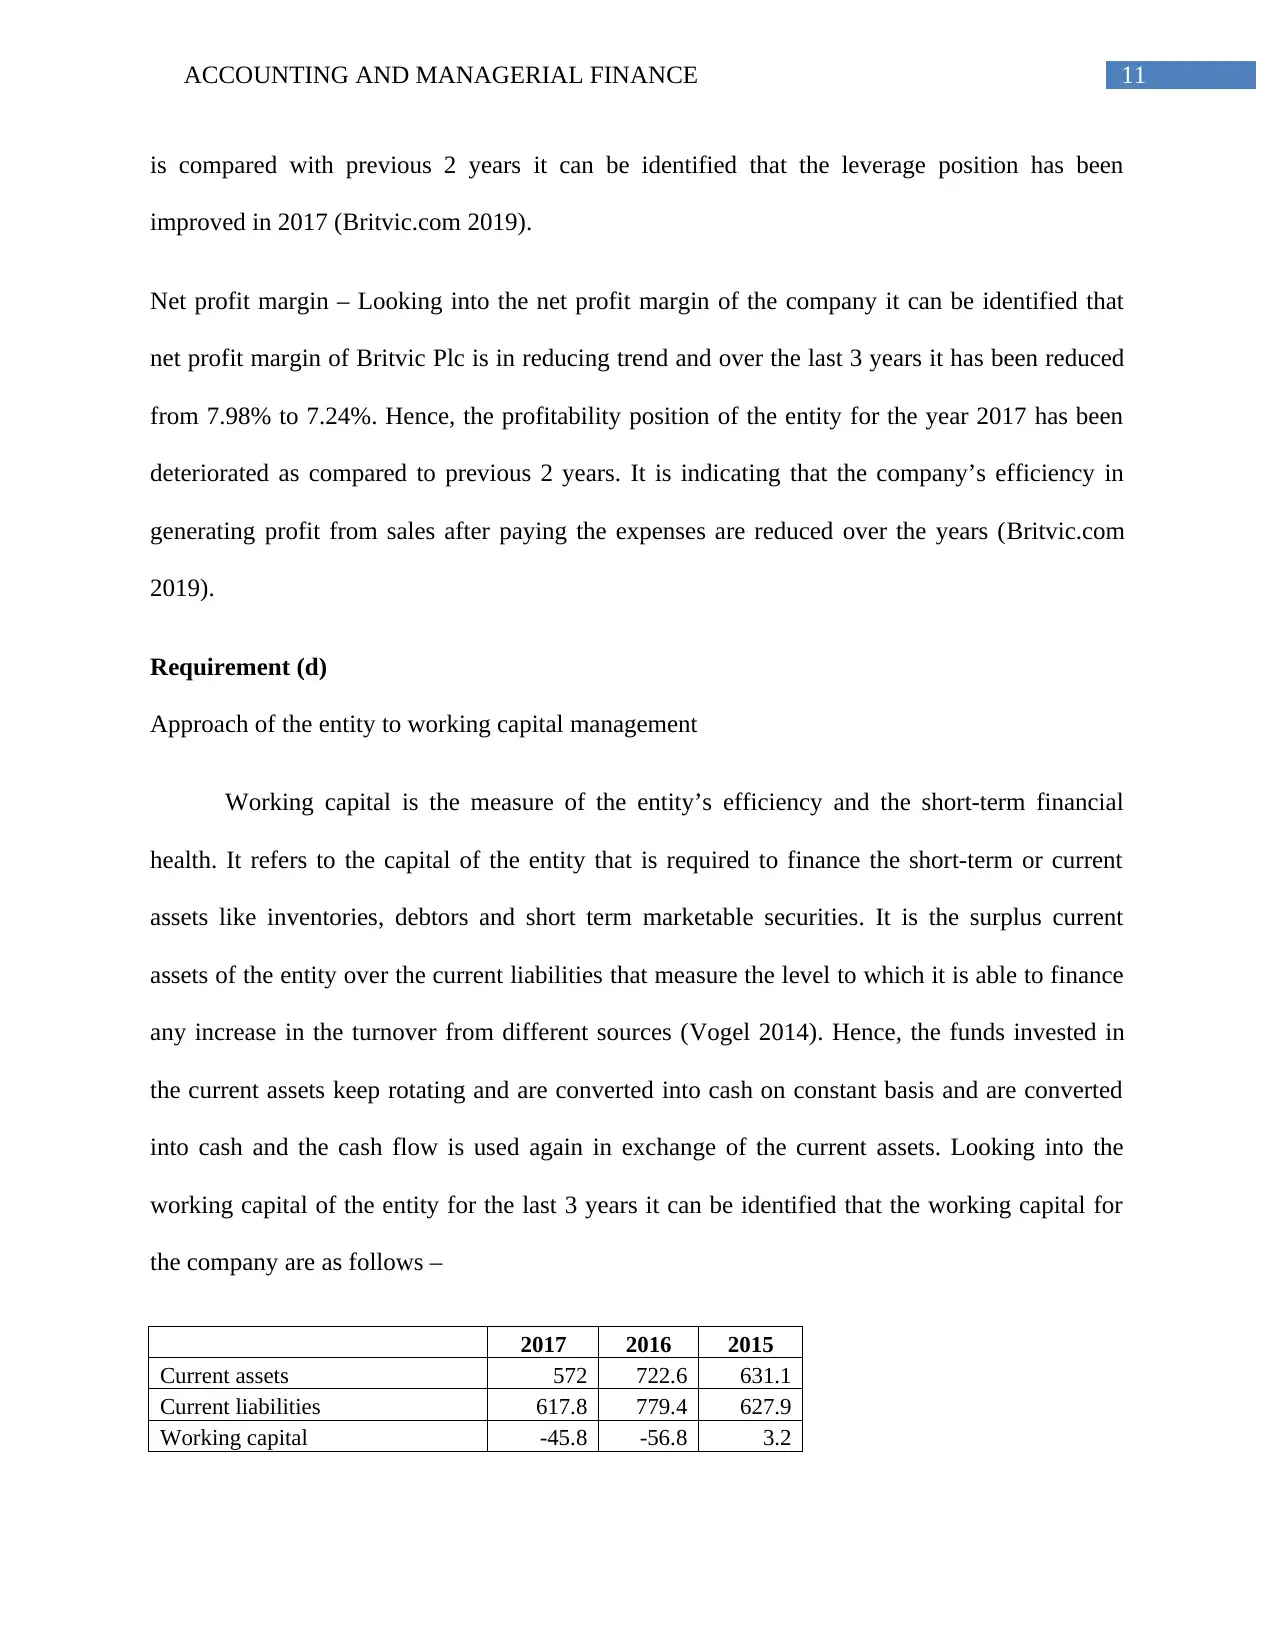
Requirement (d)
Approach of the entity to working capital management
Working capital is the measure of the entity’s efficiency and the short-term financial
health. It refers to the capital of the entity that is required to finance the short-term or current
assets like inventories, debtors and short term marketable securities. It is the surplus current
assets of the entity over the current liabilities that measure the level to which it is able to finance
any increase in the turnover from different sources (Vogel 2014). Hence, the funds invested in
the current assets keep rotating and are converted into cash on constant basis and are converted
into cash and the cash flow is used again in exchange of the current assets. Looking into the
working capital of the entity for the last 3 years it can be identified that the working capital for
the company are as follows –
2017 2016 2015
Current assets 572 722.6 631.1
Current liabilities 617.8 779.4 627.9
Working capital -45.8 -56.8 3.2
is compared with previous 2 years it can be identified that the leverage position has been
improved in 2017 (Britvic.com 2019).
Net profit margin – Looking into the net profit margin of the company it can be identified that
net profit margin of Britvic Plc is in reducing trend and over the last 3 years it has been reduced
from 7.98% to 7.24%. Hence, the profitability position of the entity for the year 2017 has been
deteriorated as compared to previous 2 years. It is indicating that the company’s efficiency in
generating profit from sales after paying the expenses are reduced over the years (Britvic.com
2019).
Requirement (d)
Approach of the entity to working capital management
Working capital is the measure of the entity’s efficiency and the short-term financial
health. It refers to the capital of the entity that is required to finance the short-term or current
assets like inventories, debtors and short term marketable securities. It is the surplus current
assets of the entity over the current liabilities that measure the level to which it is able to finance
any increase in the turnover from different sources (Vogel 2014). Hence, the funds invested in
the current assets keep rotating and are converted into cash on constant basis and are converted
into cash and the cash flow is used again in exchange of the current assets. Looking into the
working capital of the entity for the last 3 years it can be identified that the working capital for
the company are as follows –
2017 2016 2015
Current assets 572 722.6 631.1
Current liabilities 617.8 779.4 627.9
Working capital -45.8 -56.8 3.2
⊘ This is a preview!⊘
Do you want full access?
Subscribe today to unlock all pages.
Trusted by 1+ million students worldwide
1 out of 26
Related Documents


Your All-in-One AI-Powered Toolkit for Academic Success.
+13062052269
info@desklib.com
Available 24*7 on WhatsApp / Email
![[object Object]](/_next/static/media/star-bottom.7253800d.svg)
Unlock your academic potential
Copyright © 2020–2026 A2Z Services. All Rights Reserved. Developed and managed by ZUCOL.