Accounting for Managers Assignment 2: Financial Analysis Report

Verified

Added on  2021/06/17

|7
|1354
|25
Report
AI Summary
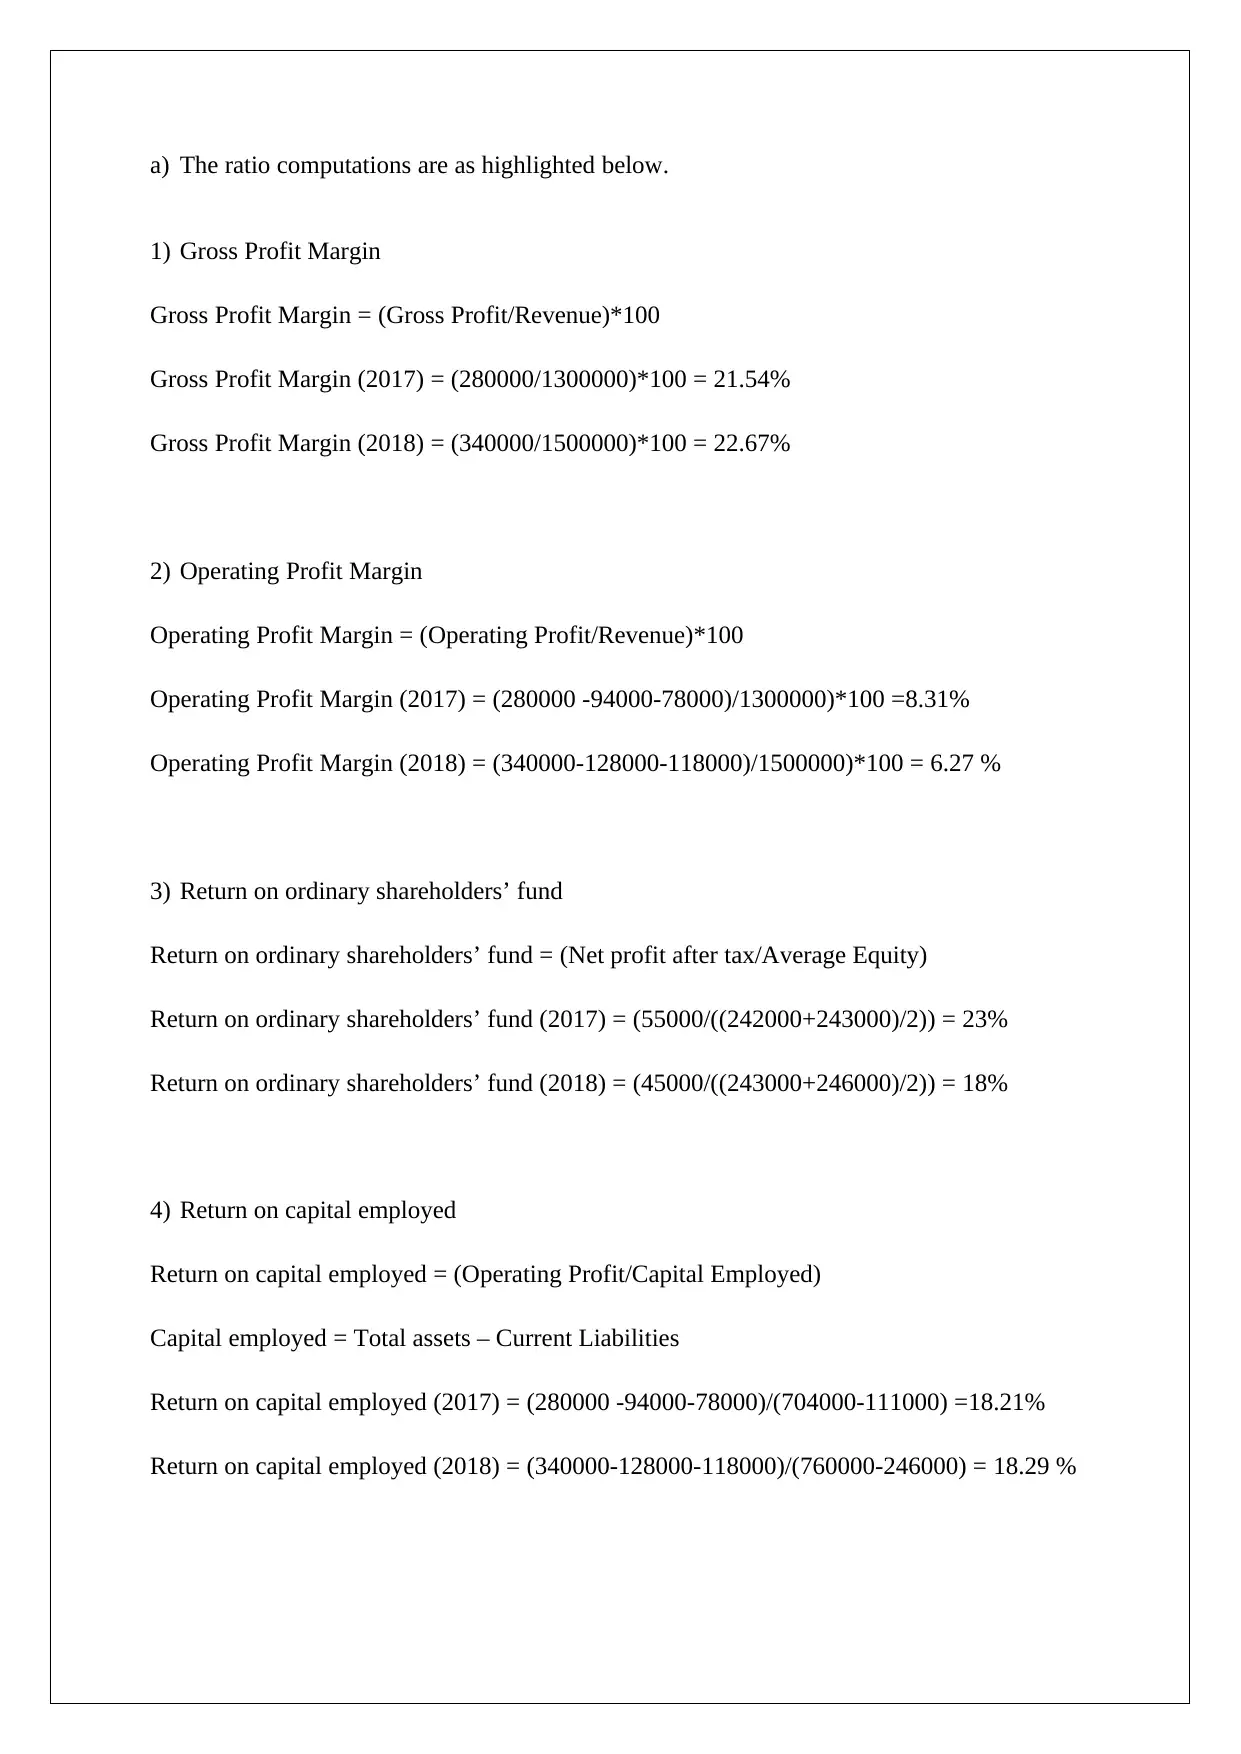
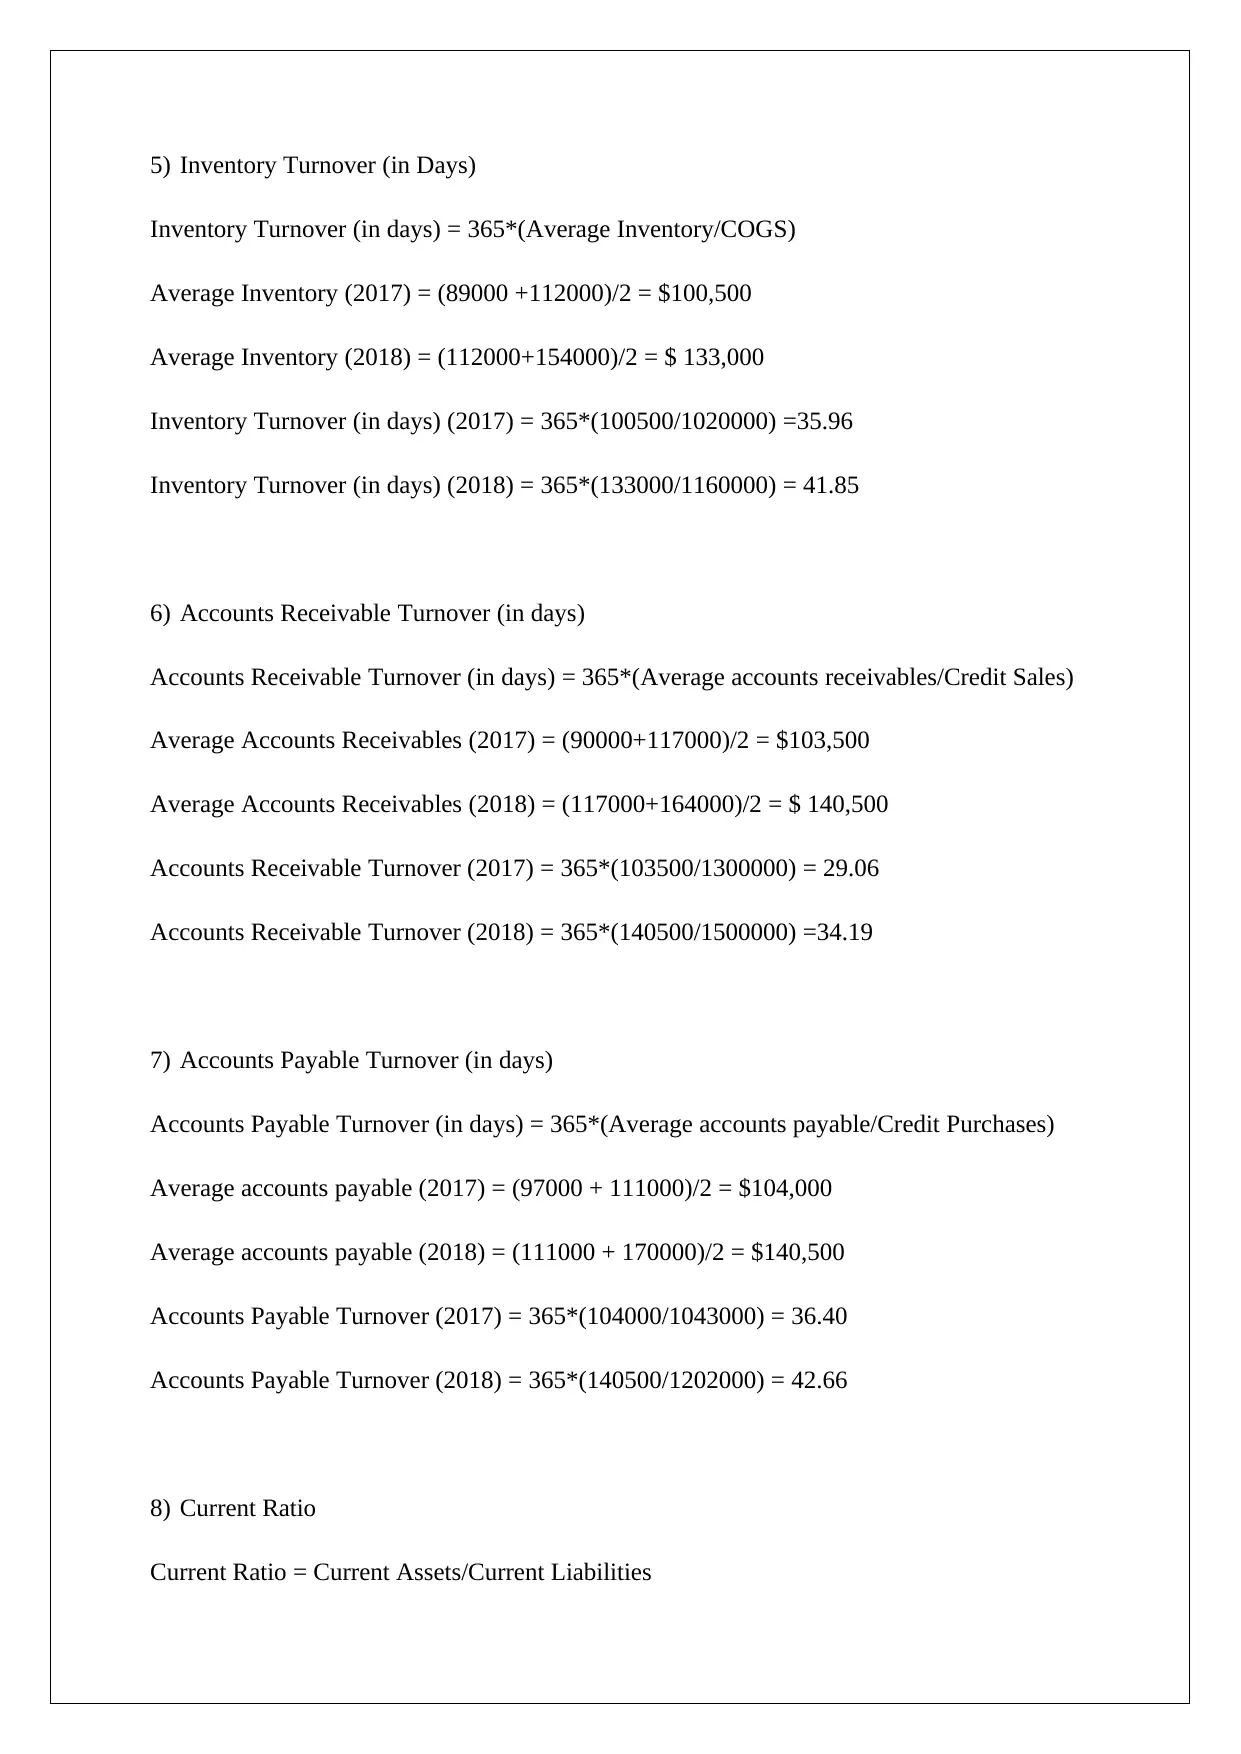
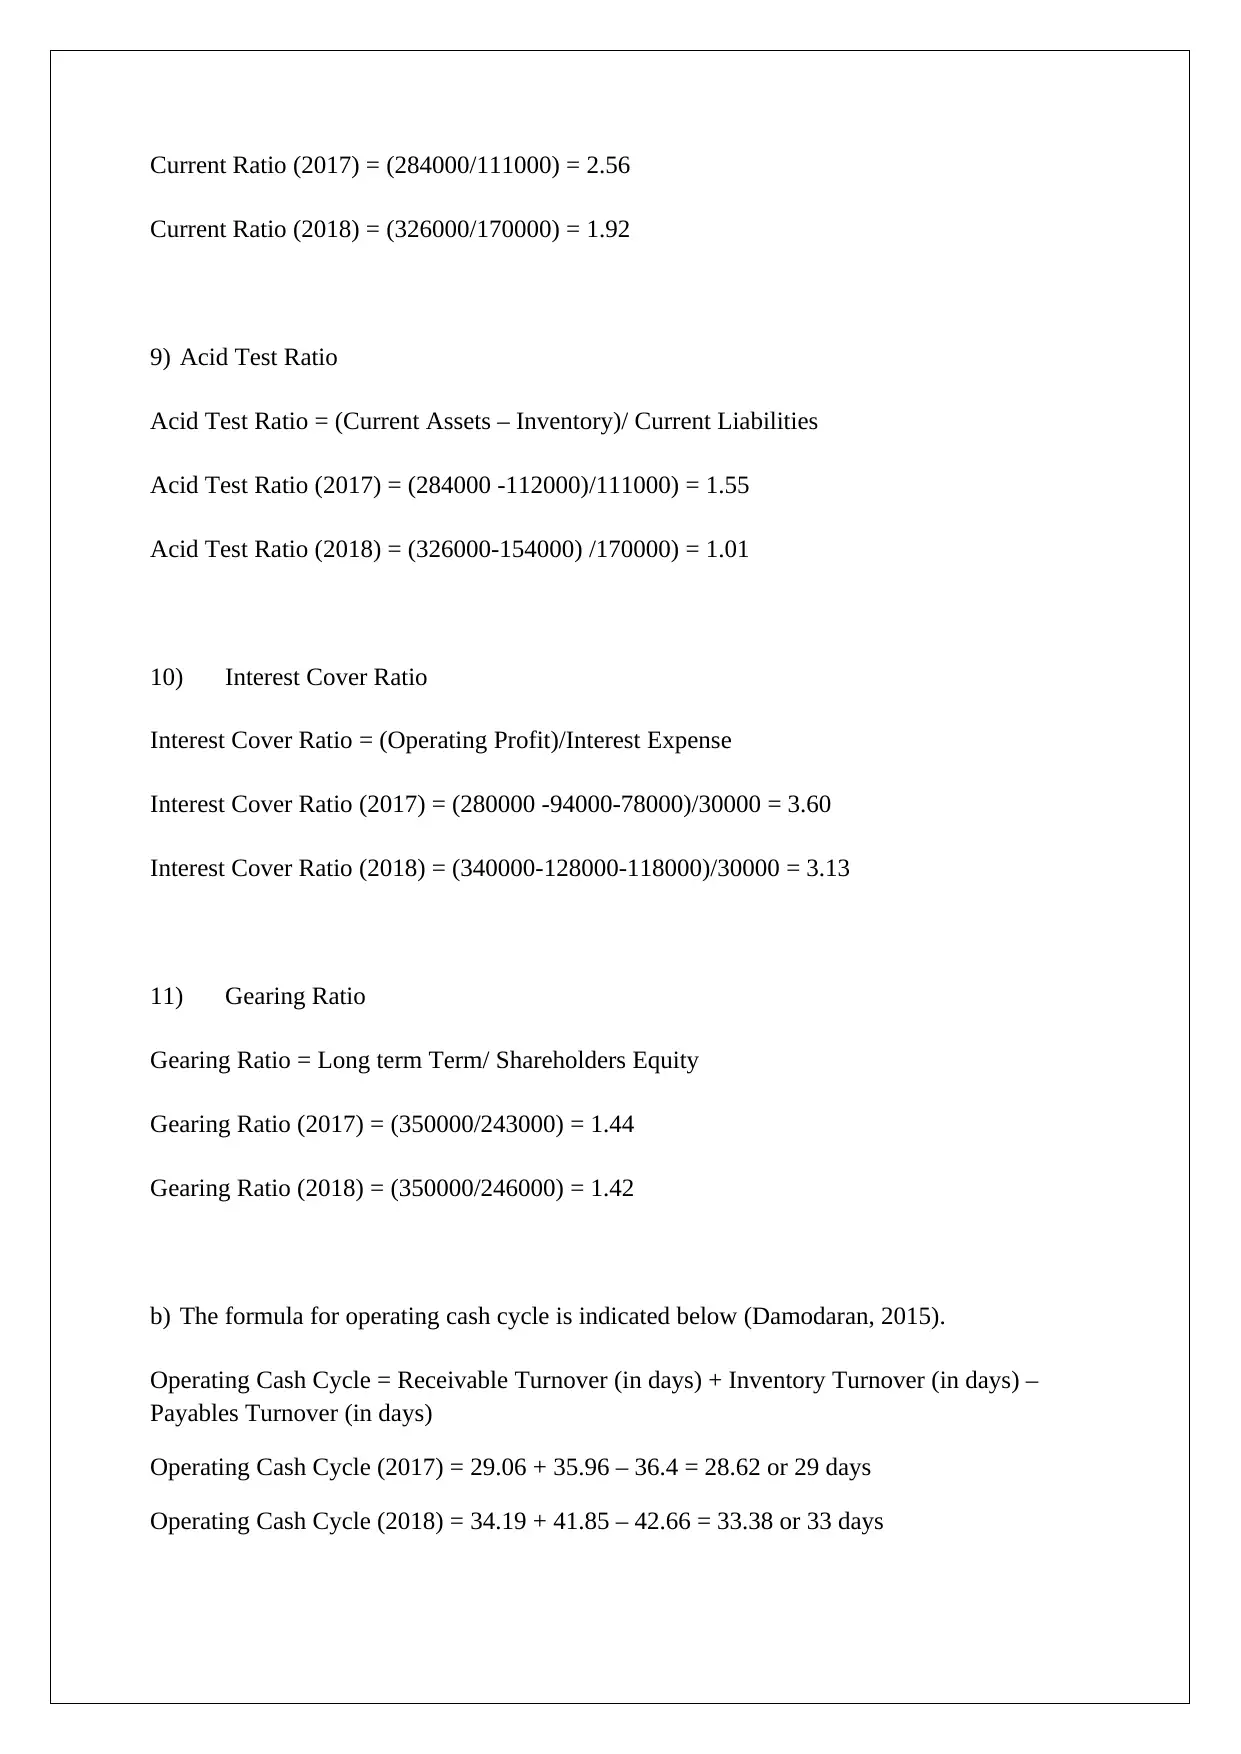
This report presents a comprehensive financial ratio analysis of Macca Pty Ltd, examining its performance over the years 2017 and 2018. The analysis includes the calculation and interpretation of various ratios, such as gross profit margin, operating profit margin, return on equity, return on capital employed, inventory turnover, accounts receivable turnover, accounts payable turnover, current ratio, acid test ratio, interest cover ratio, and gearing ratio. The report assesses the company's profitability, efficiency, liquidity, and gearing, highlighting trends and potential areas of concern. The findings reveal insights into the company's financial health, including improvements in gross profit margin, but declines in operating margins, and shifts in efficiency and liquidity metrics. The report concludes with a discussion of the operating cash cycle and provides references to relevant financial literature. This assignment is available on Desklib, a platform offering AI-powered study tools for students.
tabler-icon-diamond-filled.svg

Contribute Materials

Your contribution can guide someone’s learning journey. Share your documents today.
Document Page
ACCOUNTING FOR MANAGERS
ASSIGNMENT 2: FINANCIAL ANALYSIS
STDUENT ID/NAME
[Pick the date]
tabler-icon-diamond-filled.svg

Secure Best Marks with AI Grader

Need help grading? Try our AI Grader for instant feedback on your assignments.
Document Page
a) The ratio computations are as highlighted below.
1) Gross Profit Margin
Gross Profit Margin = (Gross Profit/Revenue)*100
Gross Profit Margin (2017) = (280000/1300000)*100 = 21.54%
Gross Profit Margin (2018) = (340000/1500000)*100 = 22.67%
2) Operating Profit Margin
Operating Profit Margin = (Operating Profit/Revenue)*100
Operating Profit Margin (2017) = (280000 -94000-78000)/1300000)*100 =8.31%
Operating Profit Margin (2018) = (340000-128000-118000)/1500000)*100 = 6.27 %
3) Return on ordinary shareholders’ fund
Return on ordinary shareholders’ fund = (Net profit after tax/Average Equity)
Return on ordinary shareholders’ fund (2017) = (55000/((242000+243000)/2)) = 23%
Return on ordinary shareholders’ fund (2018) = (45000/((243000+246000)/2)) = 18%
4) Return on capital employed
Return on capital employed = (Operating Profit/Capital Employed)
Capital employed = Total assets – Current Liabilities
Return on capital employed (2017) = (280000 -94000-78000)/(704000-111000) =18.21%
Return on capital employed (2018) = (340000-128000-118000)/(760000-246000) = 18.29 %
Document Page
5) Inventory Turnover (in Days)
Inventory Turnover (in days) = 365*(Average Inventory/COGS)
Average Inventory (2017) = (89000 +112000)/2 = $100,500
Average Inventory (2018) = (112000+154000)/2 = $ 133,000
Inventory Turnover (in days) (2017) = 365*(100500/1020000) =35.96
Inventory Turnover (in days) (2018) = 365*(133000/1160000) = 41.85
6) Accounts Receivable Turnover (in days)
Accounts Receivable Turnover (in days) = 365*(Average accounts receivables/Credit Sales)
Average Accounts Receivables (2017) = (90000+117000)/2 = $103,500
Average Accounts Receivables (2018) = (117000+164000)/2 = $ 140,500
Accounts Receivable Turnover (2017) = 365*(103500/1300000) = 29.06
Accounts Receivable Turnover (2018) = 365*(140500/1500000) =34.19
7) Accounts Payable Turnover (in days)
Accounts Payable Turnover (in days) = 365*(Average accounts payable/Credit Purchases)
Average accounts payable (2017) = (97000 + 111000)/2 = $104,000
Average accounts payable (2018) = (111000 + 170000)/2 = $140,500
Accounts Payable Turnover (2017) = 365*(104000/1043000) = 36.40
Accounts Payable Turnover (2018) = 365*(140500/1202000) = 42.66
8) Current Ratio
Current Ratio = Current Assets/Current Liabilities
Document Page
Current Ratio (2017) = (284000/111000) = 2.56
Current Ratio (2018) = (326000/170000) = 1.92
9) Acid Test Ratio
Acid Test Ratio = (Current Assets – Inventory)/ Current Liabilities
Acid Test Ratio (2017) = (284000 -112000)/111000) = 1.55
Acid Test Ratio (2018) = (326000-154000) /170000) = 1.01
10) Interest Cover Ratio
Interest Cover Ratio = (Operating Profit)/Interest Expense
Interest Cover Ratio (2017) = (280000 -94000-78000)/30000 = 3.60
Interest Cover Ratio (2018) = (340000-128000-118000)/30000 = 3.13
11) Gearing Ratio
Gearing Ratio = Long term Term/ Shareholders Equity
Gearing Ratio (2017) = (350000/243000) = 1.44
Gearing Ratio (2018) = (350000/246000) = 1.42
b) The formula for operating cash cycle is indicated below (Damodaran, 2015).
Operating Cash Cycle = Receivable Turnover (in days) + Inventory Turnover (in days) –
Payables Turnover (in days)
Operating Cash Cycle (2017) = 29.06 + 35.96 – 36.4 = 28.62 or 29 days
Operating Cash Cycle (2018) = 34.19 + 41.85 – 42.66 = 33.38 or 33 days
tabler-icon-diamond-filled.svg

Secure Best Marks with AI Grader

Need help grading? Try our AI Grader for instant feedback on your assignments.
Document Page
c) Introduction
The objective of this report is to carry out a ratio analysis of Macca Pty Ltd in wake of the
financial statements presented for the company for 2016, 2017 and 2018. The various
ratios for 2017 and 2018 have already been computed based on the given financial
statements. This report would focus on the interpretation of the obtained numbers with
regards to key aspects related to the business.
Ratio Analysis
Profitability
It is apparent that at the gross level the profitability of the company has improved by 113
basis points in 2018 as compared to the previous year. However, the same has not been
reflected in the operating margins which have undergone a significant contraction in 2018
owing to the jump in selling and administrative expenses. As a result, there has been a
decline in the net profit after tax by about $ 10,000 in 2018. This has led to drop in ROE in
2018 coupled with increased equity. However, there is a marginal improvement in ROCE
owing to decline in capital employed (Petty et. al., 2015).
Efficiency
The operational efficiency is reflected from the various turnover ratios. The inventory
turnover for 2018 has increased by about six days over the corresponding level in 2017.
This does not auger well for the company since this leads to a higher cash cycle and
thereby enhancing the working capital requirements. The receivables turnover has also
increased in 2018 by about five days which implies that the business takes higher days to
realise cash from the credit sales leading to higher working capital requirements. The
payables turnover has also increased in 2018 by about six days which provides some relief
to the business as this is positive for the company owing to higher credit period being
available from suppliers (Northington, 2015).
Liquidity
For financial year 2018, there has been a drop in both current ratio and acid test ratio
which may be attributed to the significant jump in current liabilities which is higher than
the comparative increase in current assets. As a result, there has been deterioration in the
short term liquidity position of the company. However, considering the fact that the
Document Page
current ratio is close to 2 and acid test ratio exceeds 1, the company is comfortable with
regards short term liquidity (Brealey, Myers and Allen, 2014).
Gearing
Owing to decrease in the operating profits on account of higher operating expense, the
interest coverage ratio has witnessed a decline in 2018 as compared to the previous year.
However, despite the decline the interest coverage ratio remains healthy for the company
and does not pose any immediate threat. With regards to the gearing ratio, there is a small
drop only owing to increase in the total shareholders’ equity as the end of financial year
2018. However, the long term debt remains the same for both years under consideration
(Parrino and Kidwell, 2014).
Document Page
References
Brealey, R. A., Myers, S. C., and Allen, F. (2014) Principles of corporate finance, 2nd ed.
New York: McGraw-Hill Inc.
Damodaran, A. (2015). Applied corporate finance: A user’s manual 3rd ed. New York:
Wiley, John & Sons.
Northington, S. (2015) Finance, 4th ed. New York: Ferguson
Parrino, R. and Kidwell, D. (2014) Fundamentals of Corporate Finance, 3rd ed. London:
Wiley Publications
Petty, J.W., Titman, S., Keown, A., Martin, J.D., Martin, P., Burrow, M., and Nguyen, H.
(2015). Financial Management, Principles and Applications, 6th ed.. NSW: Pearson Education,
French Forest Australia.
chevron_up_icon
1 out of 7
circle_padding
hide_on_mobile
zoom_out_icon
logo.png

Your All-in-One AI-Powered Toolkit for Academic Success.

Available 24*7 on WhatsApp / Email

[object Object]