Financial Analysis and Ratio Calculations: ACC00724 Assignment 2
VerifiedAdded on 2022/11/18
|7
|1252
|208
Homework Assignment
AI Summary
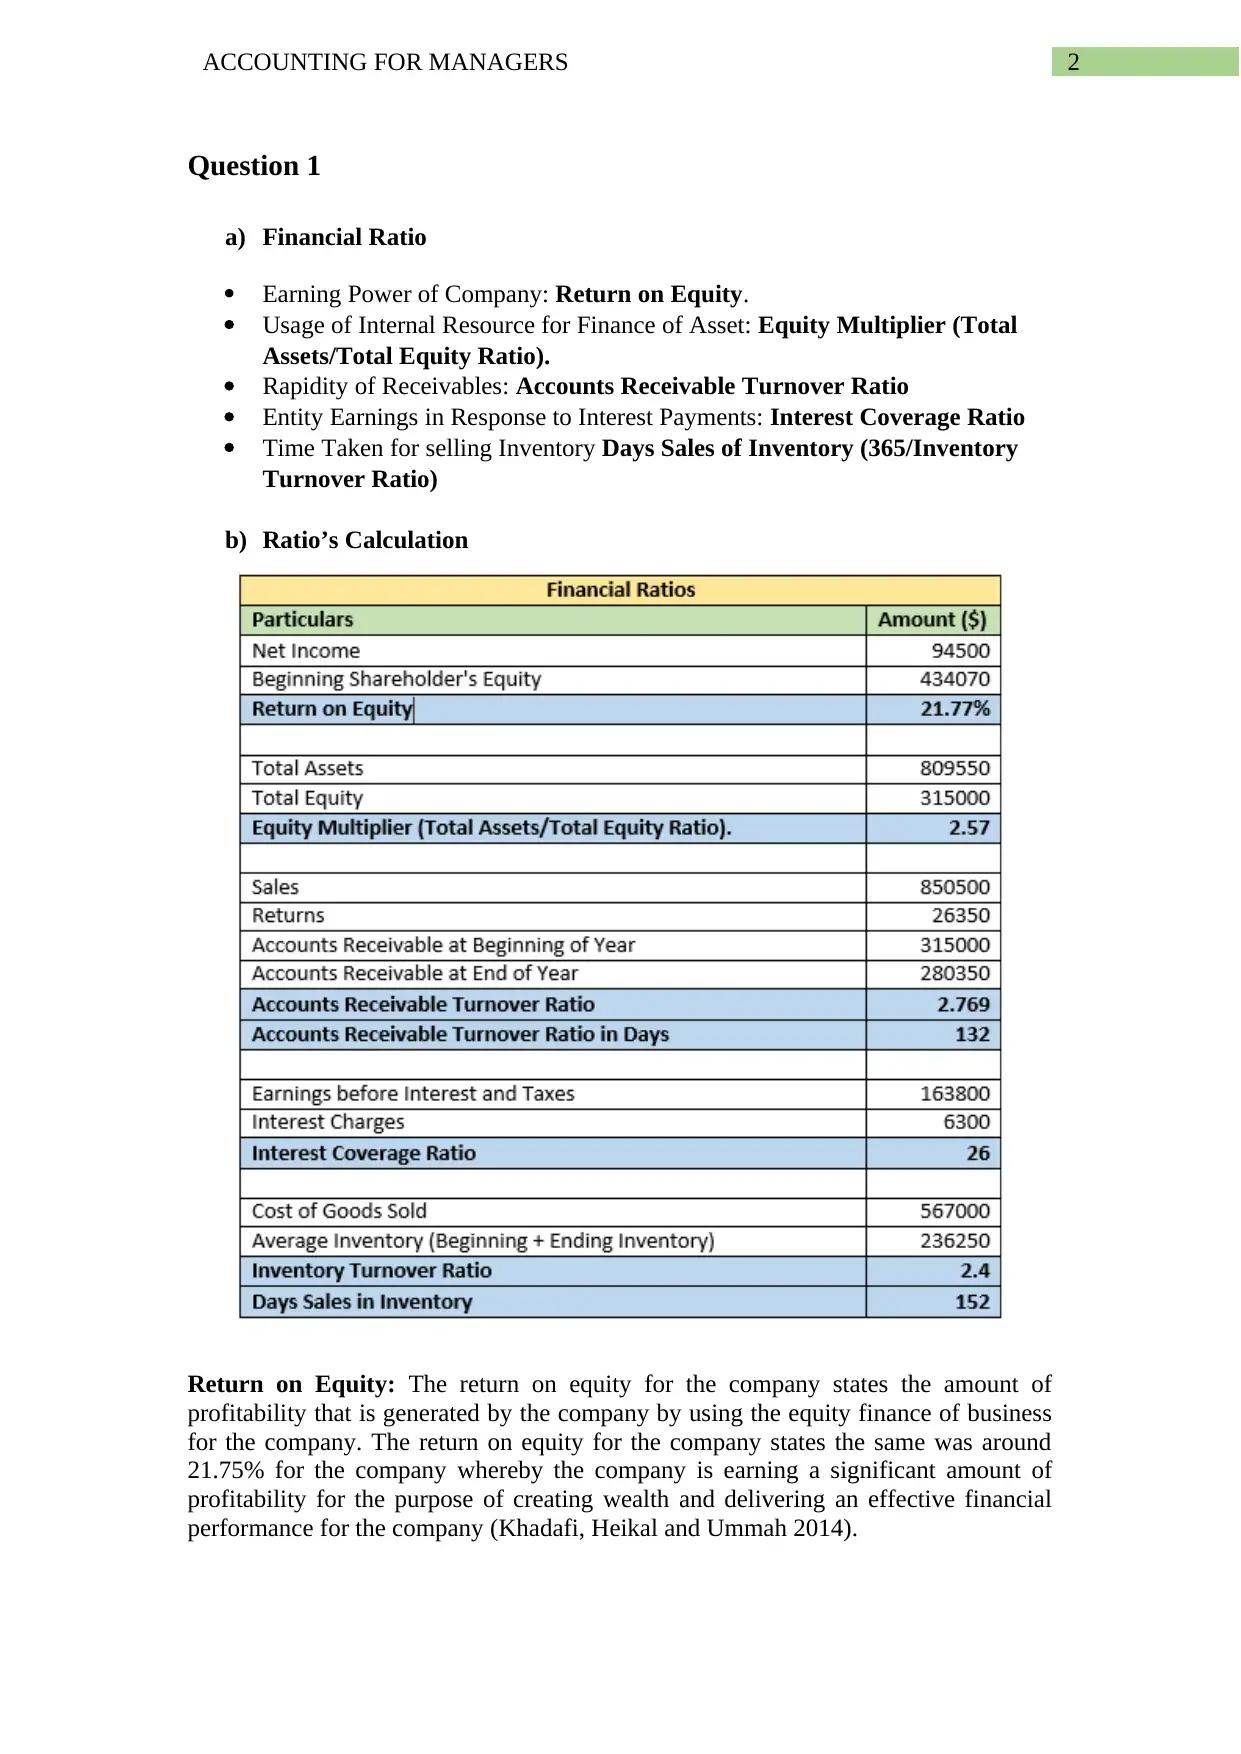
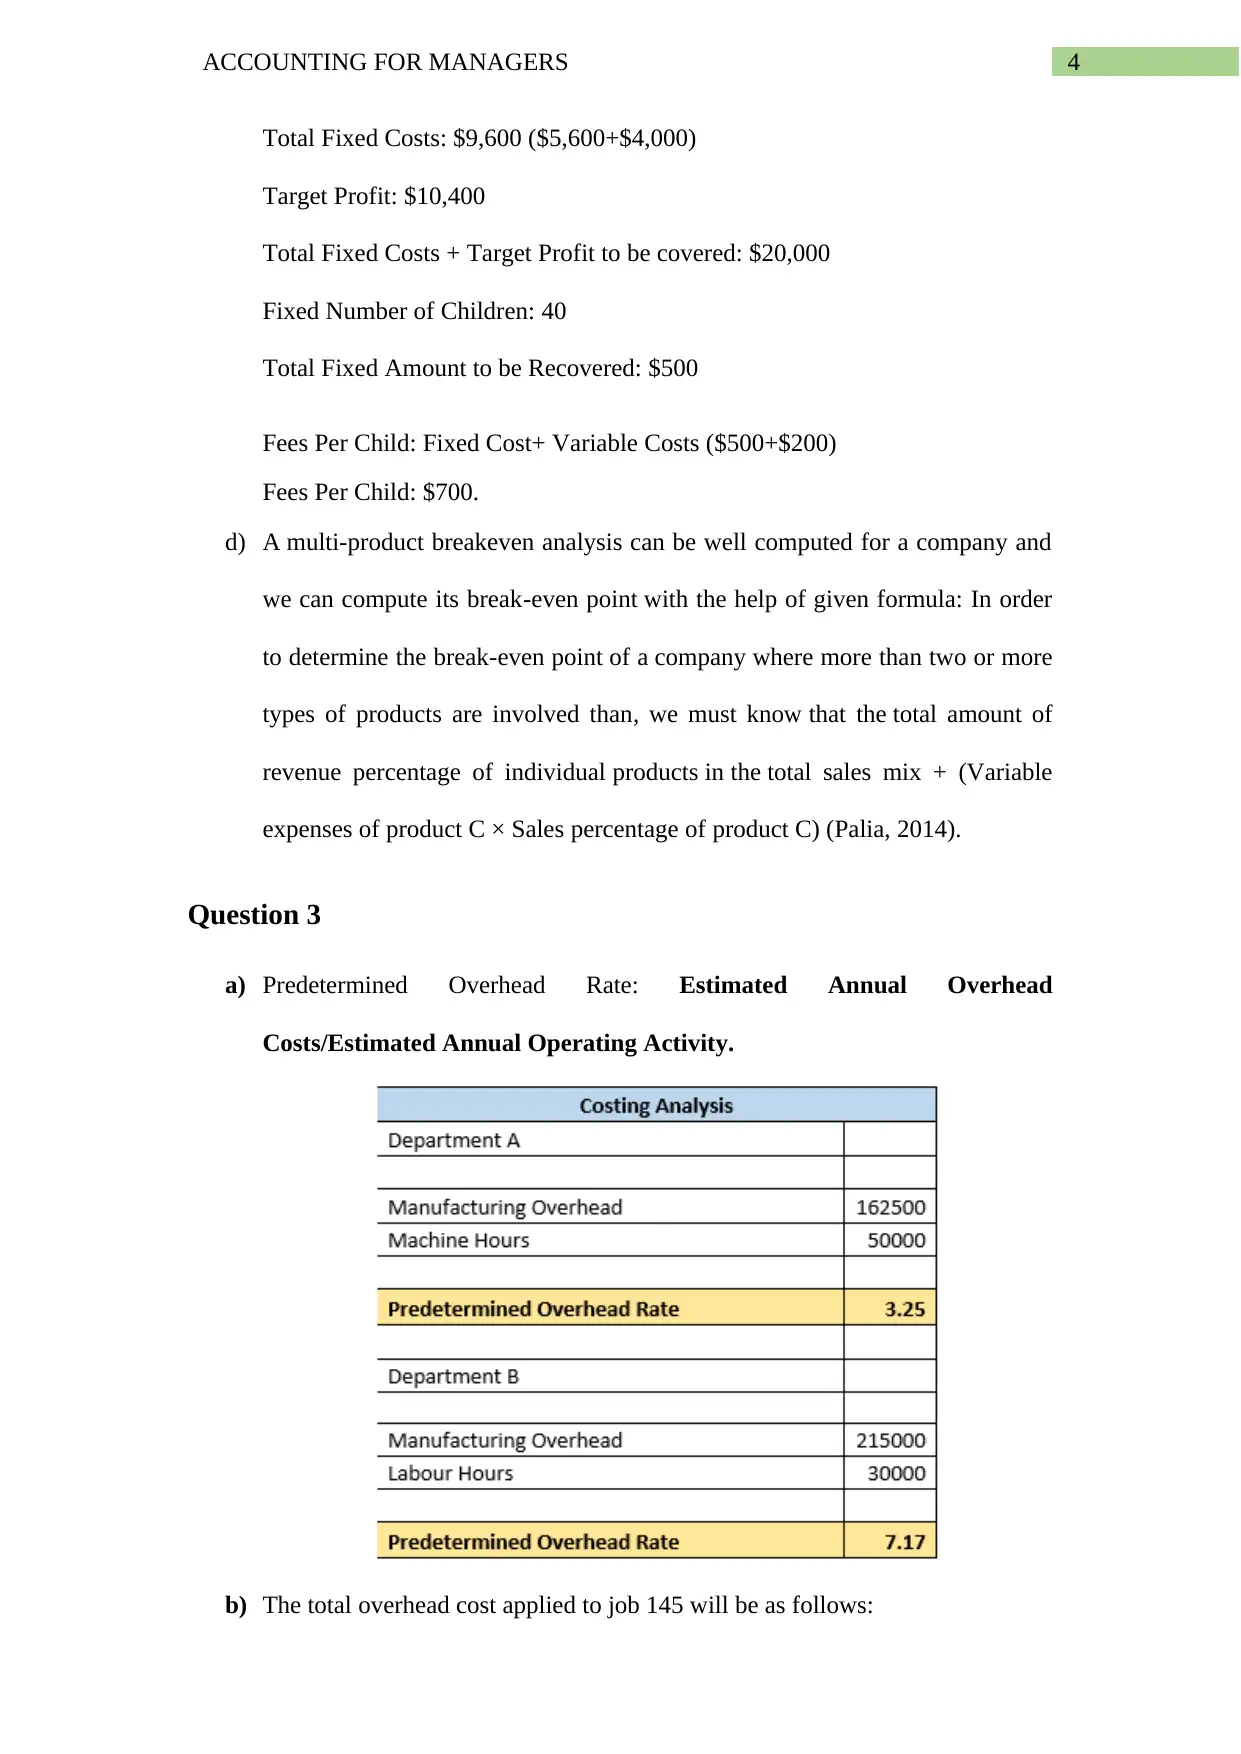
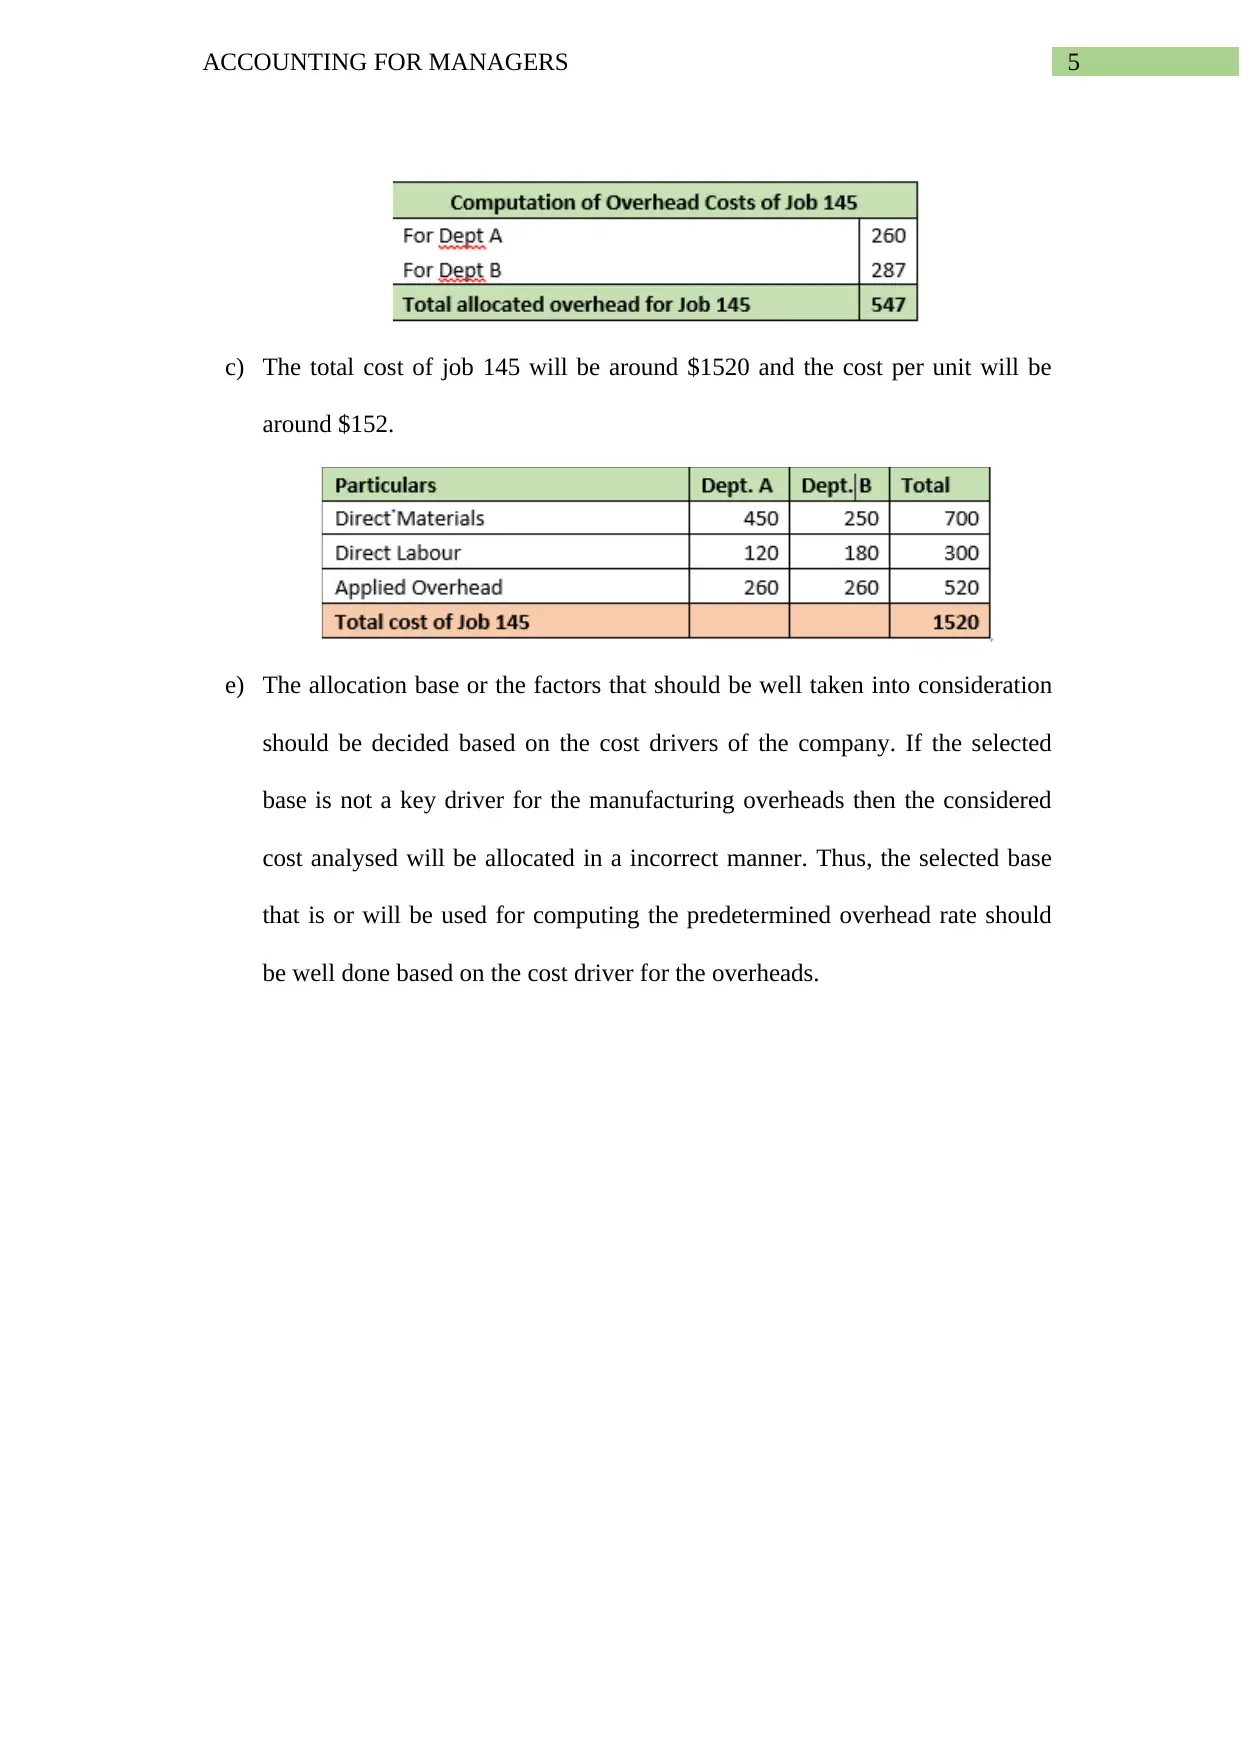
This document presents a comprehensive solution to Assignment 2 in Accounting for Managers (ACC00724), focusing on financial statement analysis. The assignment encompasses the calculation and interpretation of various financial ratios, including Return on Equity, Equity Multiplier, Accounts Receivable Turnover, Interest Coverage, and Inventory Turnover, to assess a company's earning power, resource utilization, and operational efficiency. It further delves into break-even analysis, calculating the break-even point, determining target profit enrollment, and exploring multi-product break-even scenarios. Additionally, the solution covers predetermined overhead rate calculations, overhead allocation to jobs, and the factors influencing the selection of an allocation base. The assignment provides detailed calculations, interpretations, and discussions, offering a robust understanding of key accounting concepts and their practical application in financial management.

0ACCOUNTING FOR MANAGERS
SOUTHERN CROSS UNIVERSITY
ASSIGNMENT COVER SHEET
For use with online submission of assignments
Please complete all of the following details and then make this sheet the first
page of each file of your assignment – do not send it as a separate
document.
Your assignments must be submitted as either Word documents, text documents
with .rtf extension or as .pdf documents. If you wish to submit in any other file
format please discuss this with your lecturer well before the assignment submission
date.
Student Name: Muddasani Rahul
Student ID No.: 23201284
Unit Name: Corporate Governance
Unit Code: Acc03043
Tutor’s name: Shagun khemka
Assignment No.: 2
Assignment Title:
Due date:
Date submitted:
Declaration:
I have read and understand the Rules Relating to Awards (Rule 3
Section 18 – Academic Misconduct Including Plagiarism) as
contained in the SCU Policy Library. I understand the penalties
that apply for plagiarism and agree to be bound by these rules. The work
I am submitting electronically is entirely my own work.
Signed:
(Muddasani
Rahul)
Date:
Paraphrase This Document
Need a fresh take? Get an instant paraphrase of this document with our AI Paraphraser

1ACCOUNTING FOR MANAGERS
Table of Contents
Question 1......................................................................................................................2
Question 2......................................................................................................................3
Question 3......................................................................................................................4
References......................................................................................................................6

2ACCOUNTING FOR MANAGERS
Question 1
a) Financial Ratio
Earning Power of Company: Return on Equity.
Usage of Internal Resource for Finance of Asset: Equity Multiplier (Total
Assets/Total Equity Ratio).
Rapidity of Receivables: Accounts Receivable Turnover Ratio
Entity Earnings in Response to Interest Payments: Interest Coverage Ratio
Time Taken for selling Inventory Days Sales of Inventory (365/Inventory
Turnover Ratio)
b) Ratio’s Calculation
Return on Equity: The return on equity for the company states the amount of
profitability that is generated by the company by using the equity finance of business
for the company. The return on equity for the company states the same was around
21.75% for the company whereby the company is earning a significant amount of
profitability for the purpose of creating wealth and delivering an effective financial
performance for the company (Khadafi, Heikal and Ummah 2014).
⊘ This is a preview!⊘
Do you want full access?
Subscribe today to unlock all pages.

Trusted by 1+ million students worldwide

3ACCOUNTING FOR MANAGERS
Equity Multiplier: The equity multiplier was around 2.57 times stating that around
39% of the assets are financed by the company with the help of equity financing by
the company.
Accounts Receivable Turnover Ratio: The accounts receivable turnover ratio was
around 2.77 times, stating that the company receives the receivable around 2.77 times
a year or once in every 132 days.
Interest Coverage Ratio: The interest coverage ratio was around 26 times stating
that the company has its earnings 26 times bigger than the finance cost paid by the
company.
Inventory Turnover Ratio: The inventory turnover ratio was around 2.4 times
stating that it takes around 2.4 times or 152 days in converting the inventory into final
sales of the company (Gaur and Kesavan 2015).
c) Profitability can be well evaluated by the Return on Equity which was around
21.75% for the company whereby the company is earning a significant amount of
profitability for the purpose of creating wealth and delivering an effective financial
performance for the company (Delen, Kuzey and Uyar 2013). On the other hand the
net profit margin for the company was also good thereby giving an return of 11.11%.
On the other hand, the liquidity aspects could be well analyzed with the help of
current ratio which was around 1.82 times for the company.
Question 2
a) Break-Even Point: Fixed Costs/(Price- Variable Costs)
Where;
Fixed Costs: $5,600
Price: $600
Variable Costs: $200
Contribution: $400
BEP: 5600/(600-200)
BEP: 14
b) Target Profit: $10,400
Fixed Cost: $5,600
Total Amount to be recovered: $16,000
Contribution: $400
Number of Children that must be enrolled: ($10,400/$400): 40
c) Total Contribution: $400
Paraphrase This Document
Need a fresh take? Get an instant paraphrase of this document with our AI Paraphraser

4ACCOUNTING FOR MANAGERS
Total Fixed Costs: $9,600 ($5,600+$4,000)
Target Profit: $10,400
Total Fixed Costs + Target Profit to be covered: $20,000
Fixed Number of Children: 40
Total Fixed Amount to be Recovered: $500
Fees Per Child: Fixed Cost+ Variable Costs ($500+$200)
Fees Per Child: $700.
d) A multi-product breakeven analysis can be well computed for a company and
we can compute its break-even point with the help of given formula: In order
to determine the break-even point of a company where more than two or more
types of products are involved than, we must know that the total amount of
revenue percentage of individual products in the total sales mix + (Variable
expenses of product C × Sales percentage of product C) (Palia, 2014).
Question 3
a) Predetermined Overhead Rate: Estimated Annual Overhead
Costs/Estimated Annual Operating Activity.
b) The total overhead cost applied to job 145 will be as follows:

5ACCOUNTING FOR MANAGERS
c) The total cost of job 145 will be around $1520 and the cost per unit will be
around $152.
e) The allocation base or the factors that should be well taken into consideration
should be decided based on the cost drivers of the company. If the selected
base is not a key driver for the manufacturing overheads then the considered
cost analysed will be allocated in a incorrect manner. Thus, the selected base
that is or will be used for computing the predetermined overhead rate should
be well done based on the cost driver for the overheads.
⊘ This is a preview!⊘
Do you want full access?
Subscribe today to unlock all pages.

Trusted by 1+ million students worldwide

6ACCOUNTING FOR MANAGERS
References
Khadafi, M., Heikal, M. and Ummah, A., 2014. Influence analysis of return on assets
(ROA), return on equity (ROE), net profit margin (NPM), debt to equity ratio (DER),
and current ratio (CR), against corporate profit growth in automotive in Indonesia
Stock Exchange. International Journal of Academic Research in Business and Social
Sciences, 4(12).
Delen, D., Kuzey, C. and Uyar, A., 2013. Measuring firm performance using financial
ratios: A decision tree approach. Expert Systems with Applications, 40(10), pp.3970-
3983.
Gaur, V. and Kesavan, S., 2015. The effects of firm size and sales growth rate on
inventory turnover performance in the US retail sector. In Retail Supply Chain
Management (pp. 25-52). Springer, Boston, MA.
Palia, A.P., 2014, January. Target profit pricing with the web-based breakeven
analysis package. In Developments in Business Simulation and Experiential Learning:
Proceedings of the Annual ABSEL conference (Vol. 35).
1 out of 7
Related Documents

Your All-in-One AI-Powered Toolkit for Academic Success.
+13062052269
info@desklib.com
Available 24*7 on WhatsApp / Email
Unlock your academic potential
Copyright © 2020–2025 A2Z Services. All Rights Reserved. Developed and managed by ZUCOL.