Financial Capital Analysis and Valuation of Alam.com Venture
VerifiedAdded on  2022/10/17
|8
|1324
|329
Report
AI Summary
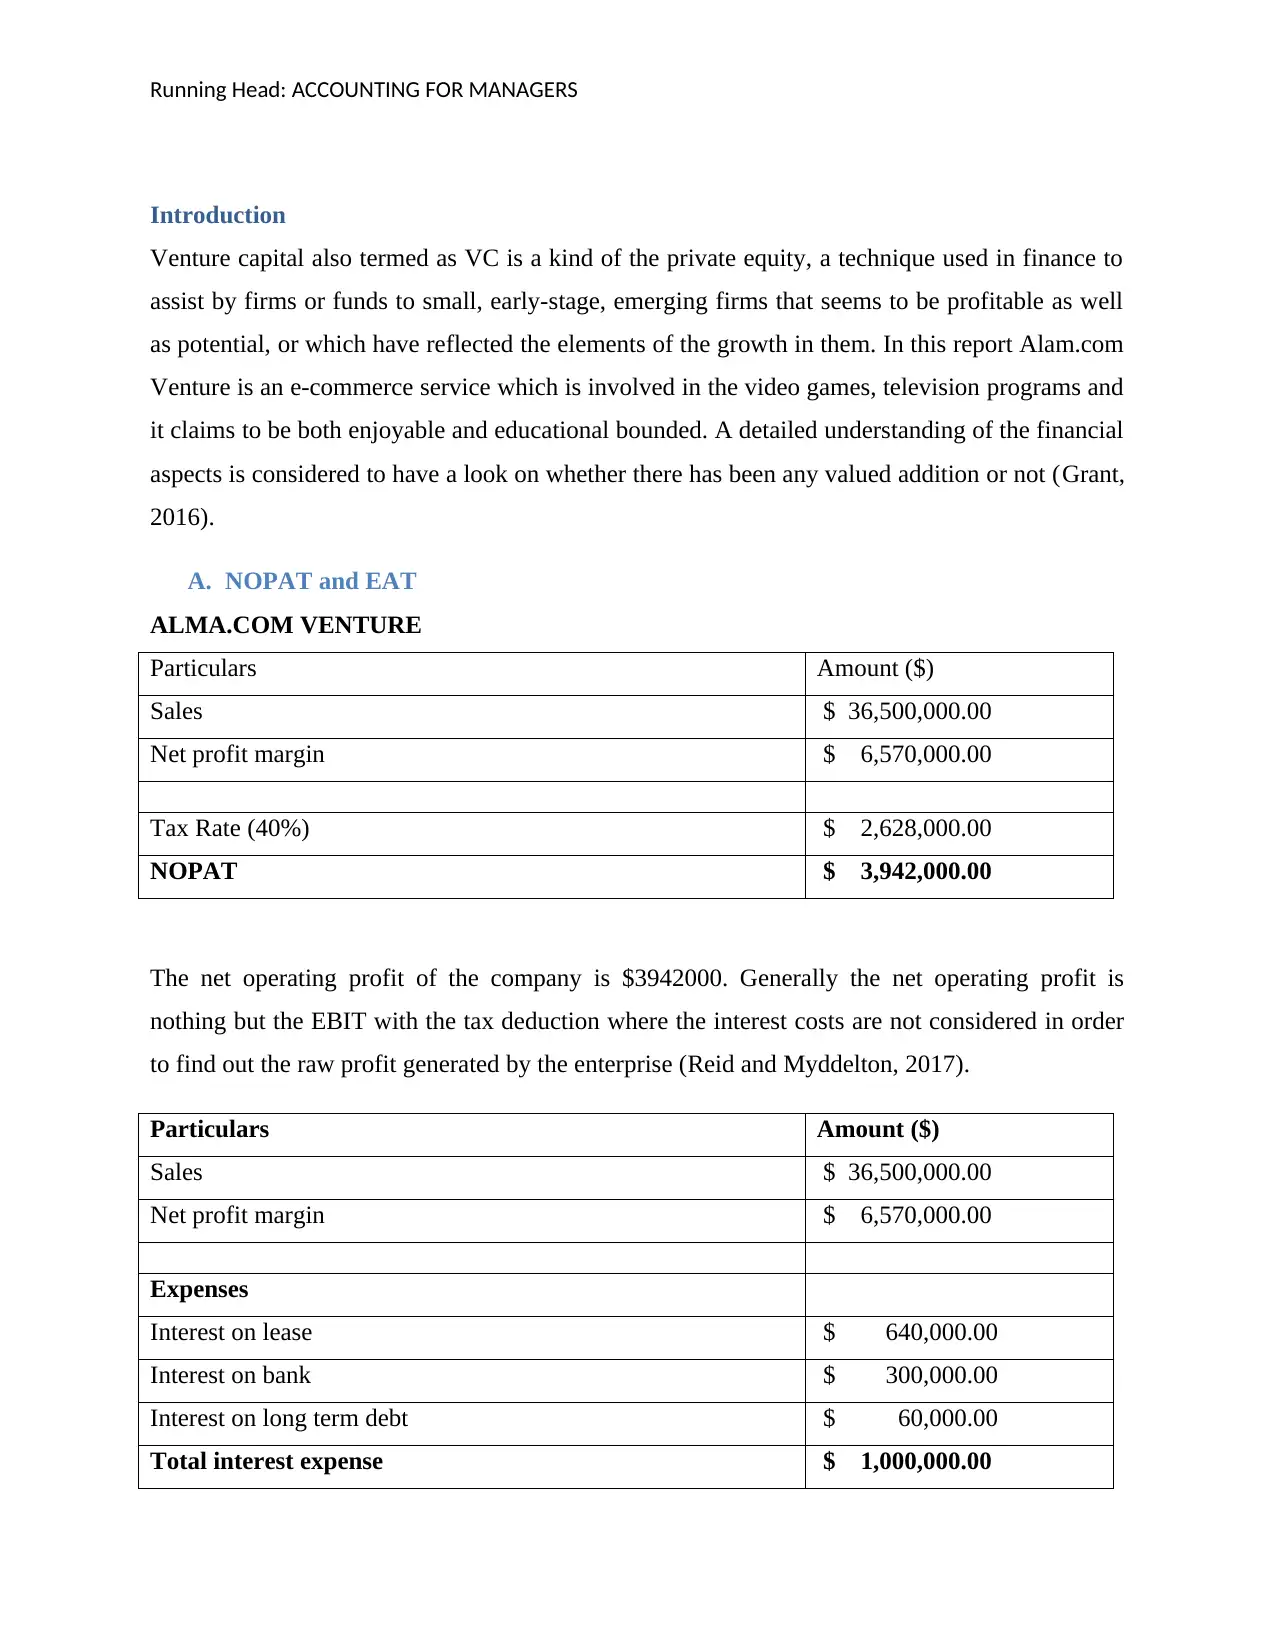
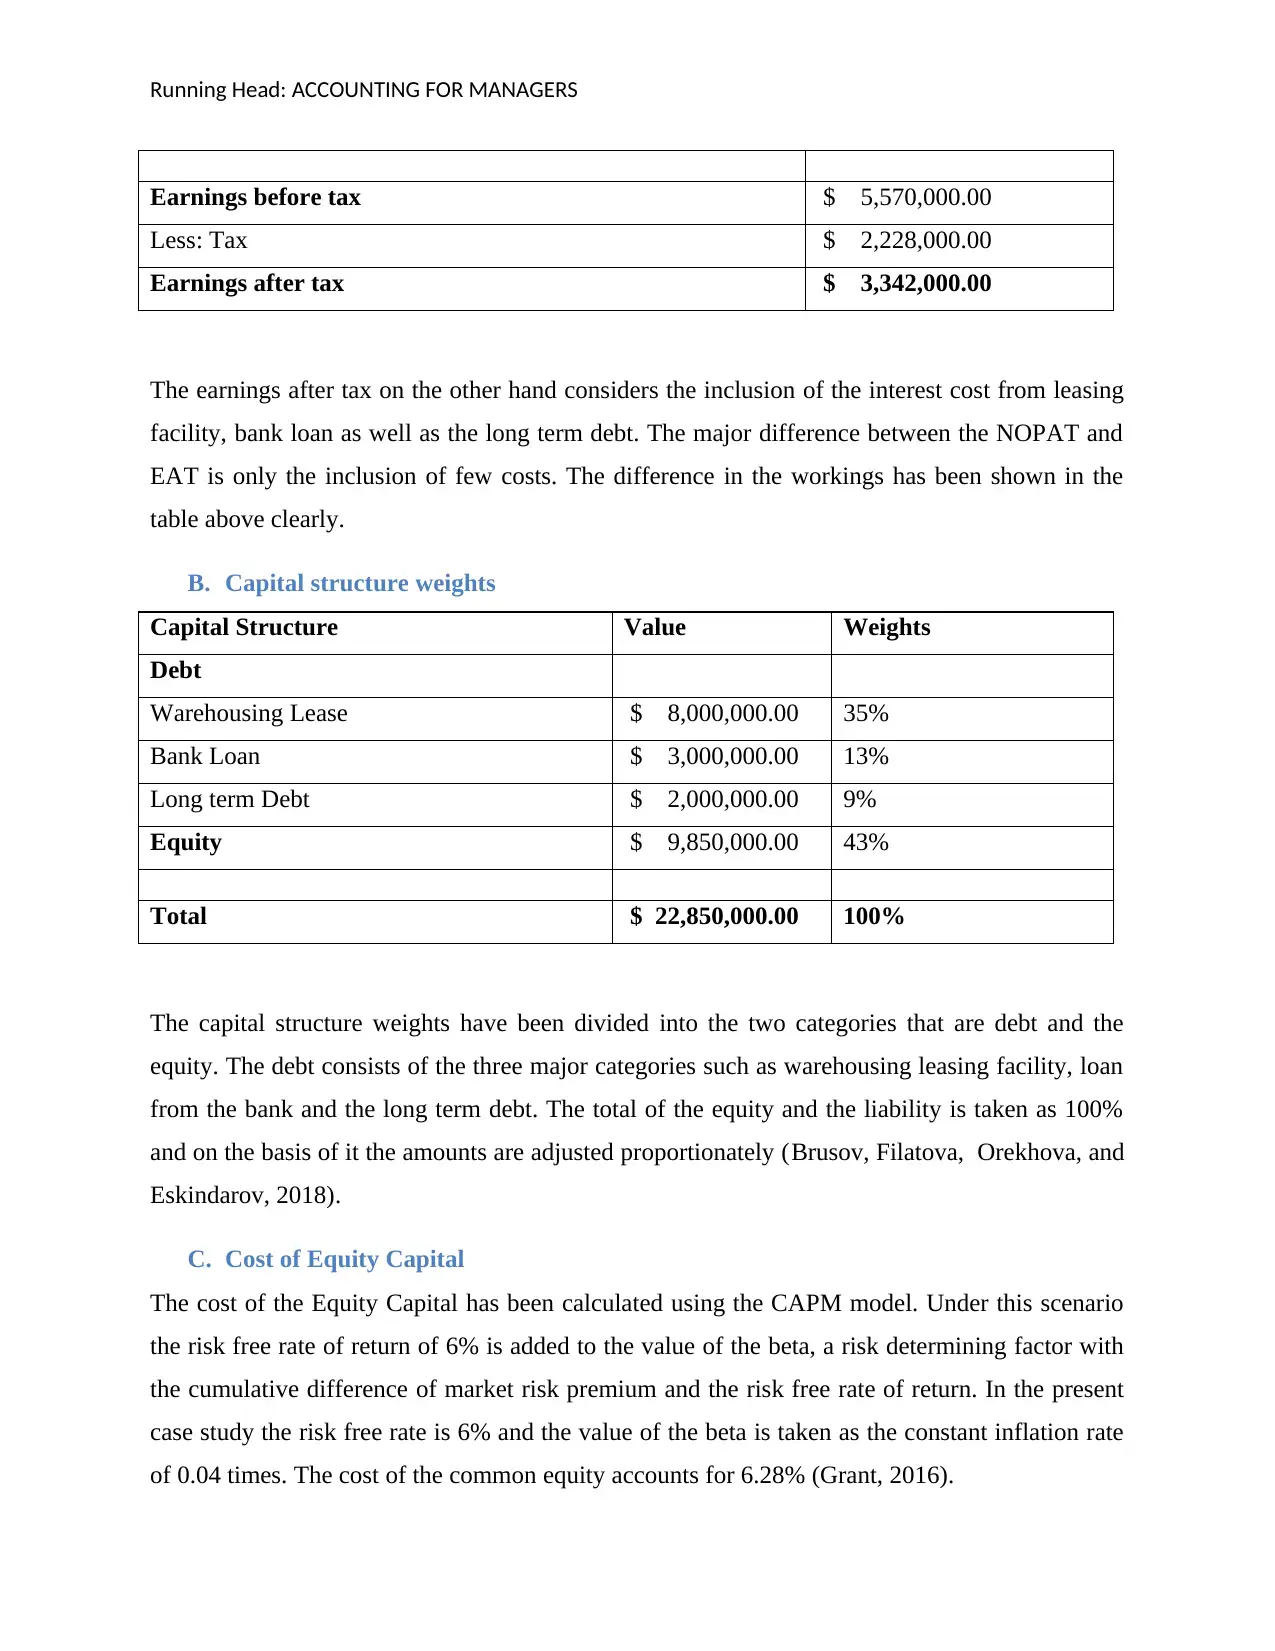
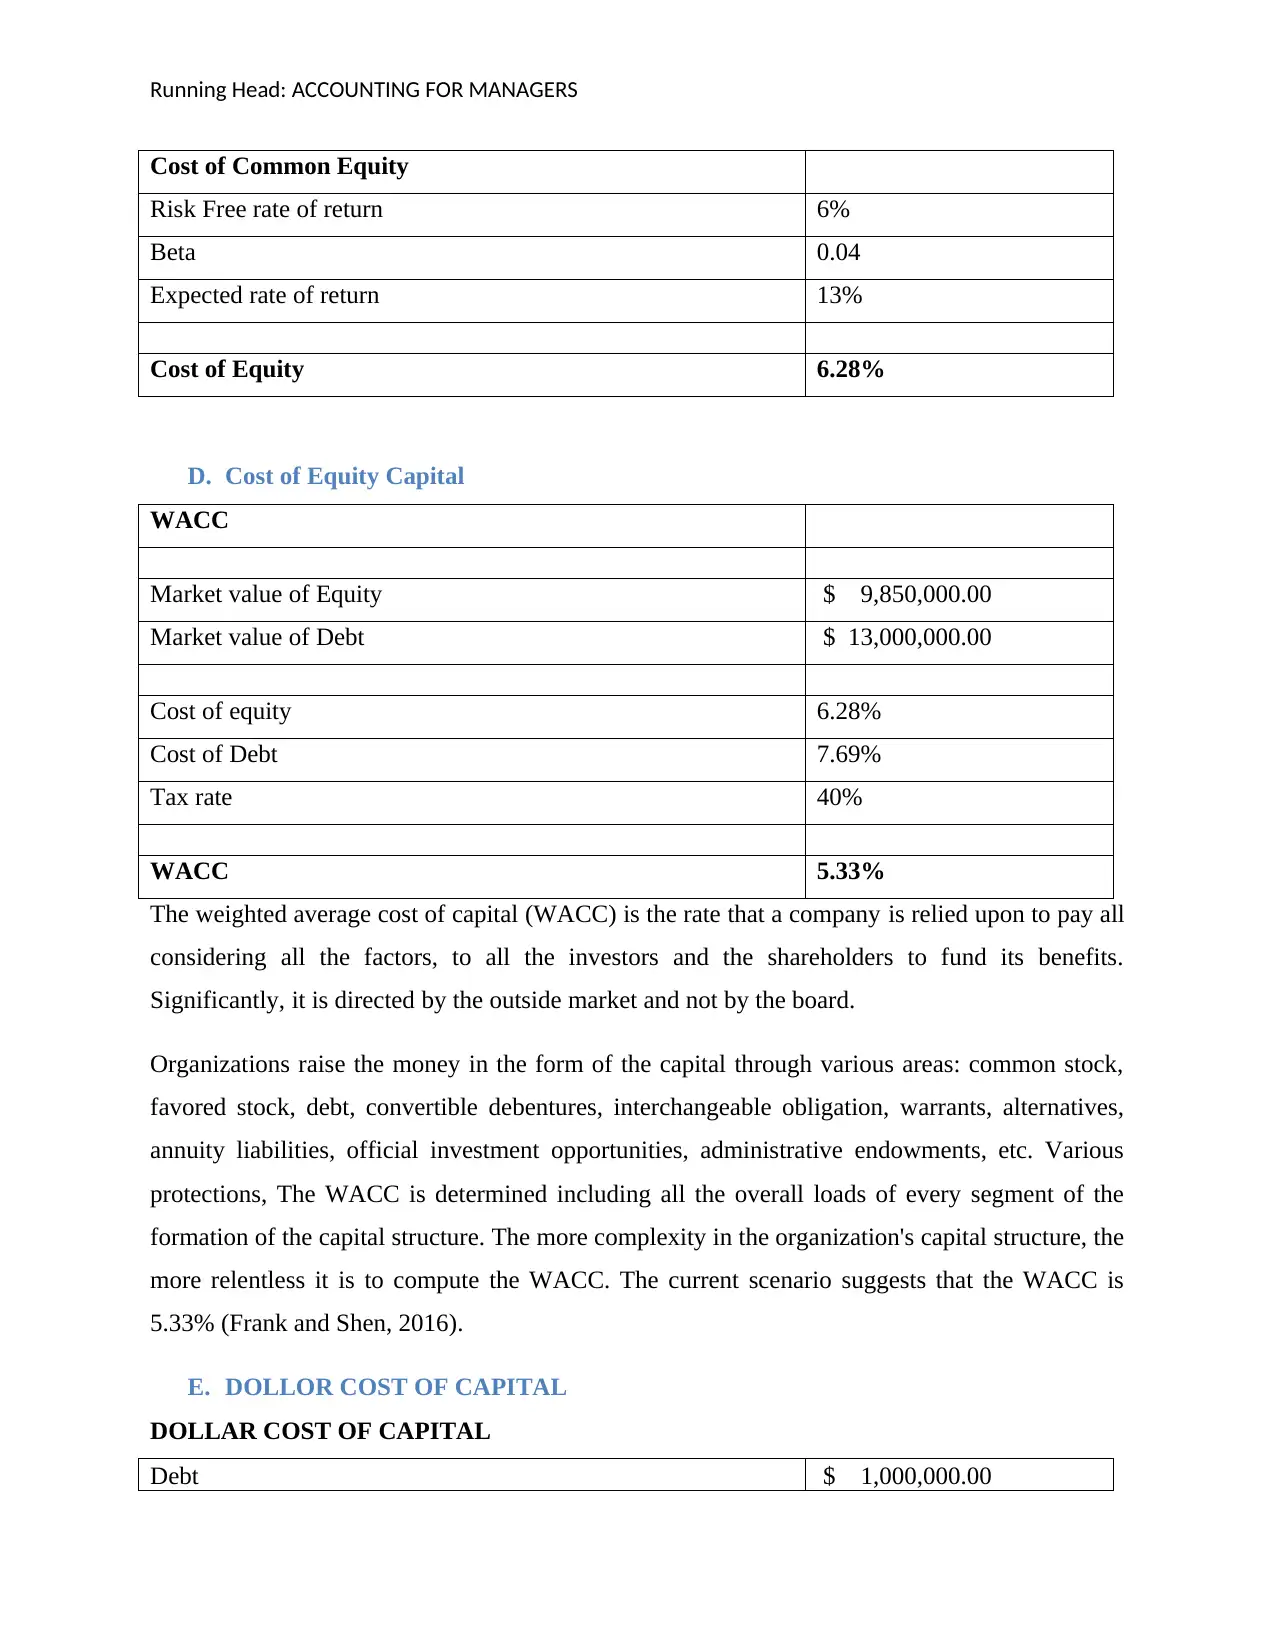
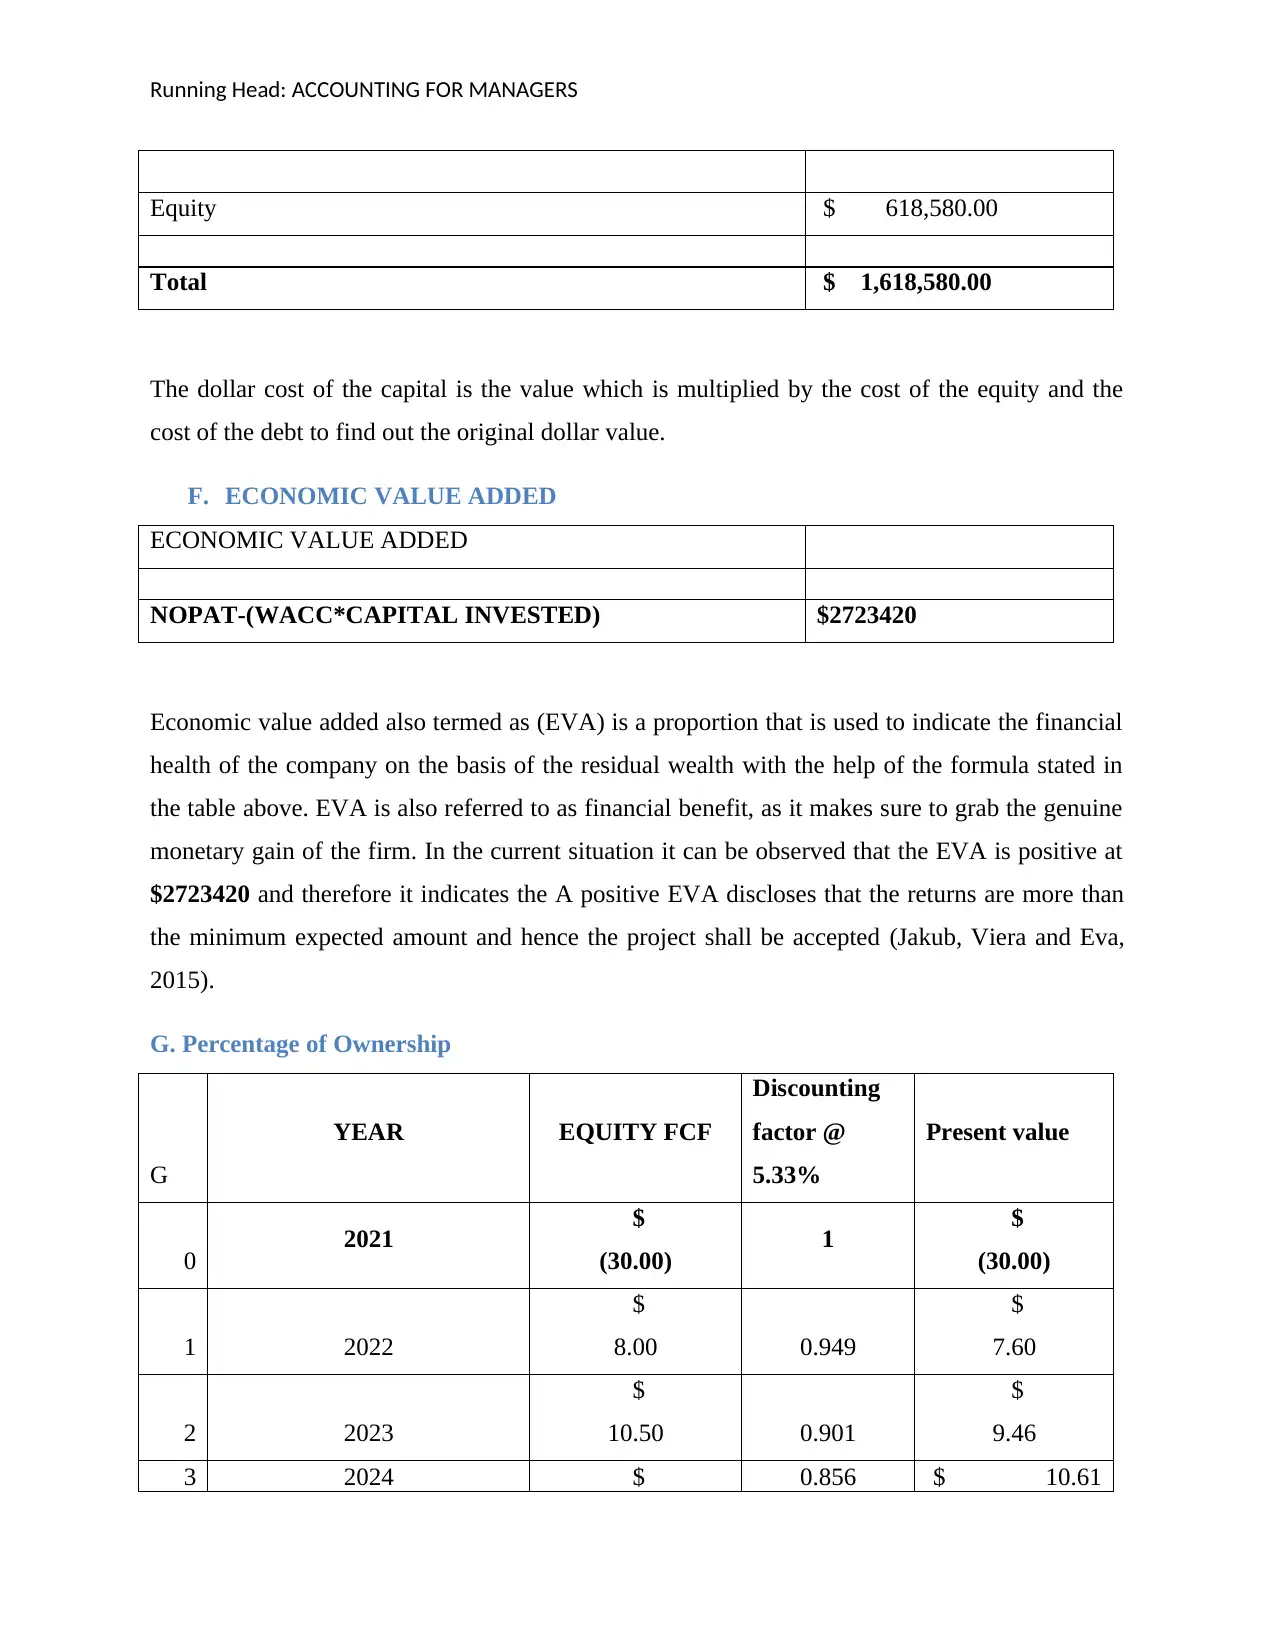
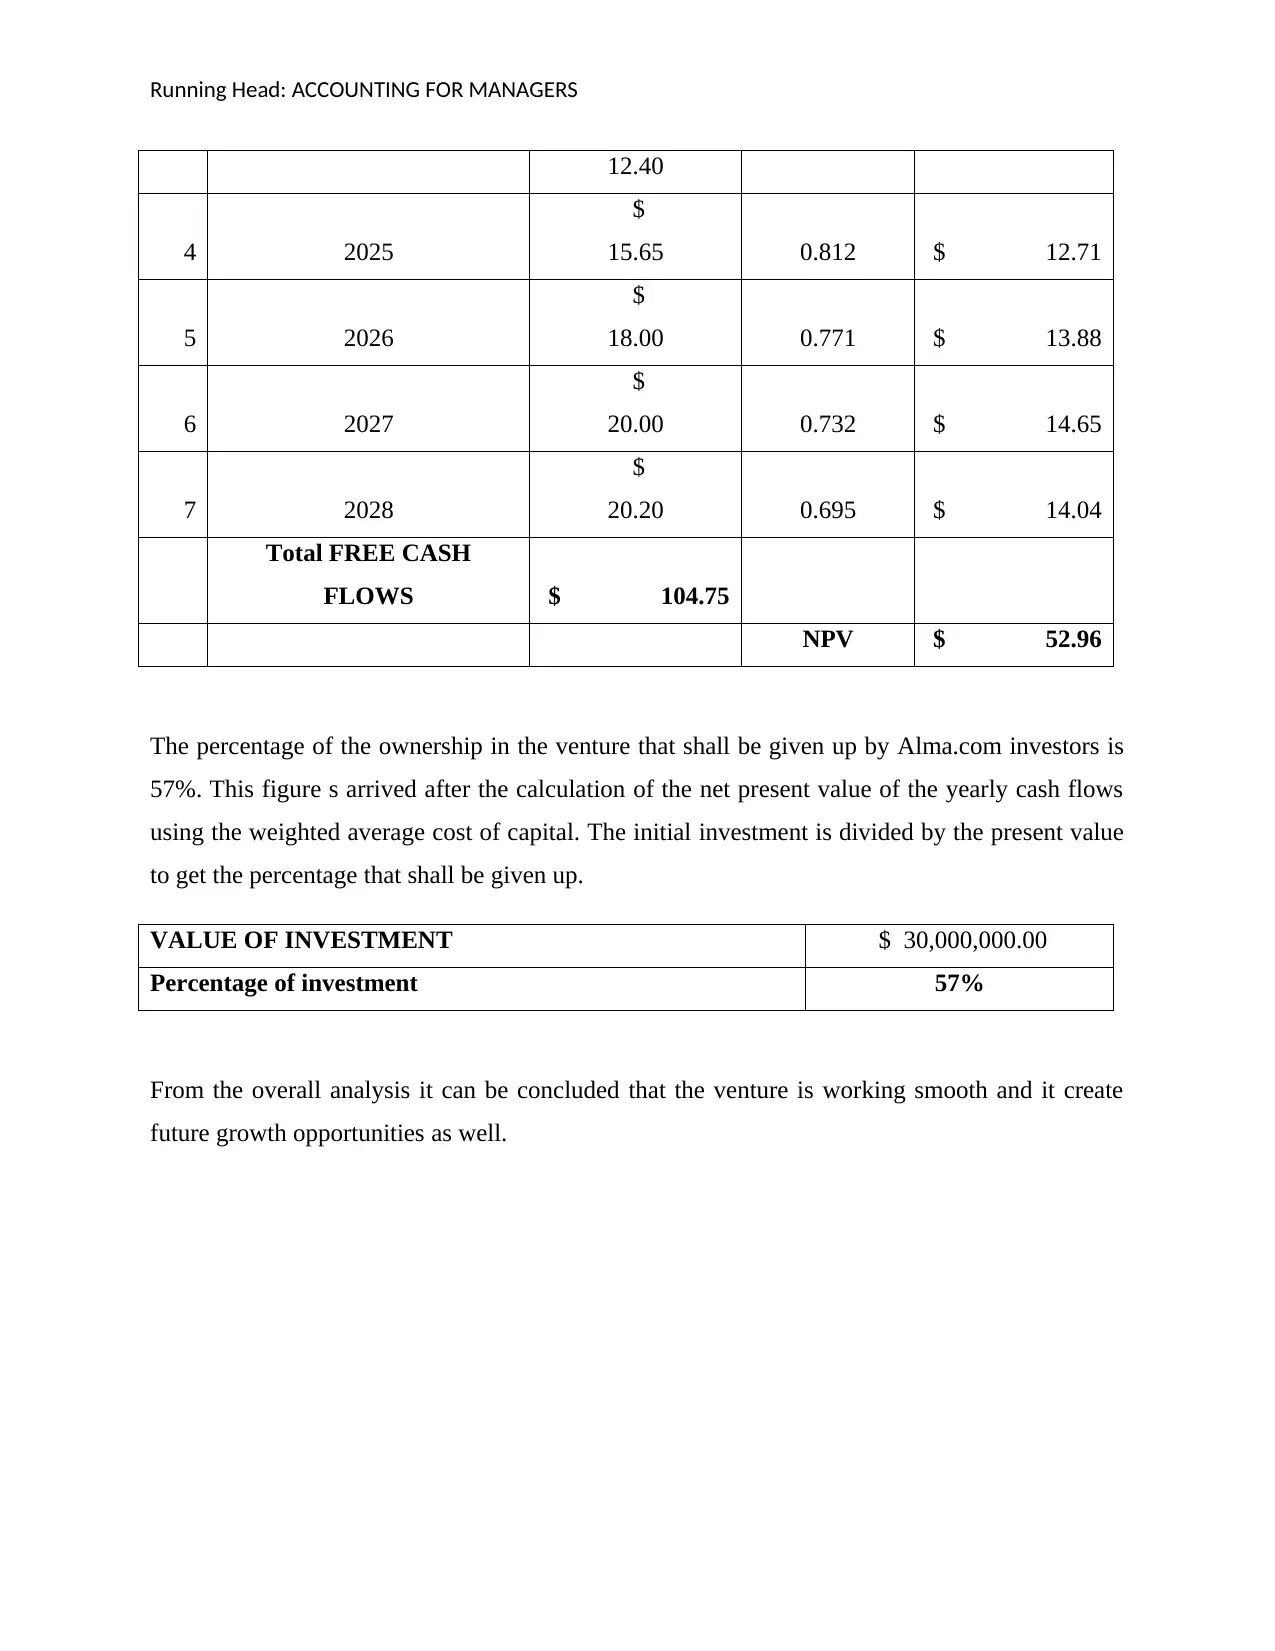
This report analyzes the financial aspects of Alam.com Venture, an e-commerce service involved in video games and television programs. It begins by calculating NOPAT and EAT to assess profitability, considering sales, expenses, and tax rates. The report then delves into capital structure, determining the weights of debt and equity components. The cost of equity capital is calculated using the CAPM model, and the weighted average cost of capital (WACC) is determined to evaluate the overall cost of financing. Furthermore, the report calculates the dollar cost of capital and the economic value added (EVA) to gauge the company's financial health. Finally, it determines the percentage of ownership in the venture that should be given up by investors, based on a net present value analysis of future cash flows. The analysis concludes that the venture is performing well and presents future growth opportunities.

Running Head: ACCOUNTING FOR MANAGERS
ACCOUNTING FOR MANAGERS
Paraphrase This Document
Need a fresh take? Get an instant paraphrase of this document with our AI Paraphraser

Running Head: ACCOUNTING FOR MANAGERS
Table of Contents
Introduction.................................................................................................................................................3
A. NOPAT and EAT............................................................................................................................3
B. Capital structure weights.................................................................................................................4
C. Cost of Equity Capital.....................................................................................................................4
D. Cost of Equity Capital.....................................................................................................................5
E. DOLLOR COST OF CAPITAL......................................................................................................6
F. ECONOMIC VALUE ADDED.......................................................................................................6
G. Percentage of Ownership....................................................................................................................6
References...................................................................................................................................................8

Running Head: ACCOUNTING FOR MANAGERS
Introduction
Venture capital also termed as VC is a kind of the private equity, a technique used in finance to
assist by firms or funds to small, early-stage, emerging firms that seems to be profitable as well
as potential, or which have reflected the elements of the growth in them. In this report Alam.com
Venture is an e-commerce service which is involved in the video games, television programs and
it claims to be both enjoyable and educational bounded. A detailed understanding of the financial
aspects is considered to have a look on whether there has been any valued addition or not (Grant,
2016).
A. NOPAT and EAT
ALMA.COM VENTURE
Particulars Amount ($)
Sales $ 36,500,000.00
Net profit margin $ 6,570,000.00
Tax Rate (40%) $ 2,628,000.00
NOPAT $ 3,942,000.00
The net operating profit of the company is $3942000. Generally the net operating profit is
nothing but the EBIT with the tax deduction where the interest costs are not considered in order
to find out the raw profit generated by the enterprise (Reid and Myddelton, 2017).
Particulars Amount ($)
Sales $ 36,500,000.00
Net profit margin $ 6,570,000.00
Expenses
Interest on lease $ 640,000.00
Interest on bank $ 300,000.00
Interest on long term debt $ 60,000.00
Total interest expense $ 1,000,000.00
⊘ This is a preview!⊘
Do you want full access?
Subscribe today to unlock all pages.

Trusted by 1+ million students worldwide

Running Head: ACCOUNTING FOR MANAGERS
Earnings before tax $ 5,570,000.00
Less: Tax $ 2,228,000.00
Earnings after tax $ 3,342,000.00
The earnings after tax on the other hand considers the inclusion of the interest cost from leasing
facility, bank loan as well as the long term debt. The major difference between the NOPAT and
EAT is only the inclusion of few costs. The difference in the workings has been shown in the
table above clearly.
B. Capital structure weights
Capital Structure Value Weights
Debt
Warehousing Lease $ 8,000,000.00 35%
Bank Loan $ 3,000,000.00 13%
Long term Debt $ 2,000,000.00 9%
Equity $ 9,850,000.00 43%
Total $ 22,850,000.00 100%
The capital structure weights have been divided into the two categories that are debt and the
equity. The debt consists of the three major categories such as warehousing leasing facility, loan
from the bank and the long term debt. The total of the equity and the liability is taken as 100%
and on the basis of it the amounts are adjusted proportionately (Brusov, Filatova, Orekhova, and
Eskindarov, 2018).
C. Cost of Equity Capital
The cost of the Equity Capital has been calculated using the CAPM model. Under this scenario
the risk free rate of return of 6% is added to the value of the beta, a risk determining factor with
the cumulative difference of market risk premium and the risk free rate of return. In the present
case study the risk free rate is 6% and the value of the beta is taken as the constant inflation rate
of 0.04 times. The cost of the common equity accounts for 6.28% (Grant, 2016).
Paraphrase This Document
Need a fresh take? Get an instant paraphrase of this document with our AI Paraphraser

Running Head: ACCOUNTING FOR MANAGERS
Cost of Common Equity
Risk Free rate of return 6%
Beta 0.04
Expected rate of return 13%
Cost of Equity 6.28%
D. Cost of Equity Capital
WACC
Market value of Equity $ 9,850,000.00
Market value of Debt $ 13,000,000.00
Cost of equity 6.28%
Cost of Debt 7.69%
Tax rate 40%
WACC 5.33%
The weighted average cost of capital (WACC) is the rate that a company is relied upon to pay all
considering all the factors, to all the investors and the shareholders to fund its benefits.
Significantly, it is directed by the outside market and not by the board.
Organizations raise the money in the form of the capital through various areas: common stock,
favored stock, debt, convertible debentures, interchangeable obligation, warrants, alternatives,
annuity liabilities, official investment opportunities, administrative endowments, etc. Various
protections, The WACC is determined including all the overall loads of every segment of the
formation of the capital structure. The more complexity in the organization's capital structure, the
more relentless it is to compute the WACC. The current scenario suggests that the WACC is
5.33% (Frank and Shen, 2016).
E. DOLLOR COST OF CAPITAL
DOLLAR COST OF CAPITAL
Debt $ 1,000,000.00

Running Head: ACCOUNTING FOR MANAGERS
Equity $ 618,580.00
Total $ 1,618,580.00
The dollar cost of the capital is the value which is multiplied by the cost of the equity and the
cost of the debt to find out the original dollar value.
F. ECONOMIC VALUE ADDED
ECONOMIC VALUE ADDED
NOPAT-(WACC*CAPITAL INVESTED) $2723420
Economic value added also termed as (EVA) is a proportion that is used to indicate the financial
health of the company on the basis of the residual wealth with the help of the formula stated in
the table above. EVA is also referred to as financial benefit, as it makes sure to grab the genuine
monetary gain of the firm. In the current situation it can be observed that the EVA is positive at
$2723420 and therefore it indicates the A positive EVA discloses that the returns are more than
the minimum expected amount and hence the project shall be accepted (Jakub, Viera and Eva,
2015).
G. Percentage of Ownership
G
YEAR EQUITY FCF
Discounting
factor @
5.33%
Present value
0 2021 $
(30.00) 1 $
(30.00)
1 2022
$
8.00 0.949
$
7.60
2 2023
$
10.50 0.901
$
9.46
3 2024 $ 0.856 $ 10.61
⊘ This is a preview!⊘
Do you want full access?
Subscribe today to unlock all pages.

Trusted by 1+ million students worldwide

Running Head: ACCOUNTING FOR MANAGERS
12.40
4 2025
$
15.65 0.812 $ 12.71
5 2026
$
18.00 0.771 $ 13.88
6 2027
$
20.00 0.732 $ 14.65
7 2028
$
20.20 0.695 $ 14.04
Total FREE CASH
FLOWS $ 104.75
NPV $ 52.96
The percentage of the ownership in the venture that shall be given up by Alma.com investors is
57%. This figure s arrived after the calculation of the net present value of the yearly cash flows
using the weighted average cost of capital. The initial investment is divided by the present value
to get the percentage that shall be given up.
VALUE OF INVESTMENT $ 30,000,000.00
Percentage of investment 57%
From the overall analysis it can be concluded that the venture is working smooth and it create
future growth opportunities as well.
Paraphrase This Document
Need a fresh take? Get an instant paraphrase of this document with our AI Paraphraser

Running Head: ACCOUNTING FOR MANAGERS
References
Brusov, P., Filatova, T., Orekhova, N. and Eskindarov, M., 2018. New meaningful effects in
modern capital structure theory. In Modern Corporate Finance, Investments, Taxation and
Ratings (pp. 537-568). Springer, Cham.
Frank, M.Z. and Shen, T., 2016. Investment and the weighted average cost of capital. Journal of
Financial Economics, 119(2), pp.300-315.
Grant, R.M., 2016. Contemporary strategy analysis: Text and cases edition. John Wiley & Sons.
Jakub, S., Viera, B. and Eva, K., 2015. Economic Value Added as a measurement tool of
financial performance. Procedia Economics and Finance, 26, pp.484-489.
Reid, W. and Myddelton, D.R., 2017. Profit and loss account and balance sheet. In The Meaning
of Company Accounts(pp. 14-14). Routledge.
1 out of 8
Related Documents

Your All-in-One AI-Powered Toolkit for Academic Success.
 +13062052269
info@desklib.com
Available 24*7 on WhatsApp / Email
Unlock your academic potential
Copyright © 2020–2025 A2Z Services. All Rights Reserved. Developed and managed by ZUCOL.