Accounting for Managers: Budgeting, Variance, and Analysis Project
VerifiedAdded on 2020/05/04
|16
|2734
|59
Project
AI Summary
This accounting project for managers presents a detailed analysis of budgeting, variance analysis, and financial statement preparation. It includes a sales budget, production budget, direct material, direct labor, and manufacturing overhead budgets. The project calculates the ending finished goods inventory, cost of goods sold, and prepares a budgeted income statement and cash budget. Part B analyzes the impact of a new facility, while Part C examines sales, material price and usage, direct labor rate and efficiency variances. Part D discusses the implications of imposed versus participative budgetary approaches. The student analyzes the impact of a new facility, and provides detailed calculations and variance analyses to evaluate performance. This project provides a comprehensive overview of financial planning and control, and offers valuable insights into managerial accounting practices.
Running head: ACCOUNTING FOR MANAGERS
Accounting for Managers
Student’s Name:
University Name:
Author Note
Accounting for Managers
Student’s Name:
University Name:
Author Note
Paraphrase This Document
Need a fresh take? Get an instant paraphrase of this document with our AI Paraphraser
1
ACCOUNTING FOR MANAGERS
Table of Contents
Part A.........................................................................................................................................2
Answer to Part a.....................................................................................................................2
Answer to Part b.....................................................................................................................2
Answer to Part c.....................................................................................................................2
Answer to Part d.....................................................................................................................3
Answer to Part e.....................................................................................................................4
Answer to Part f.....................................................................................................................4
Answer to Part g.....................................................................................................................5
Answer to Part h.....................................................................................................................6
Answer to Part i......................................................................................................................6
Workings................................................................................................................................7
Part B..........................................................................................................................................8
Part C..........................................................................................................................................9
Part D.......................................................................................................................................12
Reference & Bibliography:......................................................................................................13
2
ACCOUNTING FOR MANAGERS
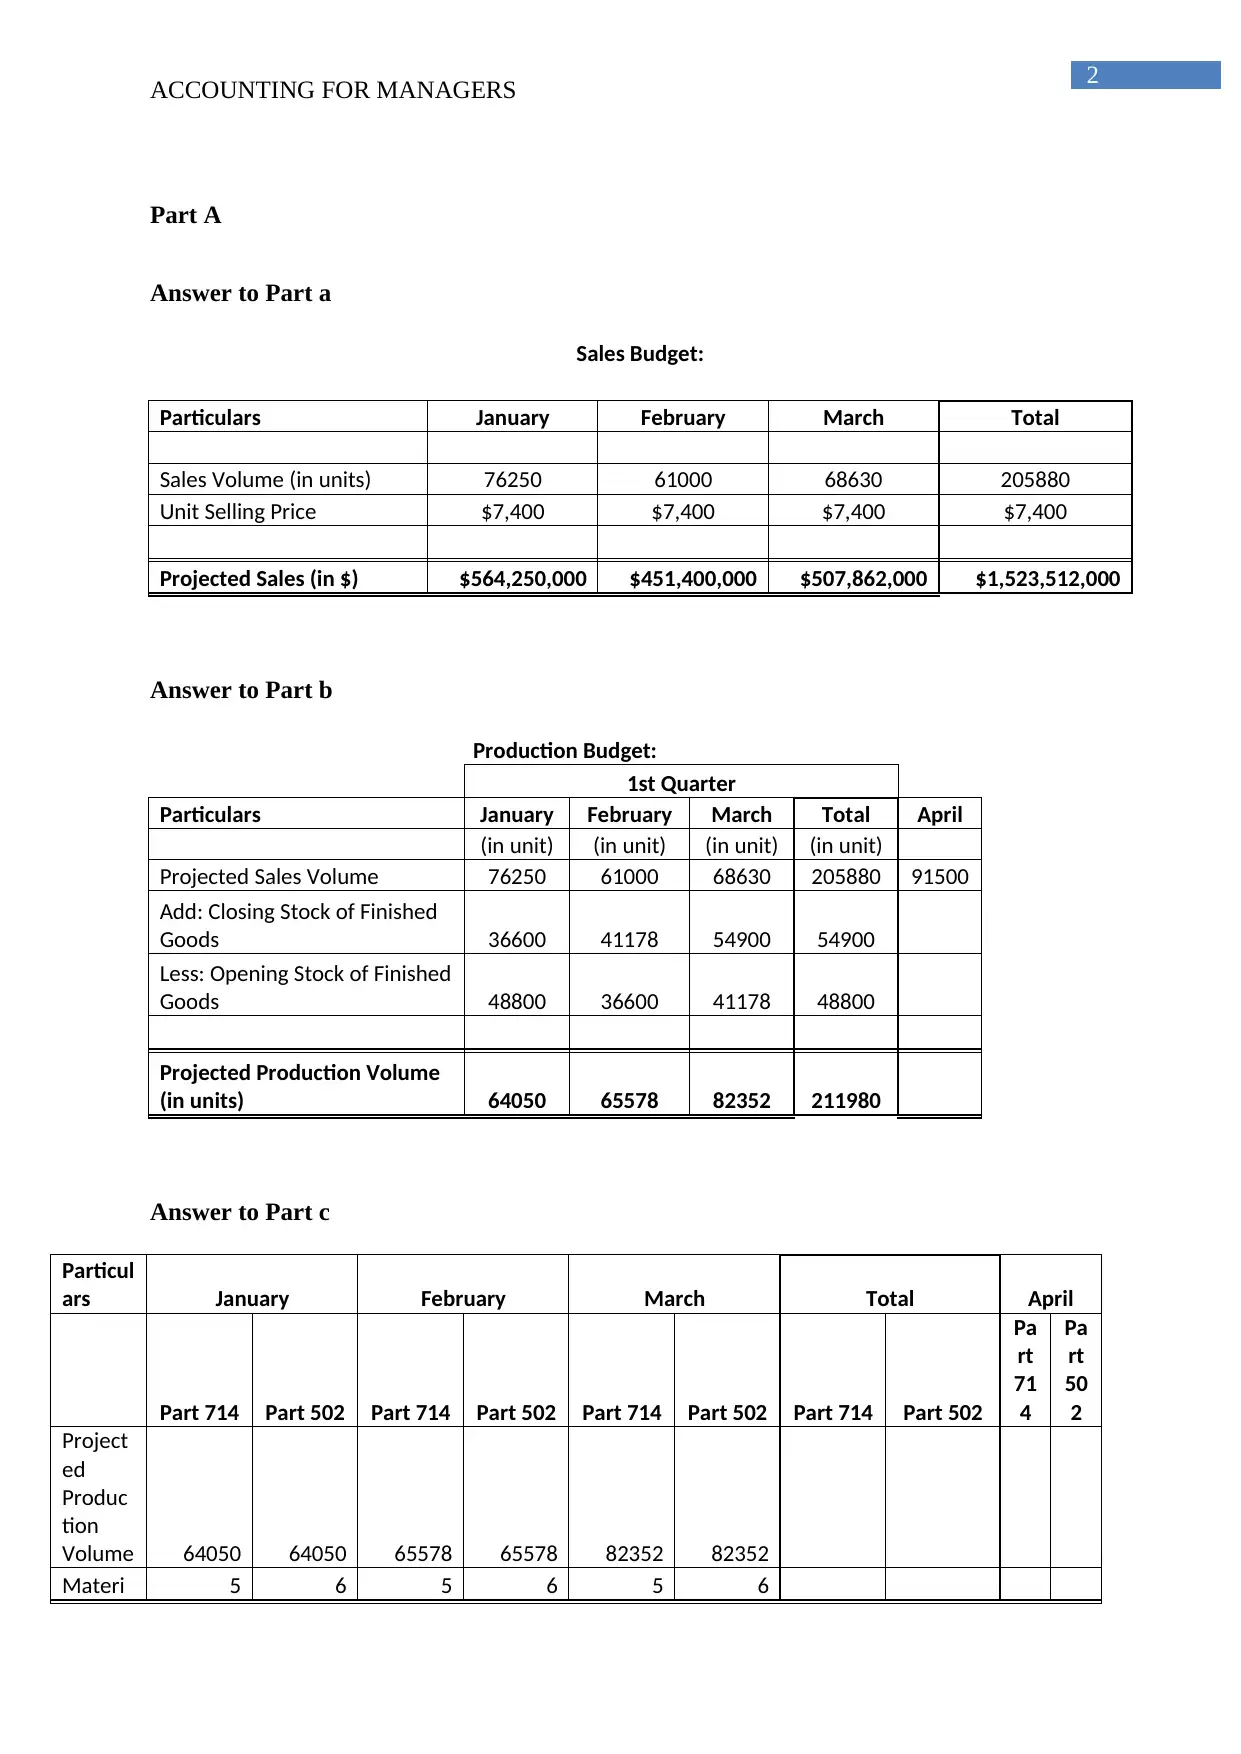
Part A
Answer to Part a
Sales Budget:
Particulars January February March Total
Sales Volume (in units) 76250 61000 68630 205880
Unit Selling Price $7,400 $7,400 $7,400 $7,400
Projected Sales (in $) $564,250,000 $451,400,000 $507,862,000 $1,523,512,000
Answer to Part b
Production Budget:
1st Quarter
Particulars January February March Total April
(in unit) (in unit) (in unit) (in unit)
Projected Sales Volume 76250 61000 68630 205880 91500
Add: Closing Stock of Finished
Goods 36600 41178 54900 54900
Less: Opening Stock of Finished
Goods 48800 36600 41178 48800
Projected Production Volume
(in units) 64050 65578 82352 211980
Answer to Part c
Particul
ars January February March Total April
Part 714 Part 502 Part 714 Part 502 Part 714 Part 502 Part 714 Part 502
Pa
rt
71
4
Pa
rt
50
2
Project
ed
Produc
tion
Volume 64050 64050 65578 65578 82352 82352
Materi 5 6 5 6 5 6
ACCOUNTING FOR MANAGERS
Part A
Answer to Part a
Sales Budget:
Particulars January February March Total
Sales Volume (in units) 76250 61000 68630 205880
Unit Selling Price $7,400 $7,400 $7,400 $7,400
Projected Sales (in $) $564,250,000 $451,400,000 $507,862,000 $1,523,512,000
Answer to Part b
Production Budget:
1st Quarter
Particulars January February March Total April
(in unit) (in unit) (in unit) (in unit)
Projected Sales Volume 76250 61000 68630 205880 91500
Add: Closing Stock of Finished
Goods 36600 41178 54900 54900
Less: Opening Stock of Finished
Goods 48800 36600 41178 48800
Projected Production Volume
(in units) 64050 65578 82352 211980
Answer to Part c
Particul
ars January February March Total April
Part 714 Part 502 Part 714 Part 502 Part 714 Part 502 Part 714 Part 502
Pa
rt
71
4
Pa
rt
50
2
Project
ed
Produc
tion
Volume 64050 64050 65578 65578 82352 82352
Materi 5 6 5 6 5 6
⊘ This is a preview!⊘
Do you want full access?
Subscribe today to unlock all pages.
Trusted by 1+ million students worldwide
3
ACCOUNTING FOR MANAGERS
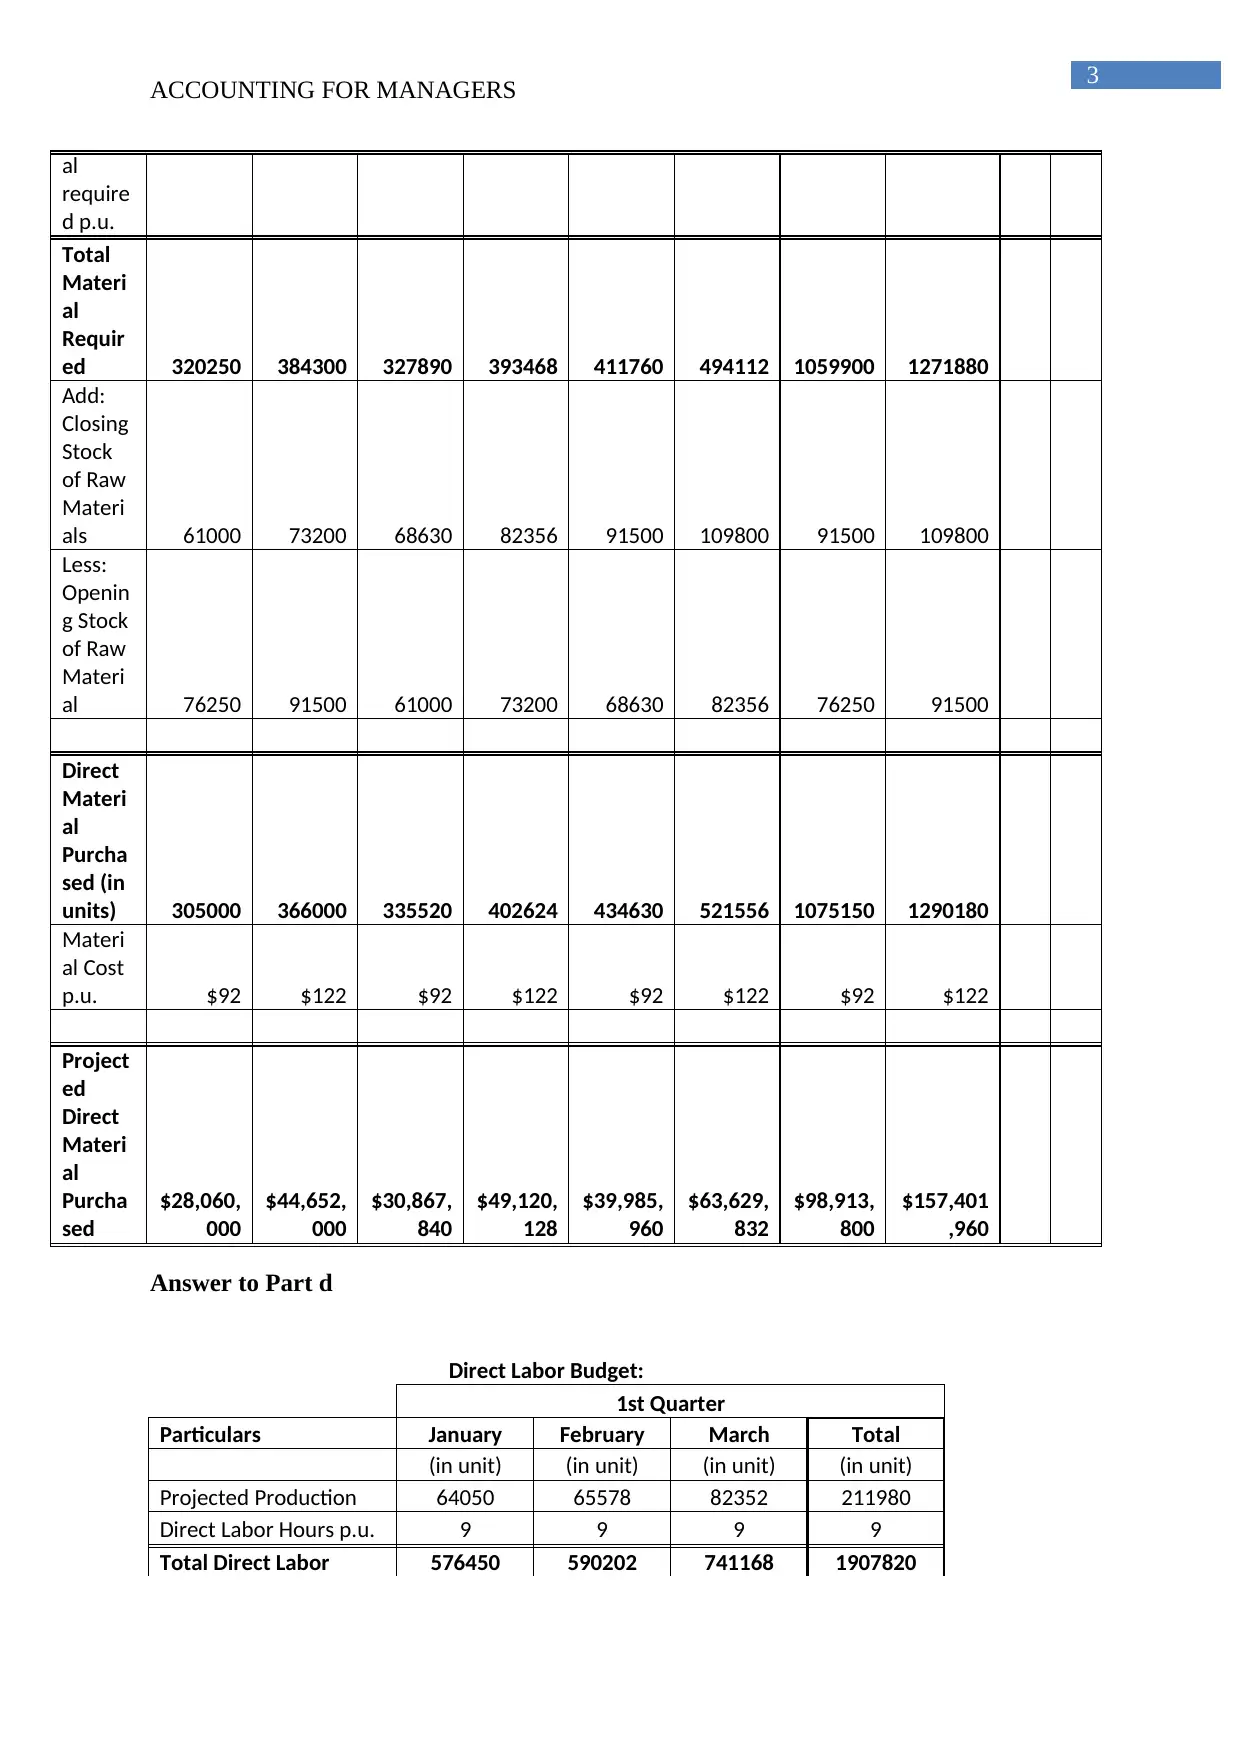
al
require
d p.u.
Total
Materi
al
Requir
ed 320250 384300 327890 393468 411760 494112 1059900 1271880
Add:
Closing
Stock
of Raw
Materi
als 61000 73200 68630 82356 91500 109800 91500 109800
Less:
Openin
g Stock
of Raw
Materi
al 76250 91500 61000 73200 68630 82356 76250 91500
Direct
Materi
al
Purcha
sed (in
units) 305000 366000 335520 402624 434630 521556 1075150 1290180
Materi
al Cost
p.u. $92 $122 $92 $122 $92 $122 $92 $122
Project
ed
Direct
Materi
al
Purcha
sed
$28,060,
000
$44,652,
000
$30,867,
840
$49,120,
128
$39,985,
960
$63,629,
832
$98,913,
800
$157,401
,960
Answer to Part d
Direct Labor Budget:
1st Quarter
Particulars January February March Total
(in unit) (in unit) (in unit) (in unit)
Projected Production 64050 65578 82352 211980
Direct Labor Hours p.u. 9 9 9 9
Total Direct Labor 576450 590202 741168 1907820
ACCOUNTING FOR MANAGERS
al
require
d p.u.
Total
Materi
al
Requir
ed 320250 384300 327890 393468 411760 494112 1059900 1271880
Add:
Closing
Stock
of Raw
Materi
als 61000 73200 68630 82356 91500 109800 91500 109800
Less:
Openin
g Stock
of Raw
Materi
al 76250 91500 61000 73200 68630 82356 76250 91500
Direct
Materi
al
Purcha
sed (in
units) 305000 366000 335520 402624 434630 521556 1075150 1290180
Materi
al Cost
p.u. $92 $122 $92 $122 $92 $122 $92 $122
Project
ed
Direct
Materi
al
Purcha
sed
$28,060,
000
$44,652,
000
$30,867,
840
$49,120,
128
$39,985,
960
$63,629,
832
$98,913,
800
$157,401
,960
Answer to Part d
Direct Labor Budget:
1st Quarter
Particulars January February March Total
(in unit) (in unit) (in unit) (in unit)
Projected Production 64050 65578 82352 211980
Direct Labor Hours p.u. 9 9 9 9
Total Direct Labor 576450 590202 741168 1907820
Paraphrase This Document
Need a fresh take? Get an instant paraphrase of this document with our AI Paraphraser
4
ACCOUNTING FOR MANAGERS
Hours
Direct Labor Cost per
hour $50 $50 $50 $50
Budgeted Direct Labor
Cost
$28,822,50
0
$29,510,10
0
$37,058,40
0
$95,391,00
0
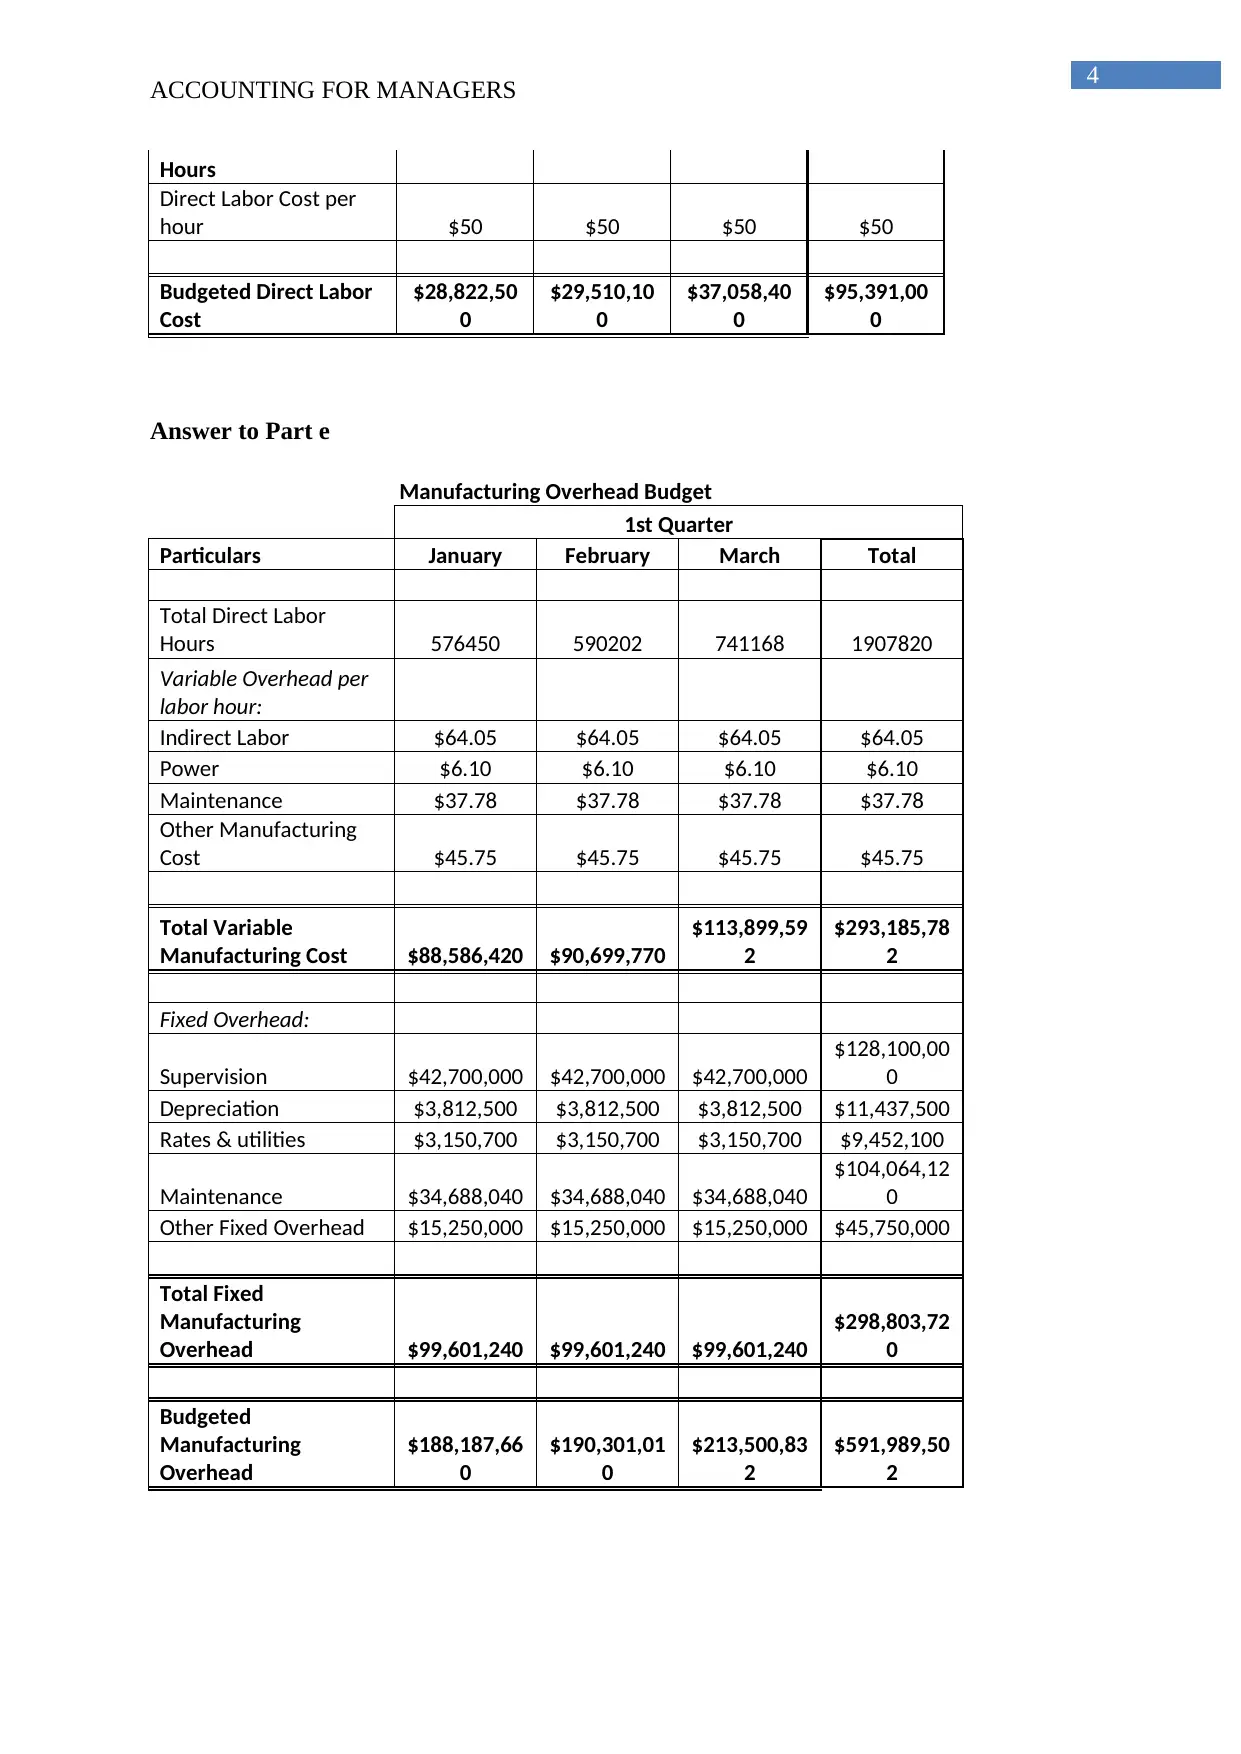
Answer to Part e
Manufacturing Overhead Budget
1st Quarter
Particulars January February March Total
Total Direct Labor
Hours 576450 590202 741168 1907820
Variable Overhead per
labor hour:
Indirect Labor $64.05 $64.05 $64.05 $64.05
Power $6.10 $6.10 $6.10 $6.10
Maintenance $37.78 $37.78 $37.78 $37.78
Other Manufacturing
Cost $45.75 $45.75 $45.75 $45.75
Total Variable
Manufacturing Cost $88,586,420 $90,699,770
$113,899,59
2
$293,185,78
2
Fixed Overhead:
Supervision $42,700,000 $42,700,000 $42,700,000
$128,100,00
0
Depreciation $3,812,500 $3,812,500 $3,812,500 $11,437,500
Rates & utilities $3,150,700 $3,150,700 $3,150,700 $9,452,100
Maintenance $34,688,040 $34,688,040 $34,688,040
$104,064,12
0
Other Fixed Overhead $15,250,000 $15,250,000 $15,250,000 $45,750,000
Total Fixed
Manufacturing
Overhead $99,601,240 $99,601,240 $99,601,240
$298,803,72
0
Budgeted
Manufacturing
Overhead
$188,187,66
0
$190,301,01
0
$213,500,83
2
$591,989,50
2
ACCOUNTING FOR MANAGERS
Hours
Direct Labor Cost per
hour $50 $50 $50 $50
Budgeted Direct Labor
Cost
$28,822,50
0
$29,510,10
0
$37,058,40
0
$95,391,00
0
Answer to Part e
Manufacturing Overhead Budget
1st Quarter
Particulars January February March Total
Total Direct Labor
Hours 576450 590202 741168 1907820
Variable Overhead per
labor hour:
Indirect Labor $64.05 $64.05 $64.05 $64.05
Power $6.10 $6.10 $6.10 $6.10
Maintenance $37.78 $37.78 $37.78 $37.78
Other Manufacturing
Cost $45.75 $45.75 $45.75 $45.75
Total Variable
Manufacturing Cost $88,586,420 $90,699,770
$113,899,59
2
$293,185,78
2
Fixed Overhead:
Supervision $42,700,000 $42,700,000 $42,700,000
$128,100,00
0
Depreciation $3,812,500 $3,812,500 $3,812,500 $11,437,500
Rates & utilities $3,150,700 $3,150,700 $3,150,700 $9,452,100
Maintenance $34,688,040 $34,688,040 $34,688,040
$104,064,12
0
Other Fixed Overhead $15,250,000 $15,250,000 $15,250,000 $45,750,000
Total Fixed
Manufacturing
Overhead $99,601,240 $99,601,240 $99,601,240
$298,803,72
0
Budgeted
Manufacturing
Overhead
$188,187,66
0
$190,301,01
0
$213,500,83
2
$591,989,50
2
5
ACCOUNTING FOR MANAGERS
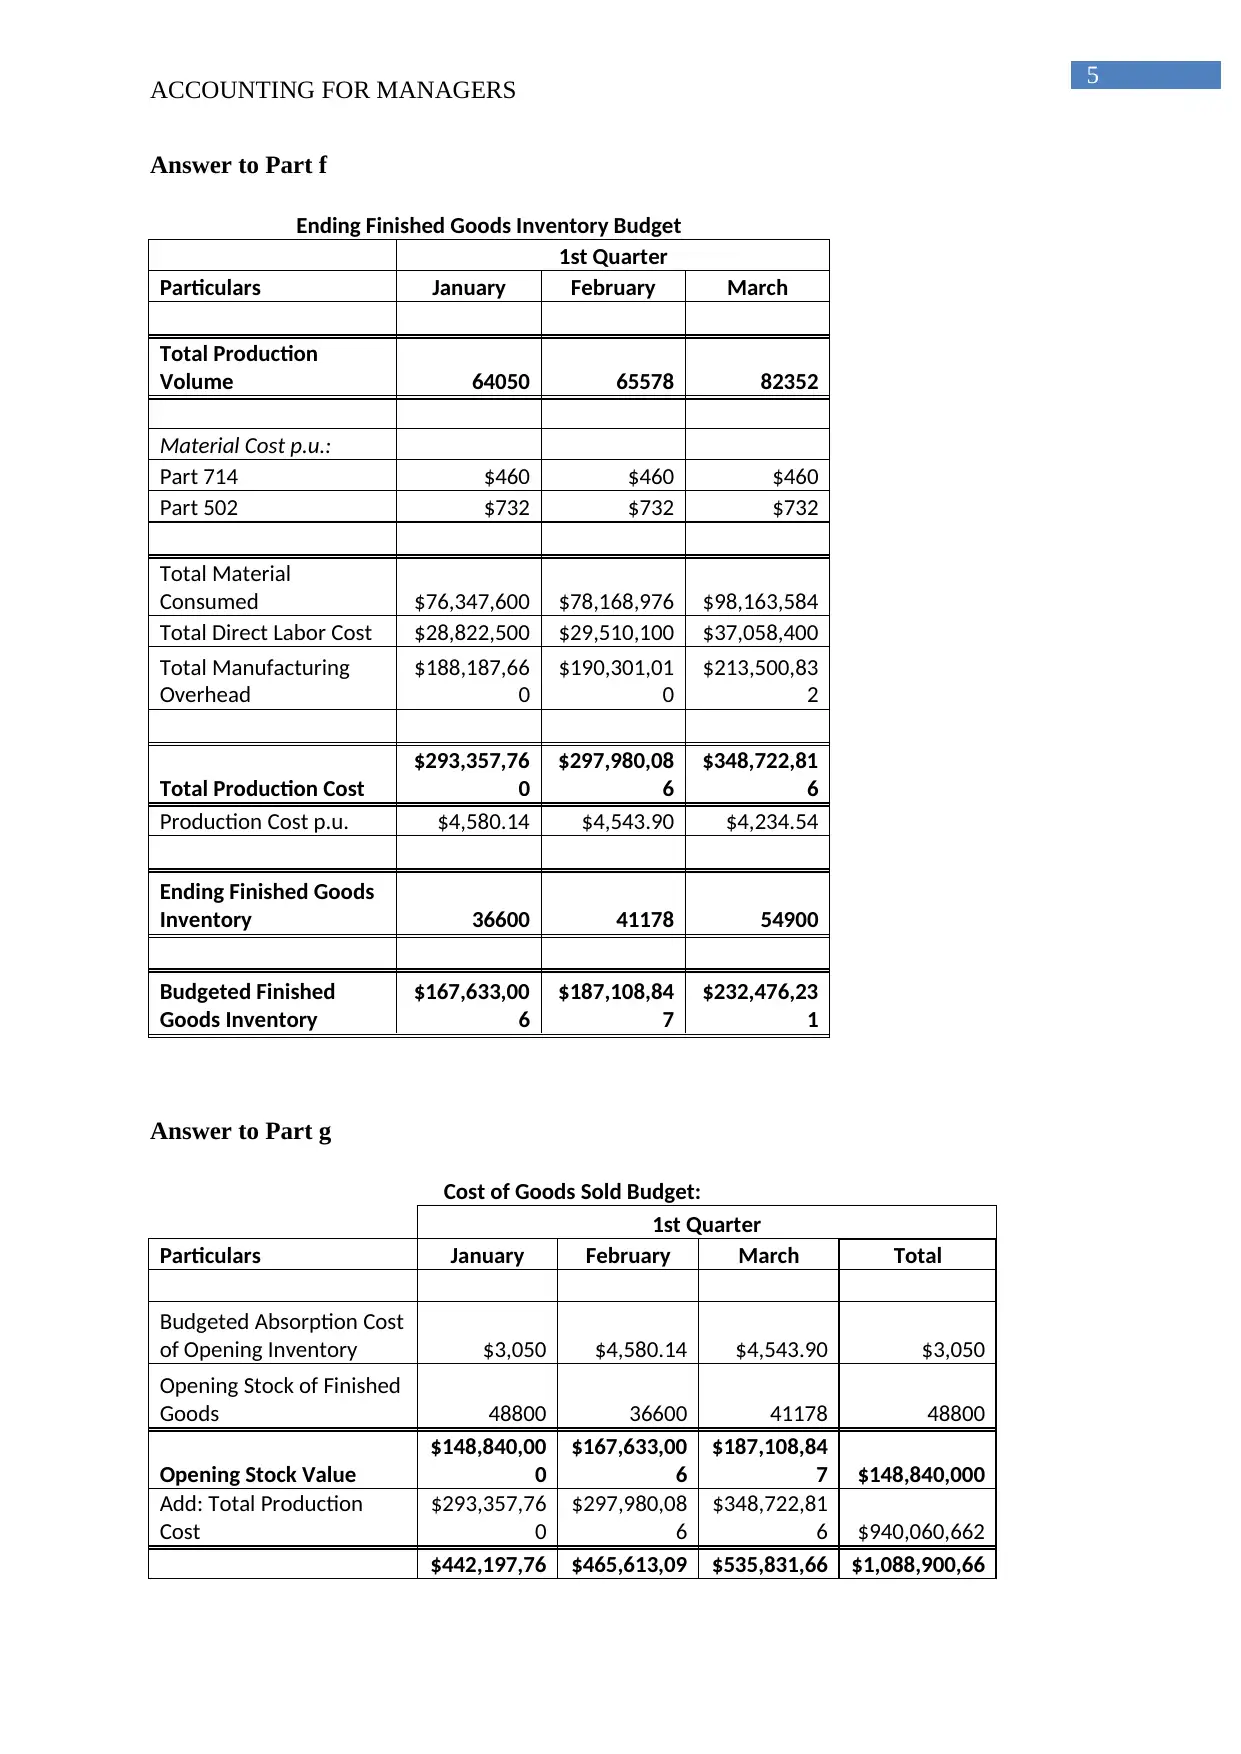
Answer to Part f
Ending Finished Goods Inventory Budget
1st Quarter
Particulars January February March
Total Production
Volume 64050 65578 82352
Material Cost p.u.:
Part 714 $460 $460 $460
Part 502 $732 $732 $732
Total Material
Consumed $76,347,600 $78,168,976 $98,163,584
Total Direct Labor Cost $28,822,500 $29,510,100 $37,058,400
Total Manufacturing
Overhead
$188,187,66
0
$190,301,01
0
$213,500,83
2
Total Production Cost
$293,357,76
0
$297,980,08
6
$348,722,81
6
Production Cost p.u. $4,580.14 $4,543.90 $4,234.54
Ending Finished Goods
Inventory 36600 41178 54900
Budgeted Finished
Goods Inventory
$167,633,00
6
$187,108,84
7
$232,476,23
1
Answer to Part g
Cost of Goods Sold Budget:
1st Quarter
Particulars January February March Total
Budgeted Absorption Cost
of Opening Inventory $3,050 $4,580.14 $4,543.90 $3,050
Opening Stock of Finished
Goods 48800 36600 41178 48800
Opening Stock Value
$148,840,00
0
$167,633,00
6
$187,108,84
7 $148,840,000
Add: Total Production
Cost
$293,357,76
0
$297,980,08
6
$348,722,81
6 $940,060,662
$442,197,76 $465,613,09 $535,831,66 $1,088,900,66
ACCOUNTING FOR MANAGERS
Answer to Part f
Ending Finished Goods Inventory Budget
1st Quarter
Particulars January February March
Total Production
Volume 64050 65578 82352
Material Cost p.u.:
Part 714 $460 $460 $460
Part 502 $732 $732 $732
Total Material
Consumed $76,347,600 $78,168,976 $98,163,584
Total Direct Labor Cost $28,822,500 $29,510,100 $37,058,400
Total Manufacturing
Overhead
$188,187,66
0
$190,301,01
0
$213,500,83
2
Total Production Cost
$293,357,76
0
$297,980,08
6
$348,722,81
6
Production Cost p.u. $4,580.14 $4,543.90 $4,234.54
Ending Finished Goods
Inventory 36600 41178 54900
Budgeted Finished
Goods Inventory
$167,633,00
6
$187,108,84
7
$232,476,23
1
Answer to Part g
Cost of Goods Sold Budget:
1st Quarter
Particulars January February March Total
Budgeted Absorption Cost
of Opening Inventory $3,050 $4,580.14 $4,543.90 $3,050
Opening Stock of Finished
Goods 48800 36600 41178 48800
Opening Stock Value
$148,840,00
0
$167,633,00
6
$187,108,84
7 $148,840,000
Add: Total Production
Cost
$293,357,76
0
$297,980,08
6
$348,722,81
6 $940,060,662
$442,197,76 $465,613,09 $535,831,66 $1,088,900,66
⊘ This is a preview!⊘
Do you want full access?
Subscribe today to unlock all pages.
Trusted by 1+ million students worldwide
6
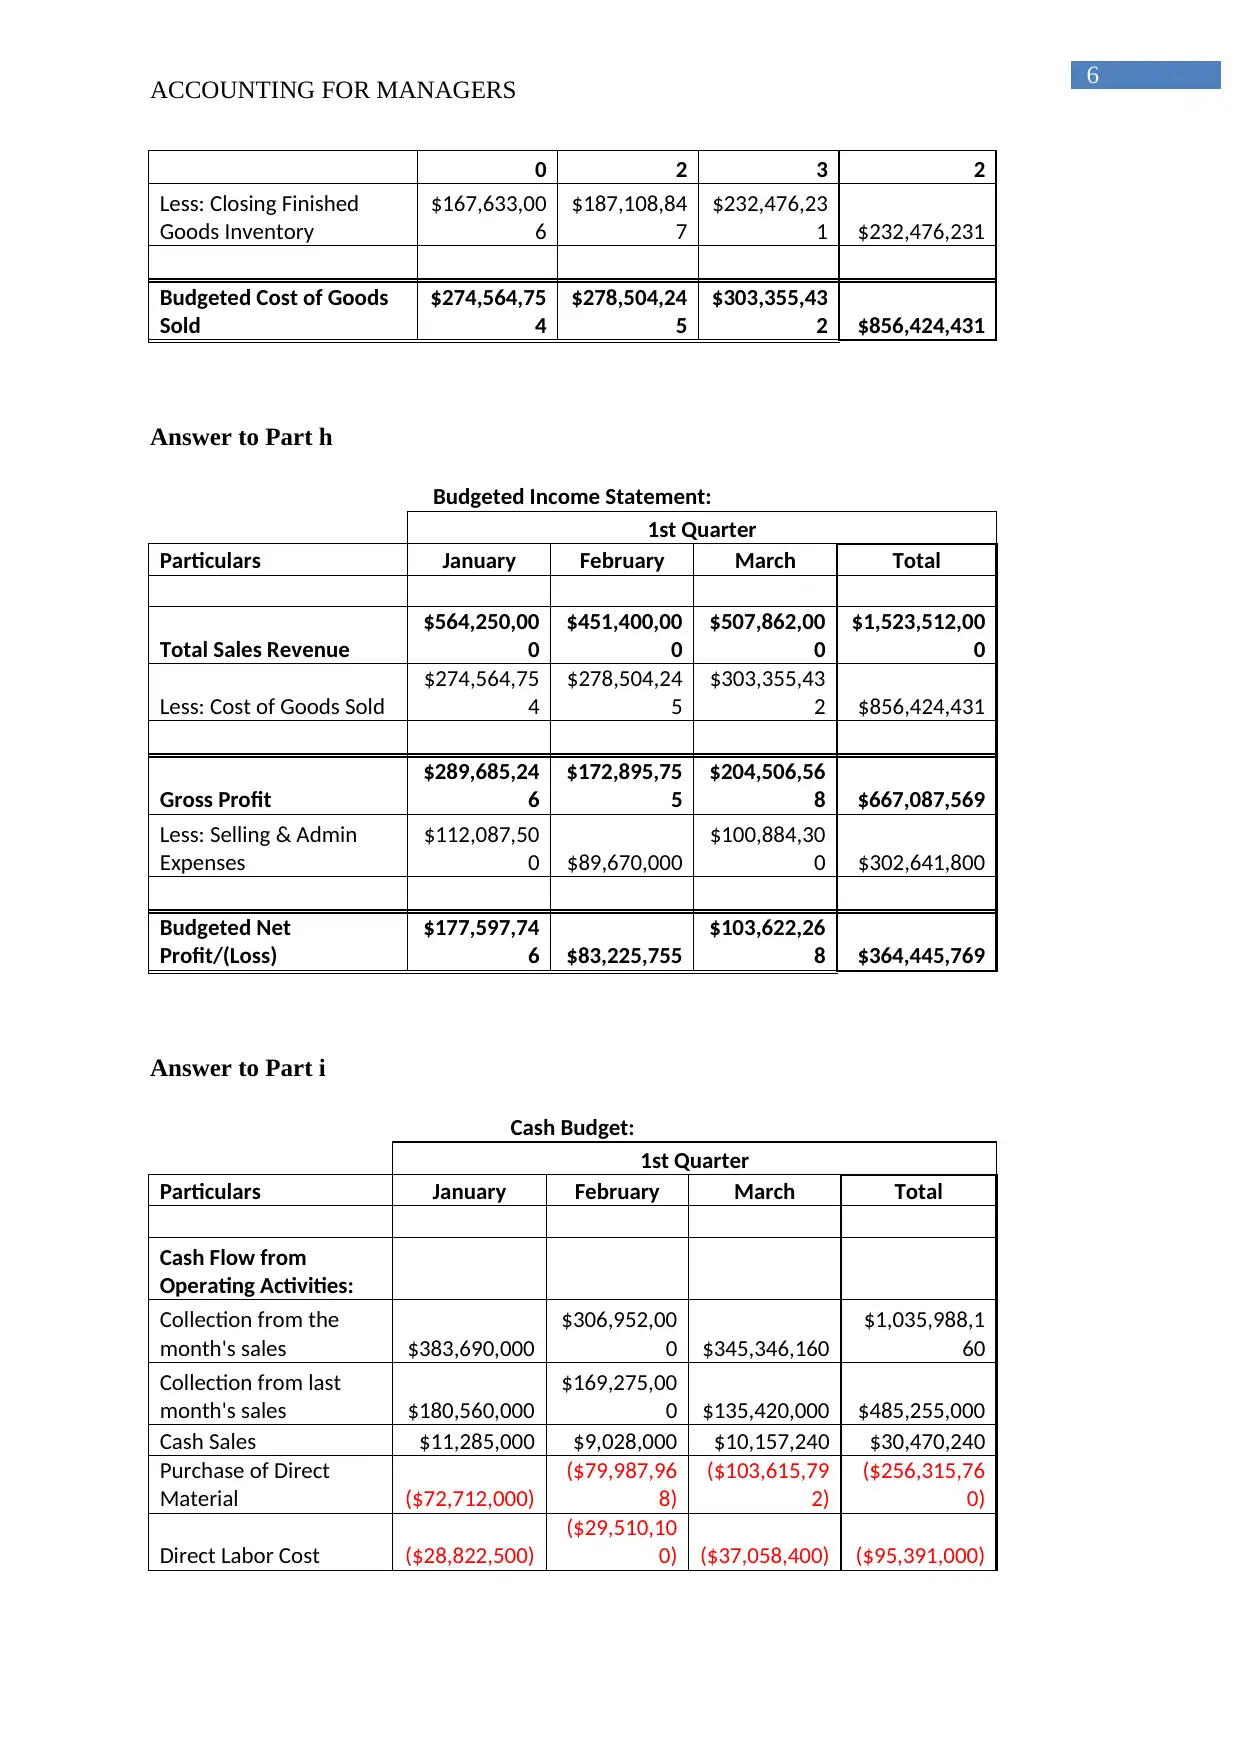
ACCOUNTING FOR MANAGERS
0 2 3 2
Less: Closing Finished
Goods Inventory
$167,633,00
6
$187,108,84
7
$232,476,23
1 $232,476,231
Budgeted Cost of Goods
Sold
$274,564,75
4
$278,504,24
5
$303,355,43
2 $856,424,431
Answer to Part h
Budgeted Income Statement:
1st Quarter
Particulars January February March Total
Total Sales Revenue
$564,250,00
0
$451,400,00
0
$507,862,00
0
$1,523,512,00
0
Less: Cost of Goods Sold
$274,564,75
4
$278,504,24
5
$303,355,43
2 $856,424,431
Gross Profit
$289,685,24
6
$172,895,75
5
$204,506,56
8 $667,087,569
Less: Selling & Admin
Expenses
$112,087,50
0 $89,670,000
$100,884,30
0 $302,641,800
Budgeted Net
Profit/(Loss)
$177,597,74
6 $83,225,755
$103,622,26
8 $364,445,769
Answer to Part i
Cash Budget:
1st Quarter
Particulars January February March Total
Cash Flow from
Operating Activities:
Collection from the
month's sales $383,690,000
$306,952,00
0 $345,346,160
$1,035,988,1
60
Collection from last
month's sales $180,560,000
$169,275,00
0 $135,420,000 $485,255,000
Cash Sales $11,285,000 $9,028,000 $10,157,240 $30,470,240
Purchase of Direct
Material ($72,712,000)
($79,987,96
8)
($103,615,79
2)
($256,315,76
0)
Direct Labor Cost ($28,822,500)
($29,510,10
0) ($37,058,400) ($95,391,000)
Paraphrase This Document
Need a fresh take? Get an instant paraphrase of this document with our AI Paraphraser
7
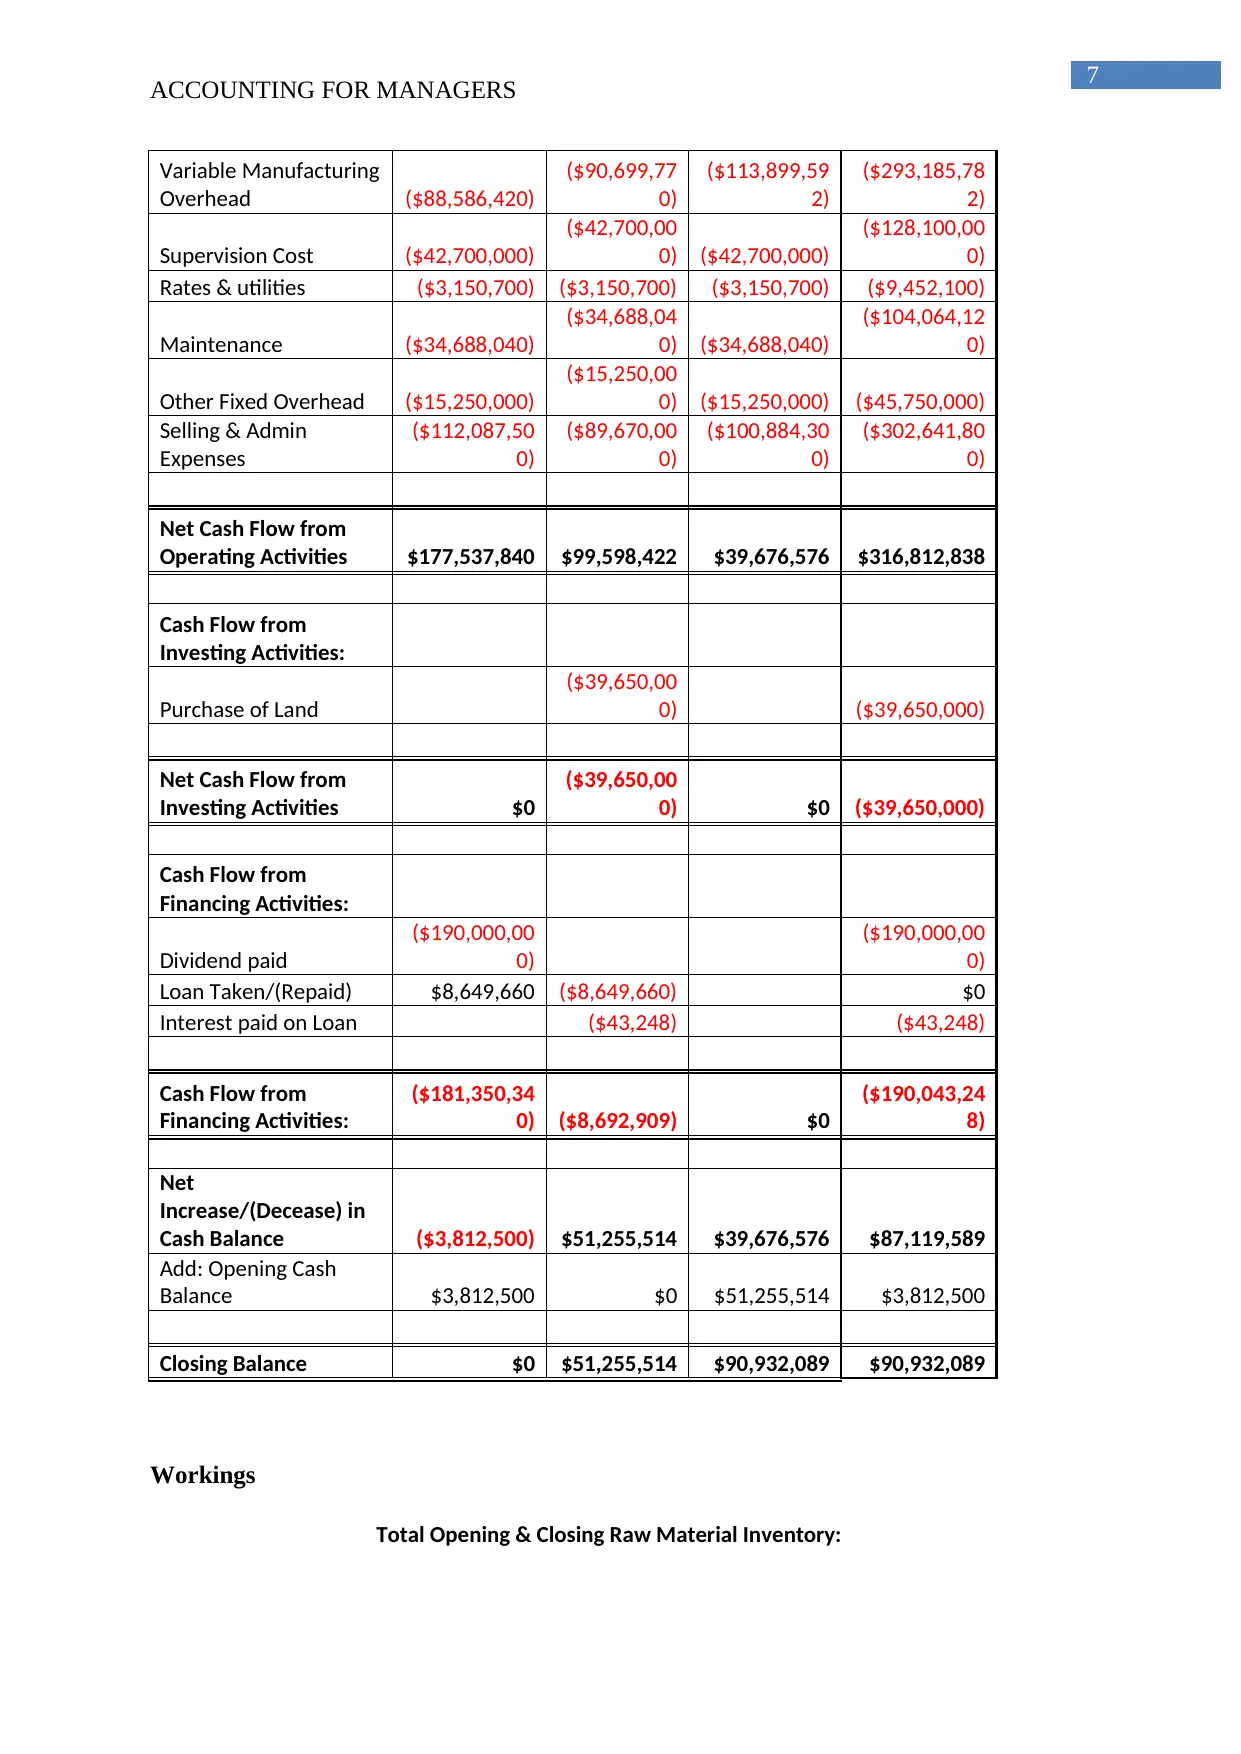
ACCOUNTING FOR MANAGERS
Variable Manufacturing
Overhead ($88,586,420)
($90,699,77
0)
($113,899,59
2)
($293,185,78
2)
Supervision Cost ($42,700,000)
($42,700,00
0) ($42,700,000)
($128,100,00
0)
Rates & utilities ($3,150,700) ($3,150,700) ($3,150,700) ($9,452,100)
Maintenance ($34,688,040)
($34,688,04
0) ($34,688,040)
($104,064,12
0)
Other Fixed Overhead ($15,250,000)
($15,250,00
0) ($15,250,000) ($45,750,000)
Selling & Admin
Expenses
($112,087,50
0)
($89,670,00
0)
($100,884,30
0)
($302,641,80
0)
Net Cash Flow from
Operating Activities $177,537,840 $99,598,422 $39,676,576 $316,812,838
Cash Flow from
Investing Activities:
Purchase of Land
($39,650,00
0) ($39,650,000)
Net Cash Flow from
Investing Activities $0
($39,650,00
0) $0 ($39,650,000)
Cash Flow from
Financing Activities:
Dividend paid
($190,000,00
0)
($190,000,00
0)
Loan Taken/(Repaid) $8,649,660 ($8,649,660) $0
Interest paid on Loan ($43,248) ($43,248)
Cash Flow from
Financing Activities:
($181,350,34
0) ($8,692,909) $0
($190,043,24
8)
Net
Increase/(Decease) in
Cash Balance ($3,812,500) $51,255,514 $39,676,576 $87,119,589
Add: Opening Cash
Balance $3,812,500 $0 $51,255,514 $3,812,500
Closing Balance $0 $51,255,514 $90,932,089 $90,932,089
Workings
Total Opening & Closing Raw Material Inventory:
8
ACCOUNTING FOR MANAGERS
Particulars January February March April
Part
714
Part
502
Part
714
Part
502
Part
714
Part
502
Part
714
Part
502
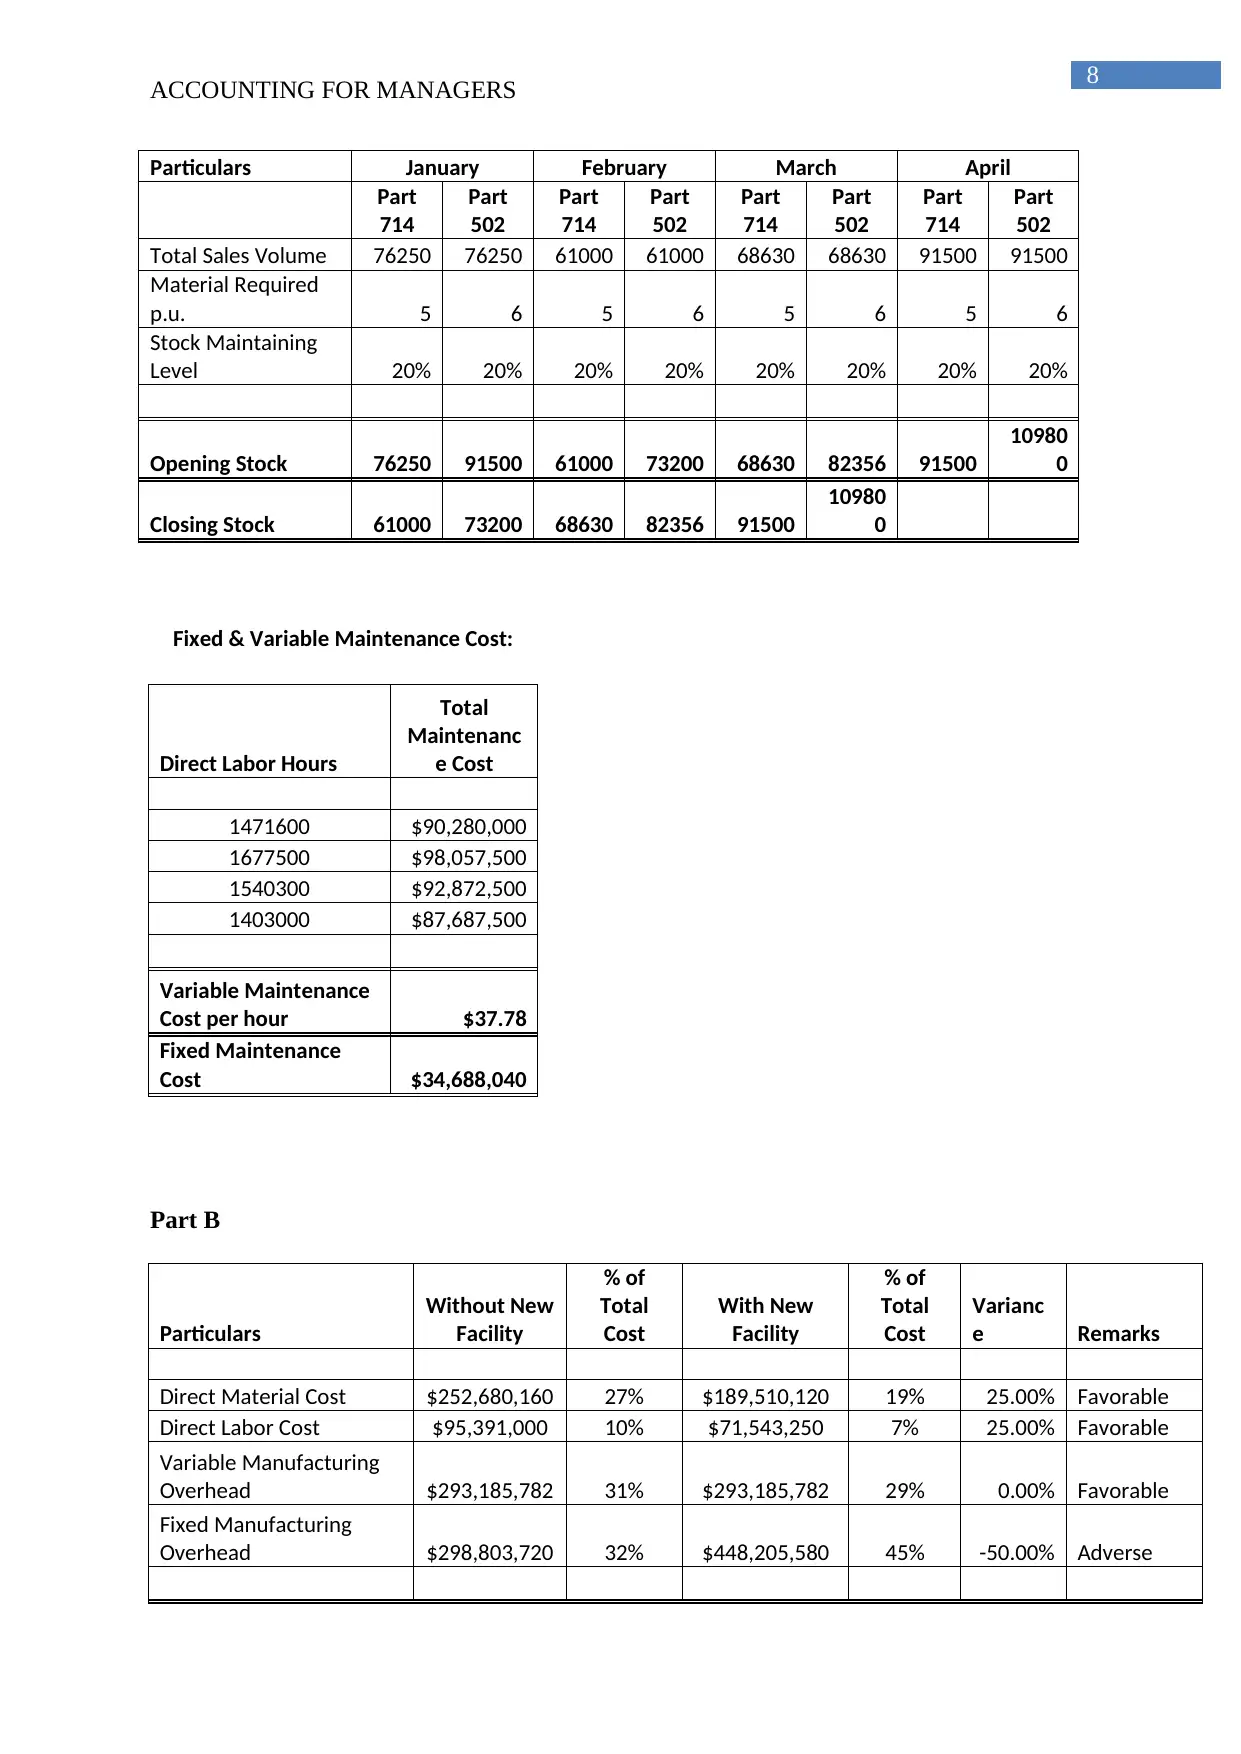
Total Sales Volume 76250 76250 61000 61000 68630 68630 91500 91500
Material Required
p.u. 5 6 5 6 5 6 5 6
Stock Maintaining
Level 20% 20% 20% 20% 20% 20% 20% 20%
Opening Stock 76250 91500 61000 73200 68630 82356 91500
10980
0
Closing Stock 61000 73200 68630 82356 91500
10980
0
Fixed & Variable Maintenance Cost:
Direct Labor Hours
Total
Maintenanc
e Cost
1471600 $90,280,000
1677500 $98,057,500
1540300 $92,872,500
1403000 $87,687,500
Variable Maintenance
Cost per hour $37.78
Fixed Maintenance
Cost $34,688,040
Part B
Particulars
Without New
Facility
% of
Total
Cost
With New
Facility
% of
Total
Cost
Varianc
e Remarks
Direct Material Cost $252,680,160 27% $189,510,120 19% 25.00% Favorable
Direct Labor Cost $95,391,000 10% $71,543,250 7% 25.00% Favorable
Variable Manufacturing
Overhead $293,185,782 31% $293,185,782 29% 0.00% Favorable
Fixed Manufacturing
Overhead $298,803,720 32% $448,205,580 45% -50.00% Adverse
ACCOUNTING FOR MANAGERS
Particulars January February March April
Part
714
Part
502
Part
714
Part
502
Part
714
Part
502
Part
714
Part
502
Total Sales Volume 76250 76250 61000 61000 68630 68630 91500 91500
Material Required
p.u. 5 6 5 6 5 6 5 6
Stock Maintaining
Level 20% 20% 20% 20% 20% 20% 20% 20%
Opening Stock 76250 91500 61000 73200 68630 82356 91500
10980
0
Closing Stock 61000 73200 68630 82356 91500
10980
0
Fixed & Variable Maintenance Cost:
Direct Labor Hours
Total
Maintenanc
e Cost
1471600 $90,280,000
1677500 $98,057,500
1540300 $92,872,500
1403000 $87,687,500
Variable Maintenance
Cost per hour $37.78
Fixed Maintenance
Cost $34,688,040
Part B
Particulars
Without New
Facility
% of
Total
Cost
With New
Facility
% of
Total
Cost
Varianc
e Remarks
Direct Material Cost $252,680,160 27% $189,510,120 19% 25.00% Favorable
Direct Labor Cost $95,391,000 10% $71,543,250 7% 25.00% Favorable
Variable Manufacturing
Overhead $293,185,782 31% $293,185,782 29% 0.00% Favorable
Fixed Manufacturing
Overhead $298,803,720 32% $448,205,580 45% -50.00% Adverse
⊘ This is a preview!⊘
Do you want full access?
Subscribe today to unlock all pages.
Trusted by 1+ million students worldwide
9
ACCOUNTING FOR MANAGERS
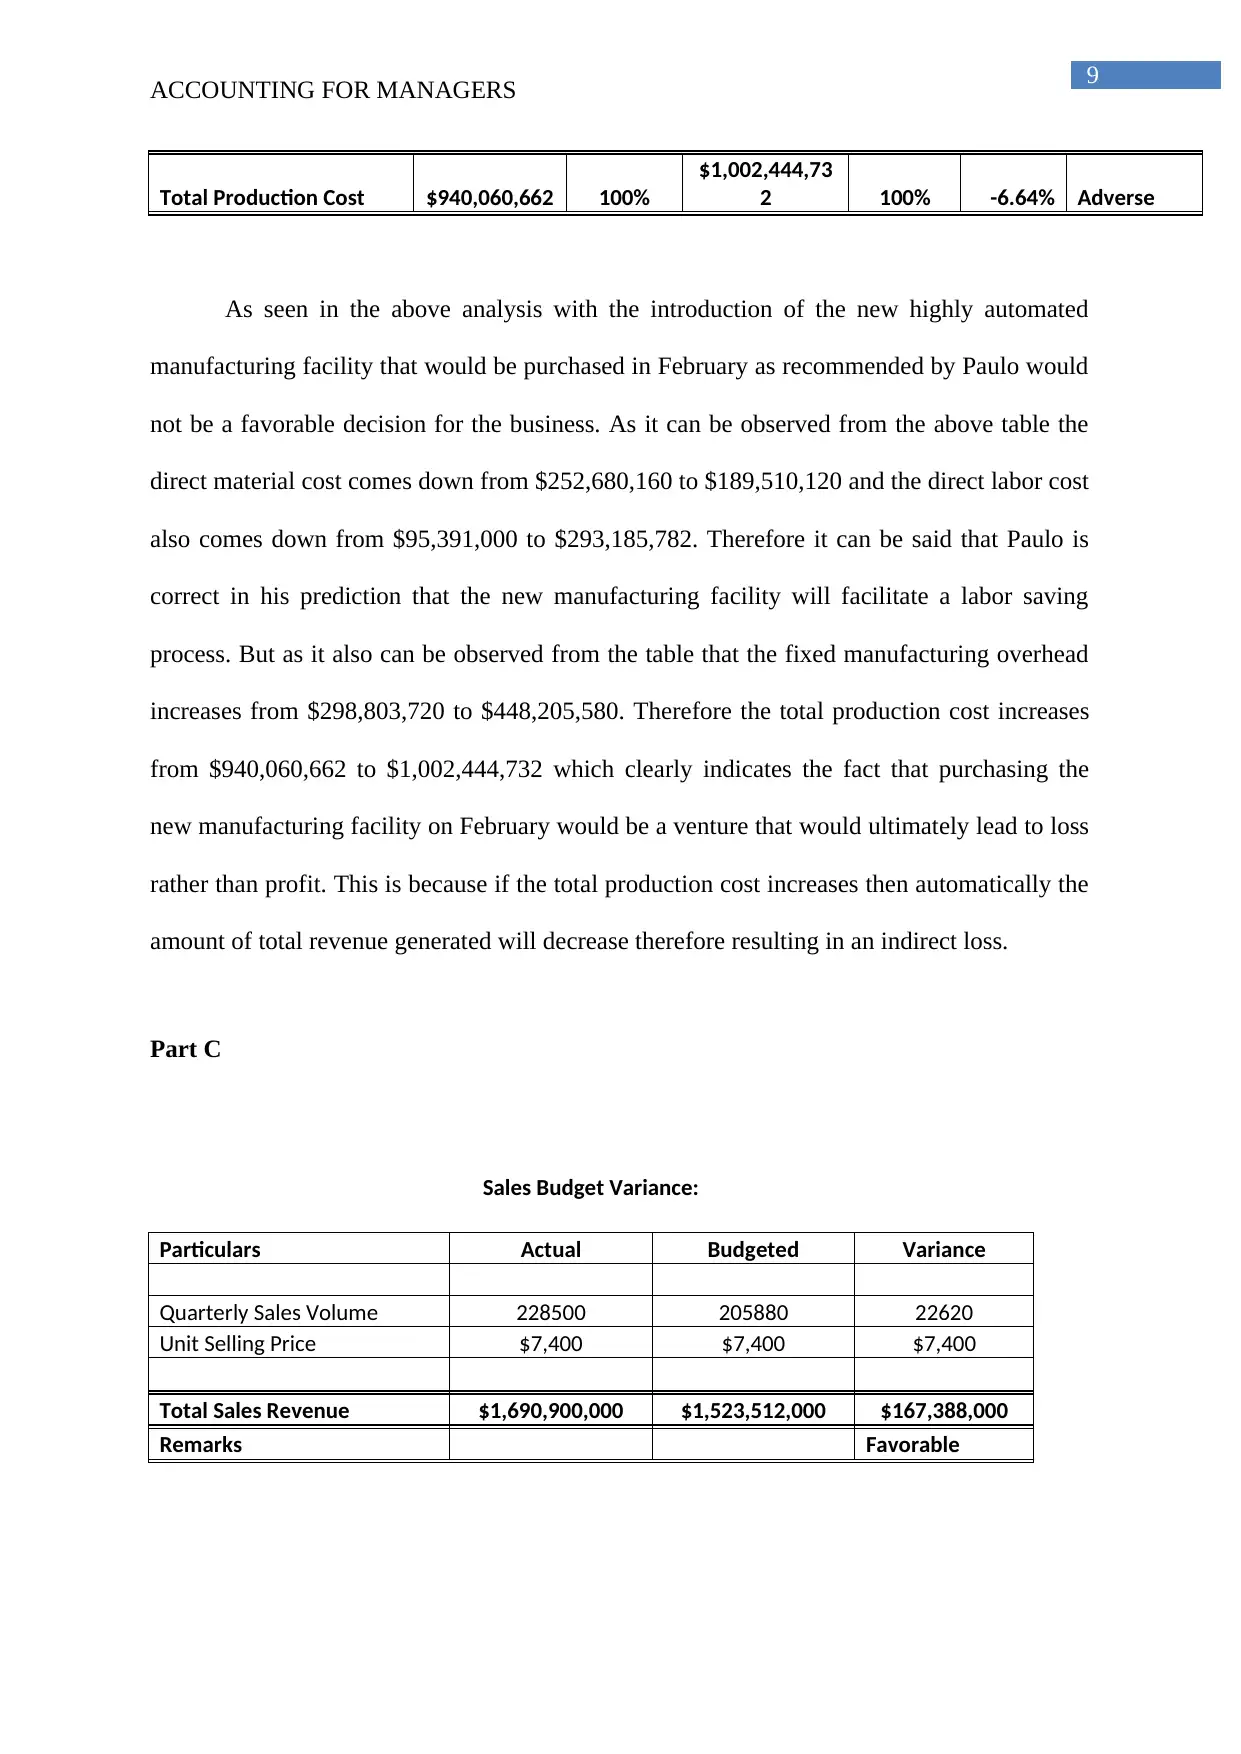
Total Production Cost $940,060,662 100%
$1,002,444,73
2 100% -6.64% Adverse
As seen in the above analysis with the introduction of the new highly automated
manufacturing facility that would be purchased in February as recommended by Paulo would
not be a favorable decision for the business. As it can be observed from the above table the
direct material cost comes down from $252,680,160 to $189,510,120 and the direct labor cost
also comes down from $95,391,000 to $293,185,782. Therefore it can be said that Paulo is
correct in his prediction that the new manufacturing facility will facilitate a labor saving
process. But as it also can be observed from the table that the fixed manufacturing overhead
increases from $298,803,720 to $448,205,580. Therefore the total production cost increases
from $940,060,662 to $1,002,444,732 which clearly indicates the fact that purchasing the
new manufacturing facility on February would be a venture that would ultimately lead to loss
rather than profit. This is because if the total production cost increases then automatically the
amount of total revenue generated will decrease therefore resulting in an indirect loss.
Part C
Sales Budget Variance:
Particulars Actual Budgeted Variance
Quarterly Sales Volume 228500 205880 22620
Unit Selling Price $7,400 $7,400 $7,400
Total Sales Revenue $1,690,900,000 $1,523,512,000 $167,388,000
Remarks Favorable
ACCOUNTING FOR MANAGERS
Total Production Cost $940,060,662 100%
$1,002,444,73
2 100% -6.64% Adverse
As seen in the above analysis with the introduction of the new highly automated
manufacturing facility that would be purchased in February as recommended by Paulo would
not be a favorable decision for the business. As it can be observed from the above table the
direct material cost comes down from $252,680,160 to $189,510,120 and the direct labor cost
also comes down from $95,391,000 to $293,185,782. Therefore it can be said that Paulo is
correct in his prediction that the new manufacturing facility will facilitate a labor saving
process. But as it also can be observed from the table that the fixed manufacturing overhead
increases from $298,803,720 to $448,205,580. Therefore the total production cost increases
from $940,060,662 to $1,002,444,732 which clearly indicates the fact that purchasing the
new manufacturing facility on February would be a venture that would ultimately lead to loss
rather than profit. This is because if the total production cost increases then automatically the
amount of total revenue generated will decrease therefore resulting in an indirect loss.
Part C
Sales Budget Variance:
Particulars Actual Budgeted Variance
Quarterly Sales Volume 228500 205880 22620
Unit Selling Price $7,400 $7,400 $7,400
Total Sales Revenue $1,690,900,000 $1,523,512,000 $167,388,000
Remarks Favorable
Paraphrase This Document
Need a fresh take? Get an instant paraphrase of this document with our AI Paraphraser
10
ACCOUNTING FOR MANAGERS
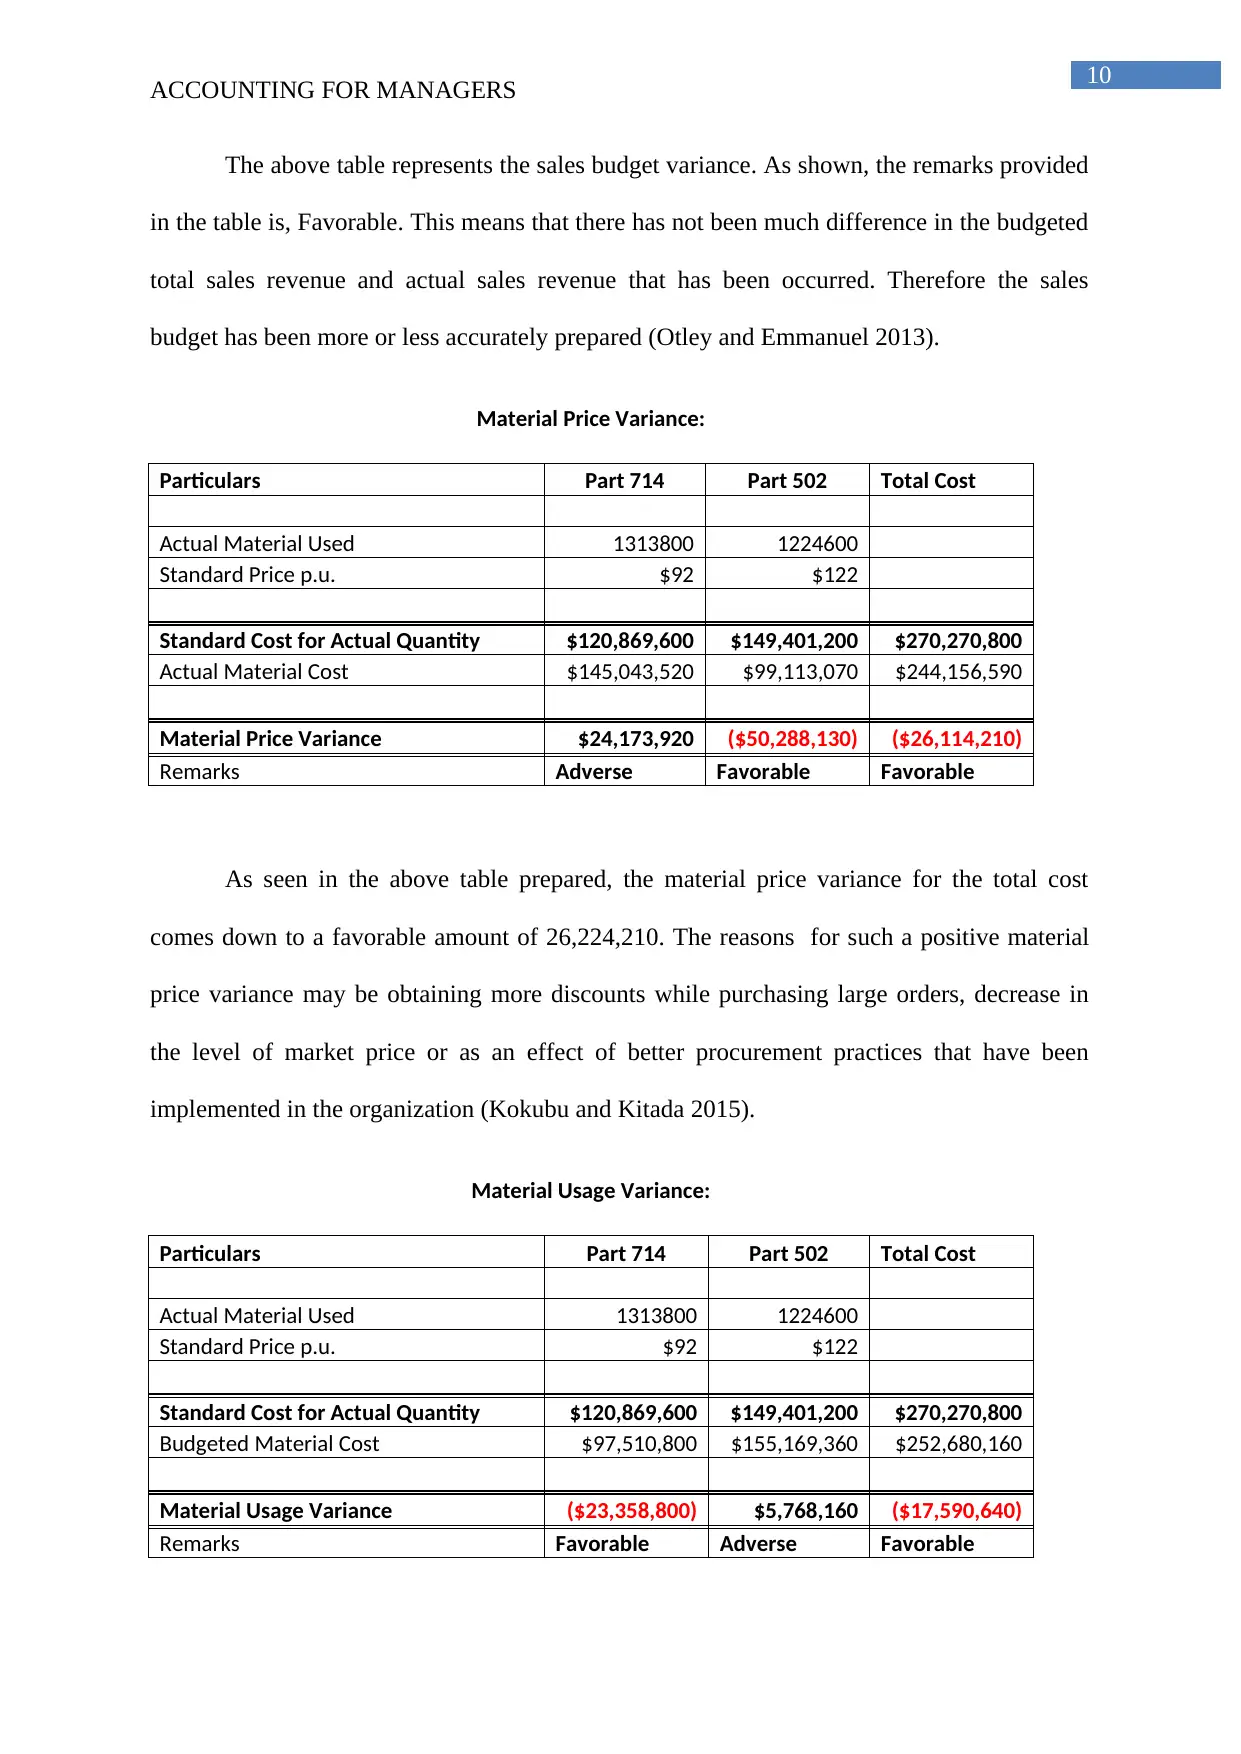
The above table represents the sales budget variance. As shown, the remarks provided
in the table is, Favorable. This means that there has not been much difference in the budgeted
total sales revenue and actual sales revenue that has been occurred. Therefore the sales
budget has been more or less accurately prepared (Otley and Emmanuel 2013).
Material Price Variance:
Particulars Part 714 Part 502 Total Cost
Actual Material Used 1313800 1224600
Standard Price p.u. $92 $122
Standard Cost for Actual Quantity $120,869,600 $149,401,200 $270,270,800
Actual Material Cost $145,043,520 $99,113,070 $244,156,590
Material Price Variance $24,173,920 ($50,288,130) ($26,114,210)
Remarks Adverse Favorable Favorable
As seen in the above table prepared, the material price variance for the total cost
comes down to a favorable amount of 26,224,210. The reasons for such a positive material
price variance may be obtaining more discounts while purchasing large orders, decrease in
the level of market price or as an effect of better procurement practices that have been
implemented in the organization (Kokubu and Kitada 2015).
Material Usage Variance:
Particulars Part 714 Part 502 Total Cost
Actual Material Used 1313800 1224600
Standard Price p.u. $92 $122
Standard Cost for Actual Quantity $120,869,600 $149,401,200 $270,270,800
Budgeted Material Cost $97,510,800 $155,169,360 $252,680,160
Material Usage Variance ($23,358,800) $5,768,160 ($17,590,640)
Remarks Favorable Adverse Favorable
ACCOUNTING FOR MANAGERS
The above table represents the sales budget variance. As shown, the remarks provided
in the table is, Favorable. This means that there has not been much difference in the budgeted
total sales revenue and actual sales revenue that has been occurred. Therefore the sales
budget has been more or less accurately prepared (Otley and Emmanuel 2013).
Material Price Variance:
Particulars Part 714 Part 502 Total Cost
Actual Material Used 1313800 1224600
Standard Price p.u. $92 $122
Standard Cost for Actual Quantity $120,869,600 $149,401,200 $270,270,800
Actual Material Cost $145,043,520 $99,113,070 $244,156,590
Material Price Variance $24,173,920 ($50,288,130) ($26,114,210)
Remarks Adverse Favorable Favorable
As seen in the above table prepared, the material price variance for the total cost
comes down to a favorable amount of 26,224,210. The reasons for such a positive material
price variance may be obtaining more discounts while purchasing large orders, decrease in
the level of market price or as an effect of better procurement practices that have been
implemented in the organization (Kokubu and Kitada 2015).
Material Usage Variance:
Particulars Part 714 Part 502 Total Cost
Actual Material Used 1313800 1224600
Standard Price p.u. $92 $122
Standard Cost for Actual Quantity $120,869,600 $149,401,200 $270,270,800
Budgeted Material Cost $97,510,800 $155,169,360 $252,680,160
Material Usage Variance ($23,358,800) $5,768,160 ($17,590,640)
Remarks Favorable Adverse Favorable
11
ACCOUNTING FOR MANAGERS
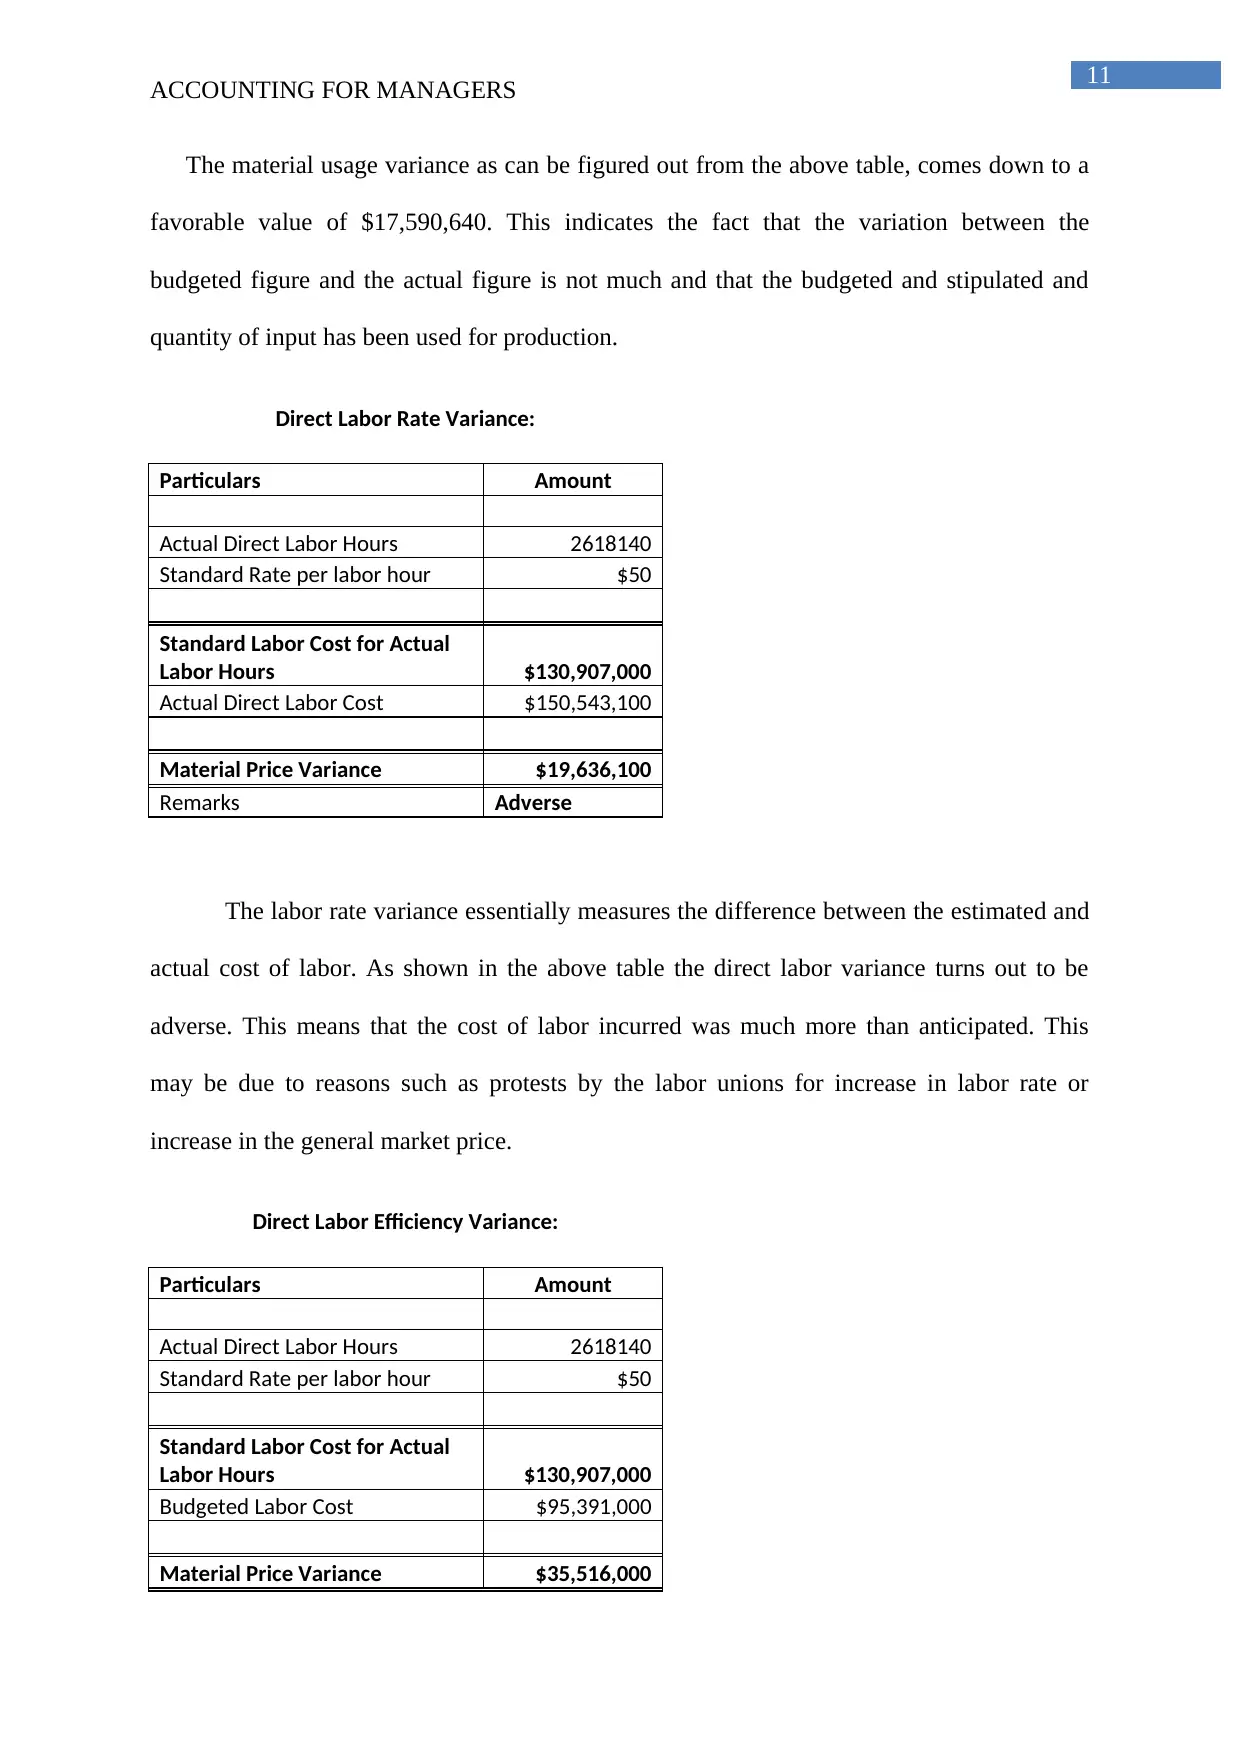
The material usage variance as can be figured out from the above table, comes down to a
favorable value of $17,590,640. This indicates the fact that the variation between the
budgeted figure and the actual figure is not much and that the budgeted and stipulated and
quantity of input has been used for production.
Direct Labor Rate Variance:
Particulars Amount
Actual Direct Labor Hours 2618140
Standard Rate per labor hour $50
Standard Labor Cost for Actual
Labor Hours $130,907,000
Actual Direct Labor Cost $150,543,100
Material Price Variance $19,636,100
Remarks Adverse
The labor rate variance essentially measures the difference between the estimated and
actual cost of labor. As shown in the above table the direct labor variance turns out to be
adverse. This means that the cost of labor incurred was much more than anticipated. This
may be due to reasons such as protests by the labor unions for increase in labor rate or
increase in the general market price.
Direct Labor Efficiency Variance:
Particulars Amount
Actual Direct Labor Hours 2618140
Standard Rate per labor hour $50
Standard Labor Cost for Actual
Labor Hours $130,907,000
Budgeted Labor Cost $95,391,000
Material Price Variance $35,516,000
ACCOUNTING FOR MANAGERS
The material usage variance as can be figured out from the above table, comes down to a
favorable value of $17,590,640. This indicates the fact that the variation between the
budgeted figure and the actual figure is not much and that the budgeted and stipulated and
quantity of input has been used for production.
Direct Labor Rate Variance:
Particulars Amount
Actual Direct Labor Hours 2618140
Standard Rate per labor hour $50
Standard Labor Cost for Actual
Labor Hours $130,907,000
Actual Direct Labor Cost $150,543,100
Material Price Variance $19,636,100
Remarks Adverse
The labor rate variance essentially measures the difference between the estimated and
actual cost of labor. As shown in the above table the direct labor variance turns out to be
adverse. This means that the cost of labor incurred was much more than anticipated. This
may be due to reasons such as protests by the labor unions for increase in labor rate or
increase in the general market price.
Direct Labor Efficiency Variance:
Particulars Amount
Actual Direct Labor Hours 2618140
Standard Rate per labor hour $50
Standard Labor Cost for Actual
Labor Hours $130,907,000
Budgeted Labor Cost $95,391,000
Material Price Variance $35,516,000
⊘ This is a preview!⊘
Do you want full access?
Subscribe today to unlock all pages.
Trusted by 1+ million students worldwide
1 out of 16
Related Documents


Your All-in-One AI-Powered Toolkit for Academic Success.
+13062052269
info@desklib.com
Available 24*7 on WhatsApp / Email
![[object Object]](/_next/static/media/star-bottom.7253800d.svg)
Unlock your academic potential
Copyright © 2020–2026 A2Z Services. All Rights Reserved. Developed and managed by ZUCOL.