Accounting for Managers: Financial Performance Analysis Report
VerifiedAdded on 2021/05/27
|13
|2493
|22
Report
AI Summary
This report, prepared for an Accounting for Managers course, presents a comparative financial analysis of two companies, Advance Nano Tek and Sci Dev. The analysis focuses on key financial ratios, including Return on Assets (ROA), Asset Turnover Ratio, and Net Profit Margin, over a three-year period (2015-2017). The report calculates and interprets these ratios to assess shareholder wealth generation efficiency, highlighting the superior performance of Advance Nano Tek. It delves into the concept of ROA, its calculation, and its implications for profitability and asset utilization. Furthermore, the report discusses the limitations of ROA, such as its potential to be misleading in asset-intensive industries and its reliance on net profit figures. It also examines the impact of these limitations on company comparisons and suggests methods to mitigate them. The report includes a real-world case study of Biogen Inc. to illustrate the practical application of ROA and the factors influencing its changes. Finally, it concludes by emphasizing the importance of considering multiple factors beyond ROA for a comprehensive financial analysis.
Running head: ACCOUNTING FOR MANAGERS
Accounting for managers
Name of the student
Name of the university
Student ID
Author note
Accounting for managers
Name of the student
Name of the university
Student ID
Author note
Paraphrase This Document
Need a fresh take? Get an instant paraphrase of this document with our AI Paraphraser
1ACCOUNTING FOR MANAGERS
Table of Contents
Answer (a)..................................................................................................................................2
Answer (b)..................................................................................................................................2
Answer (c)..................................................................................................................................4
Answer (d)..................................................................................................................................9
Reference..................................................................................................................................10
2ACCOUNTING FOR MANAGERS
Answer (a)
Similarities and dissimilarities between the companies
Advance Nano Tek is manufacturer and specialist developer of the advanced
materials those are used by the manufacturers for personal care, industrial and chemical
sectors for adding competitive advantage to the end products. On the other hand, Sci dev is
engaged in designing for wastewater treatment all over the industrial sectors that include
beverages and food, power generation, gas and oil production, cardboard and paper
manufacturing, personal cosmetics and products manufacturing and paint manufacturing.
Therefore, the similarities in operation is the personal care product manufacturing and the
dissimilarity is that Nano tek deals in manufacture of metals like aluminium oxide powder,
zinc oxide powder and zinc oxide dispersions whereas Sci Dev is engaged in treatment of
waste water.
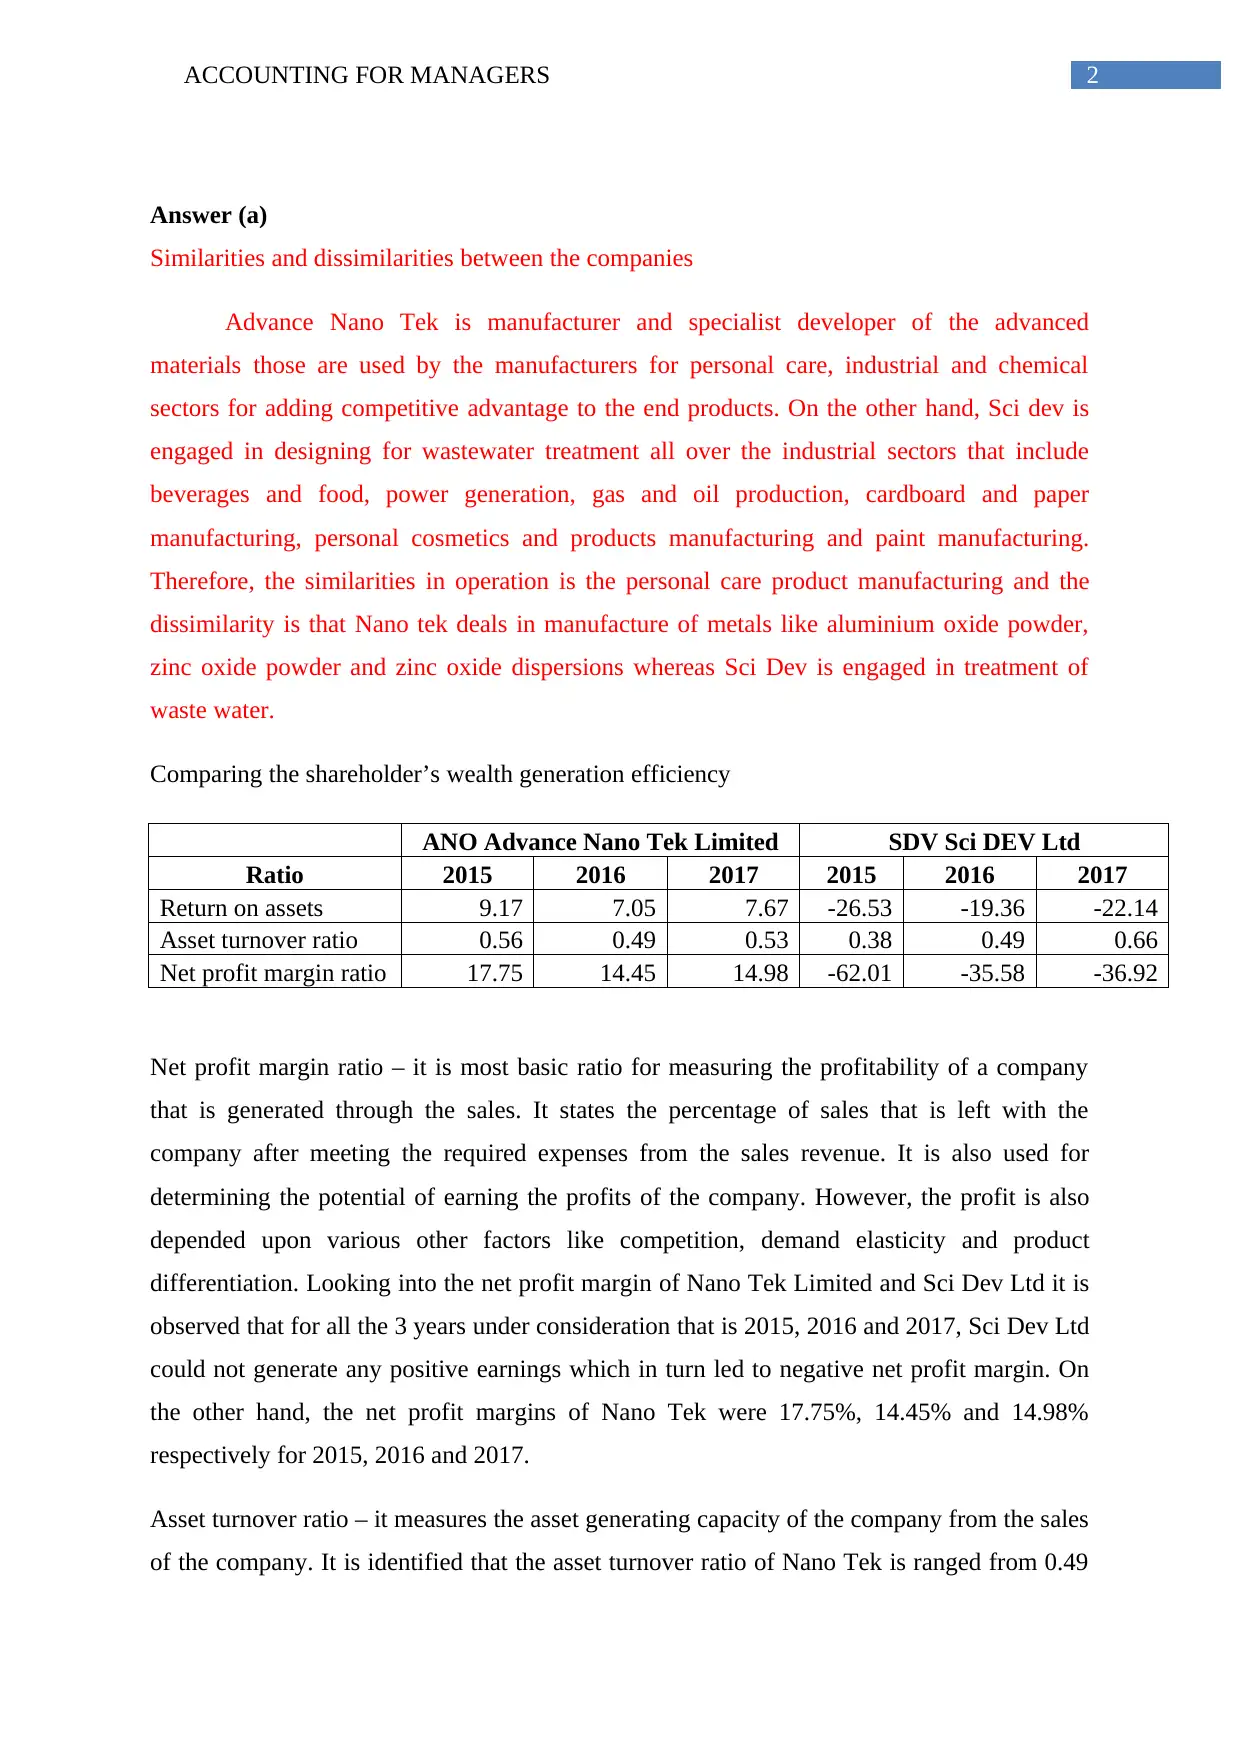
Comparing the shareholder’s wealth generation efficiency
ANO Advance Nano Tek Limited SDV Sci DEV Ltd
Ratio 2015 2016 2017 2015 2016 2017
Return on assets 9.17 7.05 7.67 -26.53 -19.36 -22.14
Asset turnover ratio 0.56 0.49 0.53 0.38 0.49 0.66
Net profit margin ratio 17.75 14.45 14.98 -62.01 -35.58 -36.92
Net profit margin ratio – it is most basic ratio for measuring the profitability of a company
that is generated through the sales. It states the percentage of sales that is left with the
company after meeting the required expenses from the sales revenue. It is also used for
determining the potential of earning the profits of the company. However, the profit is also
depended upon various other factors like competition, demand elasticity and product
differentiation. Looking into the net profit margin of Nano Tek Limited and Sci Dev Ltd it is
observed that for all the 3 years under consideration that is 2015, 2016 and 2017, Sci Dev Ltd
could not generate any positive earnings which in turn led to negative net profit margin. On
the other hand, the net profit margins of Nano Tek were 17.75%, 14.45% and 14.98%
respectively for 2015, 2016 and 2017.
Asset turnover ratio – it measures the asset generating capacity of the company from the sales
of the company. It is identified that the asset turnover ratio of Nano Tek is ranged from 0.49
Answer (a)
Similarities and dissimilarities between the companies
Advance Nano Tek is manufacturer and specialist developer of the advanced
materials those are used by the manufacturers for personal care, industrial and chemical
sectors for adding competitive advantage to the end products. On the other hand, Sci dev is
engaged in designing for wastewater treatment all over the industrial sectors that include
beverages and food, power generation, gas and oil production, cardboard and paper
manufacturing, personal cosmetics and products manufacturing and paint manufacturing.
Therefore, the similarities in operation is the personal care product manufacturing and the
dissimilarity is that Nano tek deals in manufacture of metals like aluminium oxide powder,
zinc oxide powder and zinc oxide dispersions whereas Sci Dev is engaged in treatment of
waste water.
Comparing the shareholder’s wealth generation efficiency
ANO Advance Nano Tek Limited SDV Sci DEV Ltd
Ratio 2015 2016 2017 2015 2016 2017
Return on assets 9.17 7.05 7.67 -26.53 -19.36 -22.14
Asset turnover ratio 0.56 0.49 0.53 0.38 0.49 0.66
Net profit margin ratio 17.75 14.45 14.98 -62.01 -35.58 -36.92
Net profit margin ratio – it is most basic ratio for measuring the profitability of a company
that is generated through the sales. It states the percentage of sales that is left with the
company after meeting the required expenses from the sales revenue. It is also used for
determining the potential of earning the profits of the company. However, the profit is also
depended upon various other factors like competition, demand elasticity and product
differentiation. Looking into the net profit margin of Nano Tek Limited and Sci Dev Ltd it is
observed that for all the 3 years under consideration that is 2015, 2016 and 2017, Sci Dev Ltd
could not generate any positive earnings which in turn led to negative net profit margin. On
the other hand, the net profit margins of Nano Tek were 17.75%, 14.45% and 14.98%
respectively for 2015, 2016 and 2017.
Asset turnover ratio – it measures the asset generating capacity of the company from the sales
of the company. It is identified that the asset turnover ratio of Nano Tek is ranged from 0.49
⊘ This is a preview!⊘
Do you want full access?
Subscribe today to unlock all pages.
Trusted by 1+ million students worldwide
3ACCOUNTING FOR MANAGERS
to 0.56 whereas the same for Sci Dev is ranged between 0.38 and 0.66. However, except for
the year 2017 other 2 year’s ratio for Nano Tek is better as compared to Sci Dev.
Therefore, taking into consideration above facts it can be considered that Nano Tek is
more efficient in generating shareholder’s wealth.
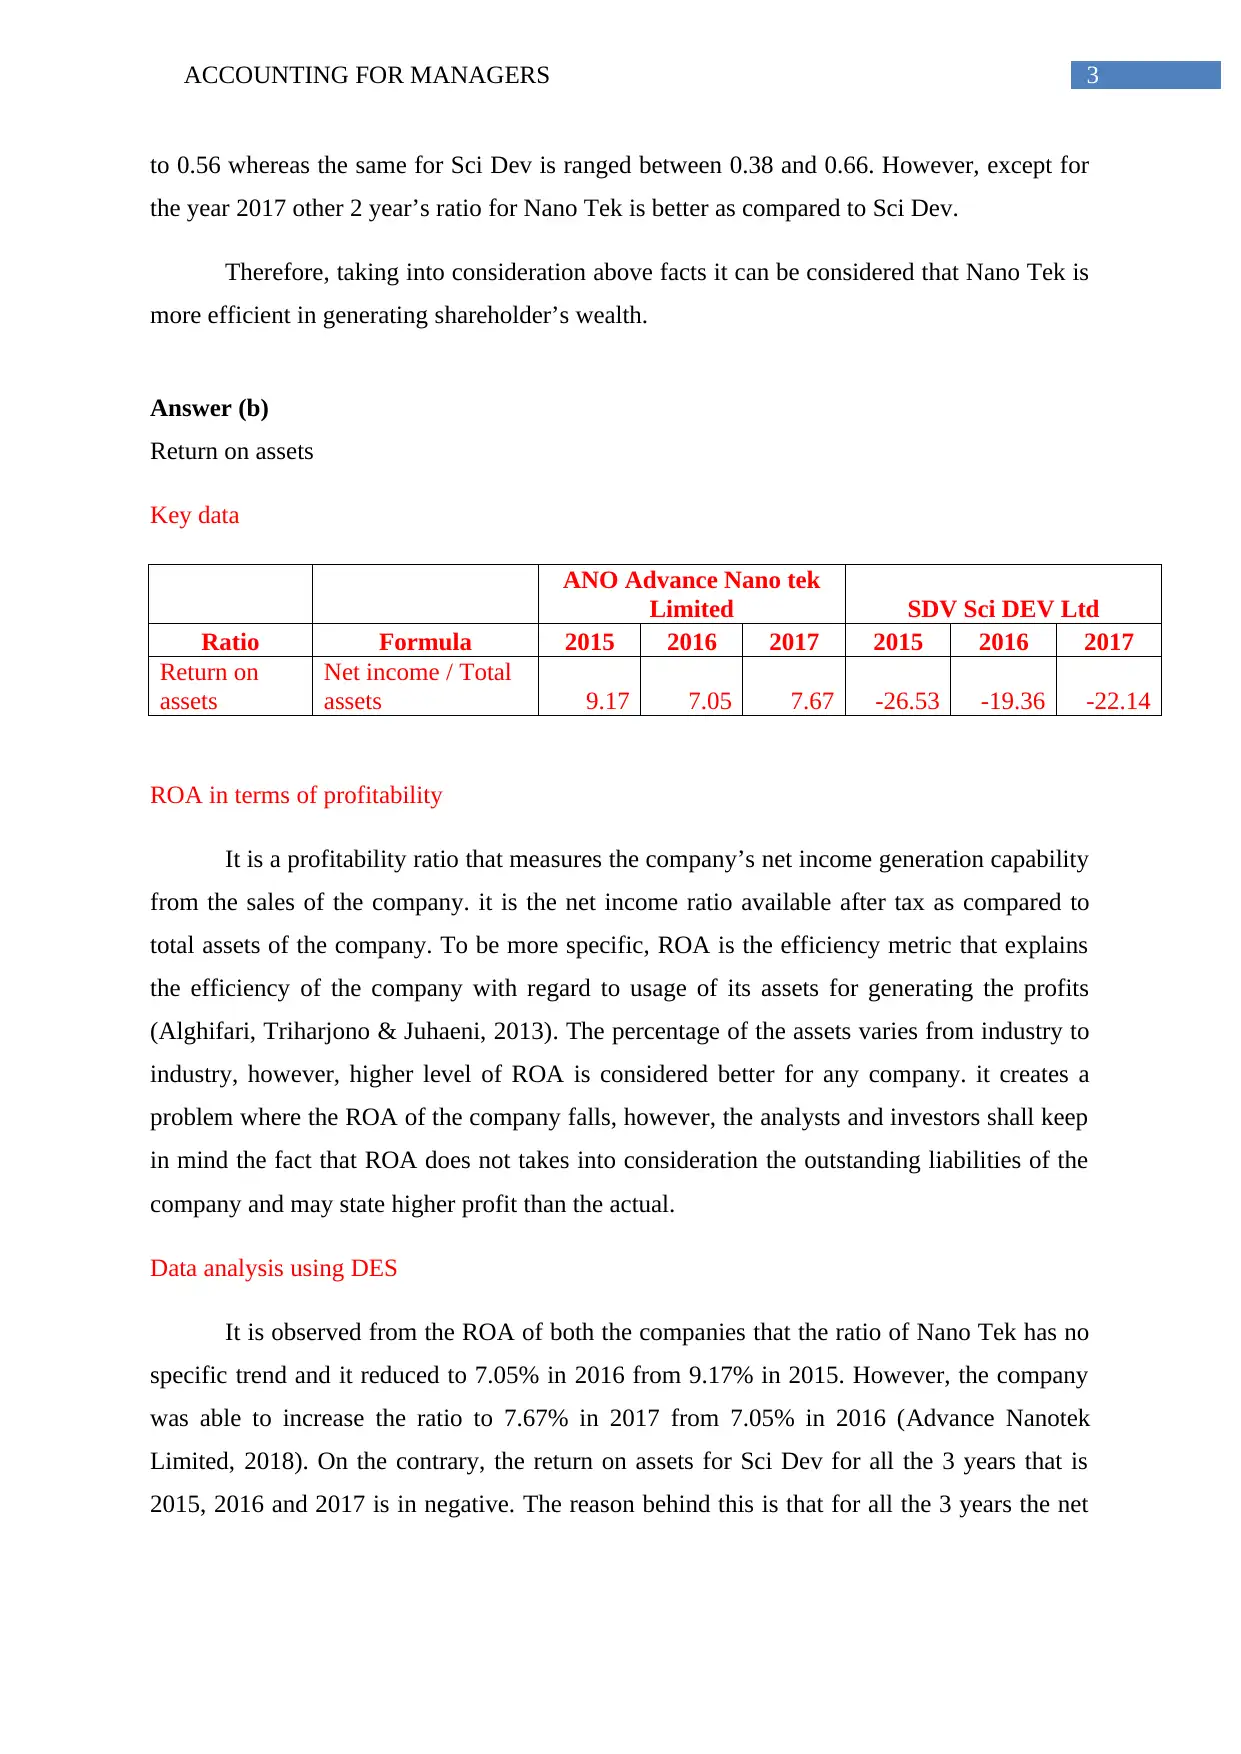
Answer (b)
Return on assets
Key data
ANO Advance Nano tek
Limited SDV Sci DEV Ltd
Ratio Formula 2015 2016 2017 2015 2016 2017
Return on
assets
Net income / Total
assets 9.17 7.05 7.67 -26.53 -19.36 -22.14
ROA in terms of profitability
It is a profitability ratio that measures the company’s net income generation capability
from the sales of the company. it is the net income ratio available after tax as compared to
total assets of the company. To be more specific, ROA is the efficiency metric that explains
the efficiency of the company with regard to usage of its assets for generating the profits
(Alghifari, Triharjono & Juhaeni, 2013). The percentage of the assets varies from industry to
industry, however, higher level of ROA is considered better for any company. it creates a
problem where the ROA of the company falls, however, the analysts and investors shall keep
in mind the fact that ROA does not takes into consideration the outstanding liabilities of the
company and may state higher profit than the actual.
Data analysis using DES
It is observed from the ROA of both the companies that the ratio of Nano Tek has no
specific trend and it reduced to 7.05% in 2016 from 9.17% in 2015. However, the company
was able to increase the ratio to 7.67% in 2017 from 7.05% in 2016 (Advance Nanotek
Limited, 2018). On the contrary, the return on assets for Sci Dev for all the 3 years that is
2015, 2016 and 2017 is in negative. The reason behind this is that for all the 3 years the net
to 0.56 whereas the same for Sci Dev is ranged between 0.38 and 0.66. However, except for
the year 2017 other 2 year’s ratio for Nano Tek is better as compared to Sci Dev.
Therefore, taking into consideration above facts it can be considered that Nano Tek is
more efficient in generating shareholder’s wealth.
Answer (b)
Return on assets
Key data
ANO Advance Nano tek
Limited SDV Sci DEV Ltd
Ratio Formula 2015 2016 2017 2015 2016 2017
Return on
assets
Net income / Total
assets 9.17 7.05 7.67 -26.53 -19.36 -22.14
ROA in terms of profitability
It is a profitability ratio that measures the company’s net income generation capability
from the sales of the company. it is the net income ratio available after tax as compared to
total assets of the company. To be more specific, ROA is the efficiency metric that explains
the efficiency of the company with regard to usage of its assets for generating the profits
(Alghifari, Triharjono & Juhaeni, 2013). The percentage of the assets varies from industry to
industry, however, higher level of ROA is considered better for any company. it creates a
problem where the ROA of the company falls, however, the analysts and investors shall keep
in mind the fact that ROA does not takes into consideration the outstanding liabilities of the
company and may state higher profit than the actual.
Data analysis using DES
It is observed from the ROA of both the companies that the ratio of Nano Tek has no
specific trend and it reduced to 7.05% in 2016 from 9.17% in 2015. However, the company
was able to increase the ratio to 7.67% in 2017 from 7.05% in 2016 (Advance Nanotek
Limited, 2018). On the contrary, the return on assets for Sci Dev for all the 3 years that is
2015, 2016 and 2017 is in negative. The reason behind this is that for all the 3 years the net
Paraphrase This Document
Need a fresh take? Get an instant paraphrase of this document with our AI Paraphraser
4ACCOUNTING FOR MANAGERS
income of the company was negative. Therefore, the ROA of Nano Tek is significantly better
as compared to that of Sci Dev (Sci Dev Limited, 2018).
ROA states the money earned by the company against each dollar of the assets.
Therefore, the company prefers higher level of ROA that signifies that the company is
operating its business more efficiently and more profitably. ROA is also measured to evaluate
the asset-intensive status of the company (Cook & Glass, 2014). If it is identified that the
company has higher ROA it will signify that the company is less asset intensive. On the other
hand, if the company has lower ROA it will signify that the company is highly asset-
intensive. However, ROA is considered as a useful metric to compare between two or more
companies rather than comparing it with the previous year’s result of the company. Further,
ROA is useful tool to the analysts for analysing the performance of the company against
another company. As it is used to compare the performance of companies it is considered as
an important tool to the analysts and investors (Grant, 2016).
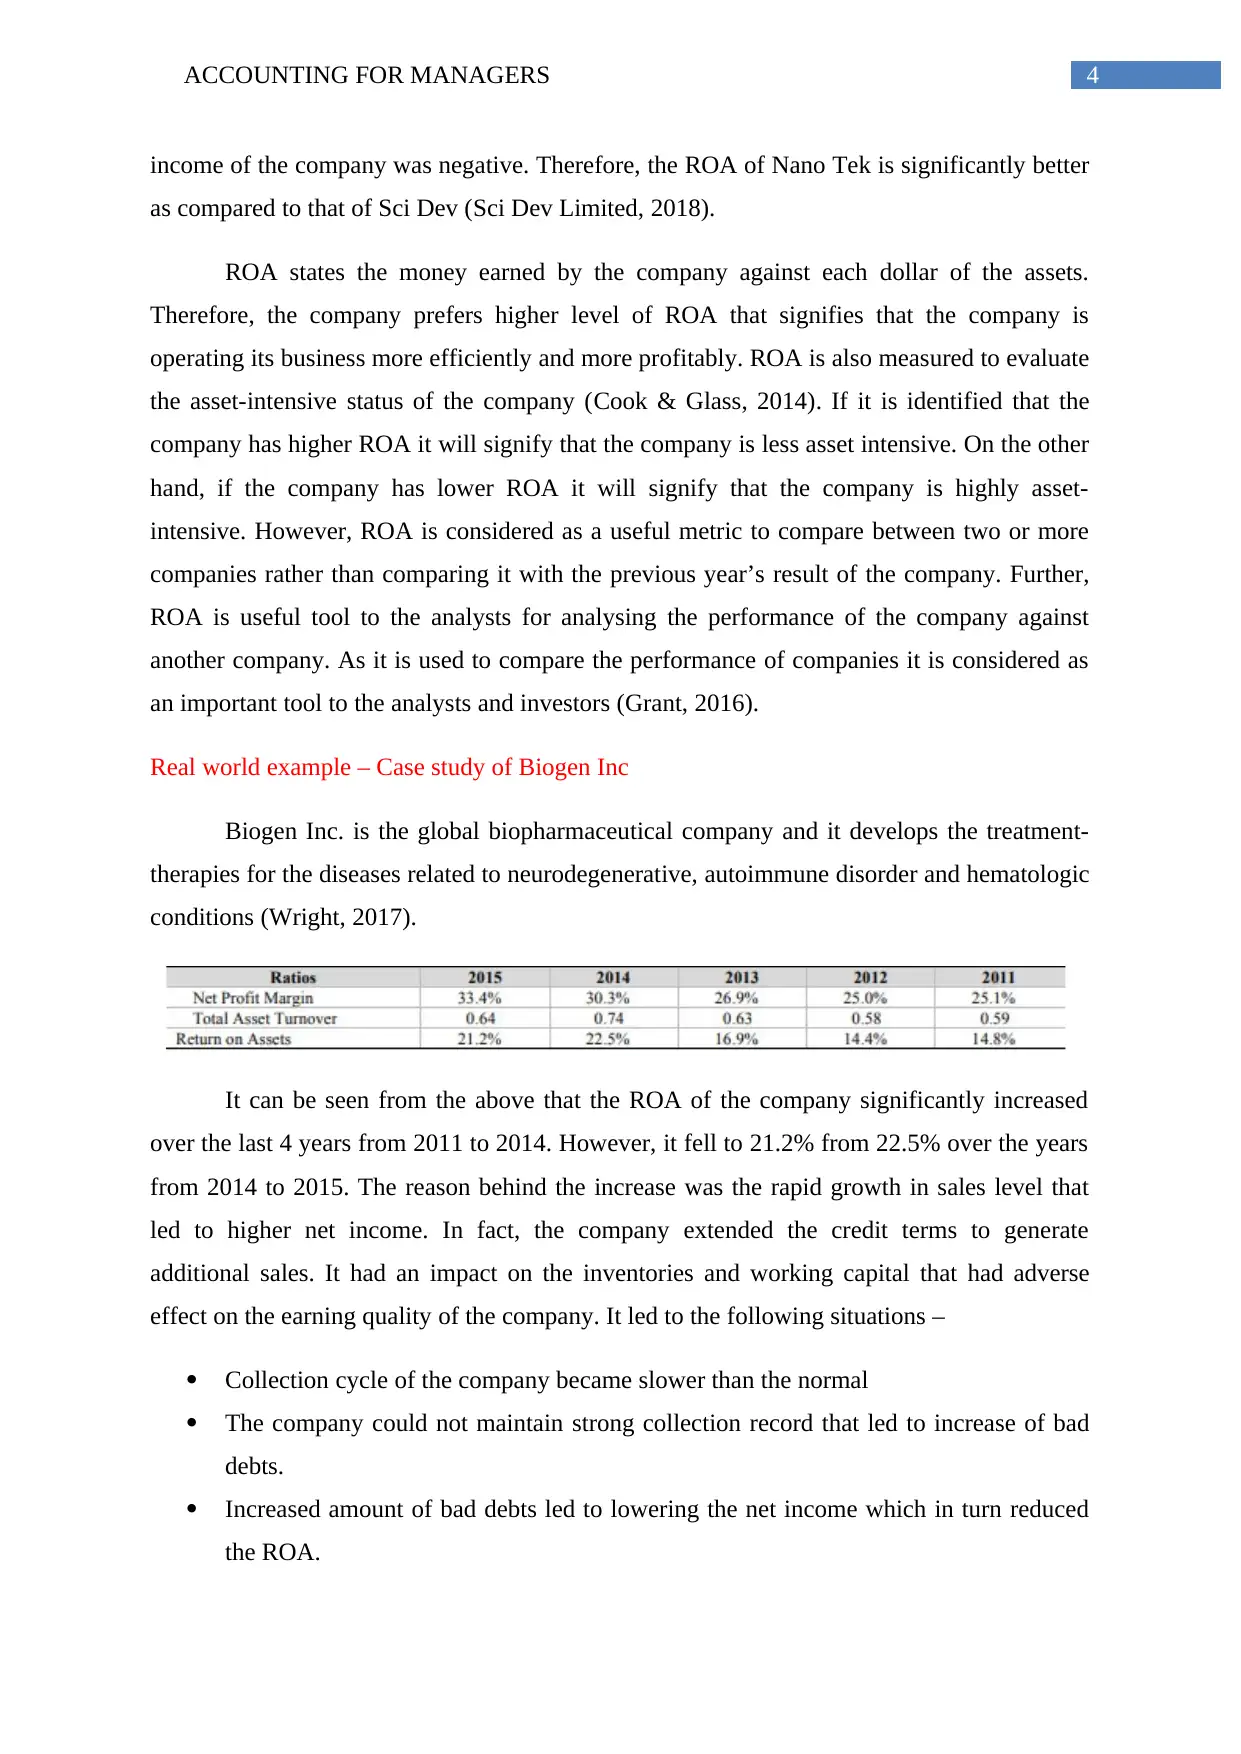
Real world example – Case study of Biogen Inc
Biogen Inc. is the global biopharmaceutical company and it develops the treatment-
therapies for the diseases related to neurodegenerative, autoimmune disorder and hematologic
conditions (Wright, 2017).
It can be seen from the above that the ROA of the company significantly increased
over the last 4 years from 2011 to 2014. However, it fell to 21.2% from 22.5% over the years
from 2014 to 2015. The reason behind the increase was the rapid growth in sales level that
led to higher net income. In fact, the company extended the credit terms to generate
additional sales. It had an impact on the inventories and working capital that had adverse
effect on the earning quality of the company. It led to the following situations –
Collection cycle of the company became slower than the normal
The company could not maintain strong collection record that led to increase of bad
debts.
Increased amount of bad debts led to lowering the net income which in turn reduced
the ROA.
income of the company was negative. Therefore, the ROA of Nano Tek is significantly better
as compared to that of Sci Dev (Sci Dev Limited, 2018).
ROA states the money earned by the company against each dollar of the assets.
Therefore, the company prefers higher level of ROA that signifies that the company is
operating its business more efficiently and more profitably. ROA is also measured to evaluate
the asset-intensive status of the company (Cook & Glass, 2014). If it is identified that the
company has higher ROA it will signify that the company is less asset intensive. On the other
hand, if the company has lower ROA it will signify that the company is highly asset-
intensive. However, ROA is considered as a useful metric to compare between two or more
companies rather than comparing it with the previous year’s result of the company. Further,
ROA is useful tool to the analysts for analysing the performance of the company against
another company. As it is used to compare the performance of companies it is considered as
an important tool to the analysts and investors (Grant, 2016).
Real world example – Case study of Biogen Inc
Biogen Inc. is the global biopharmaceutical company and it develops the treatment-
therapies for the diseases related to neurodegenerative, autoimmune disorder and hematologic
conditions (Wright, 2017).
It can be seen from the above that the ROA of the company significantly increased
over the last 4 years from 2011 to 2014. However, it fell to 21.2% from 22.5% over the years
from 2014 to 2015. The reason behind the increase was the rapid growth in sales level that
led to higher net income. In fact, the company extended the credit terms to generate
additional sales. It had an impact on the inventories and working capital that had adverse
effect on the earning quality of the company. It led to the following situations –
Collection cycle of the company became slower than the normal
The company could not maintain strong collection record that led to increase of bad
debts.
Increased amount of bad debts led to lowering the net income which in turn reduced
the ROA.
5ACCOUNTING FOR MANAGERS
Though it is tough to recommend any action under this situation and further
information is required before recommending anything, it is suggested that the company
should have ensured that it is recording the sales as per the requirement of GAAP and
booking the sales accruals on the account (Wright, 2017).
Answer (c)
Resources and wealth measurement with the profits and assets of the company
ROA is the type of return on the investment that is used to measure the company’s
profitability as compared to the total assets of the company. It indicates the efficiency of the
company through comparing its profit generating efficiency as compared to the capital
invested in the assets. Higher return signifies that the company is more productive and the
management is more efficient is using the economic resources (Graves & Shan, 2014). On the
other hand, profit states the amount left with the company after paying off the expenses of the
company. Further, it is stated for reducing the liabilities of the company and increasing its
assets. Profit also signifies the resources available with the company for the purpose of
investment (Heikal, Khaddafi & Ummah, 2014). On the other hand, the assets that include the
cash, receivables, tangible assets like building, land and property signifies the wealth of the
company. the total assets of the company used for creating present income or the asset that is
potential to generate future income also includes the natural resources and human capital.
However, the money and securities are not included as these are the claims to the wealth (Li,
2015).
Limitation of ROA
Misleading – ROA can be misleading if analyzed without proper context. Various
industries are asset-intensive and require large amount of investment for inventories,
facilities or equipment for proper functioning. Therefore, if the net income is
compared to the total assets of the company it will definitely look less profitable as
compared to the company that is less assets intensive. Therefore, if the investor uses
this metric it may mislead him as the company will look less profitable (Muhammad
& Scrimgeour, 2014).
Net profit base – for calculating the ROA, net profit is taken as the base. However,
different companies may use different approach to calculate net profit. Moreover, the
net profit may be manipulated to show the business as more profitable than actually it
⊘ This is a preview!⊘
Do you want full access?
Subscribe today to unlock all pages.
Trusted by 1+ million students worldwide
6ACCOUNTING FOR MANAGERS
is. Therefore, ROA shall not be only considerable metric for the purpose of
investment (Niresh & Thirunavukkarasu, 2014).
Borrowings – it only takes into consideration the assets of the company and ignores
the borrowed capital that may have in the balance sheet of the company. Generally the
capital structure any company includes equity as well as debt. Therefore, considering
ROA metric solely will mislead the investor as the borrowed fund also plays
important role in making decisions related to investment (Xiang, Worthington &
Higgs, 2015).
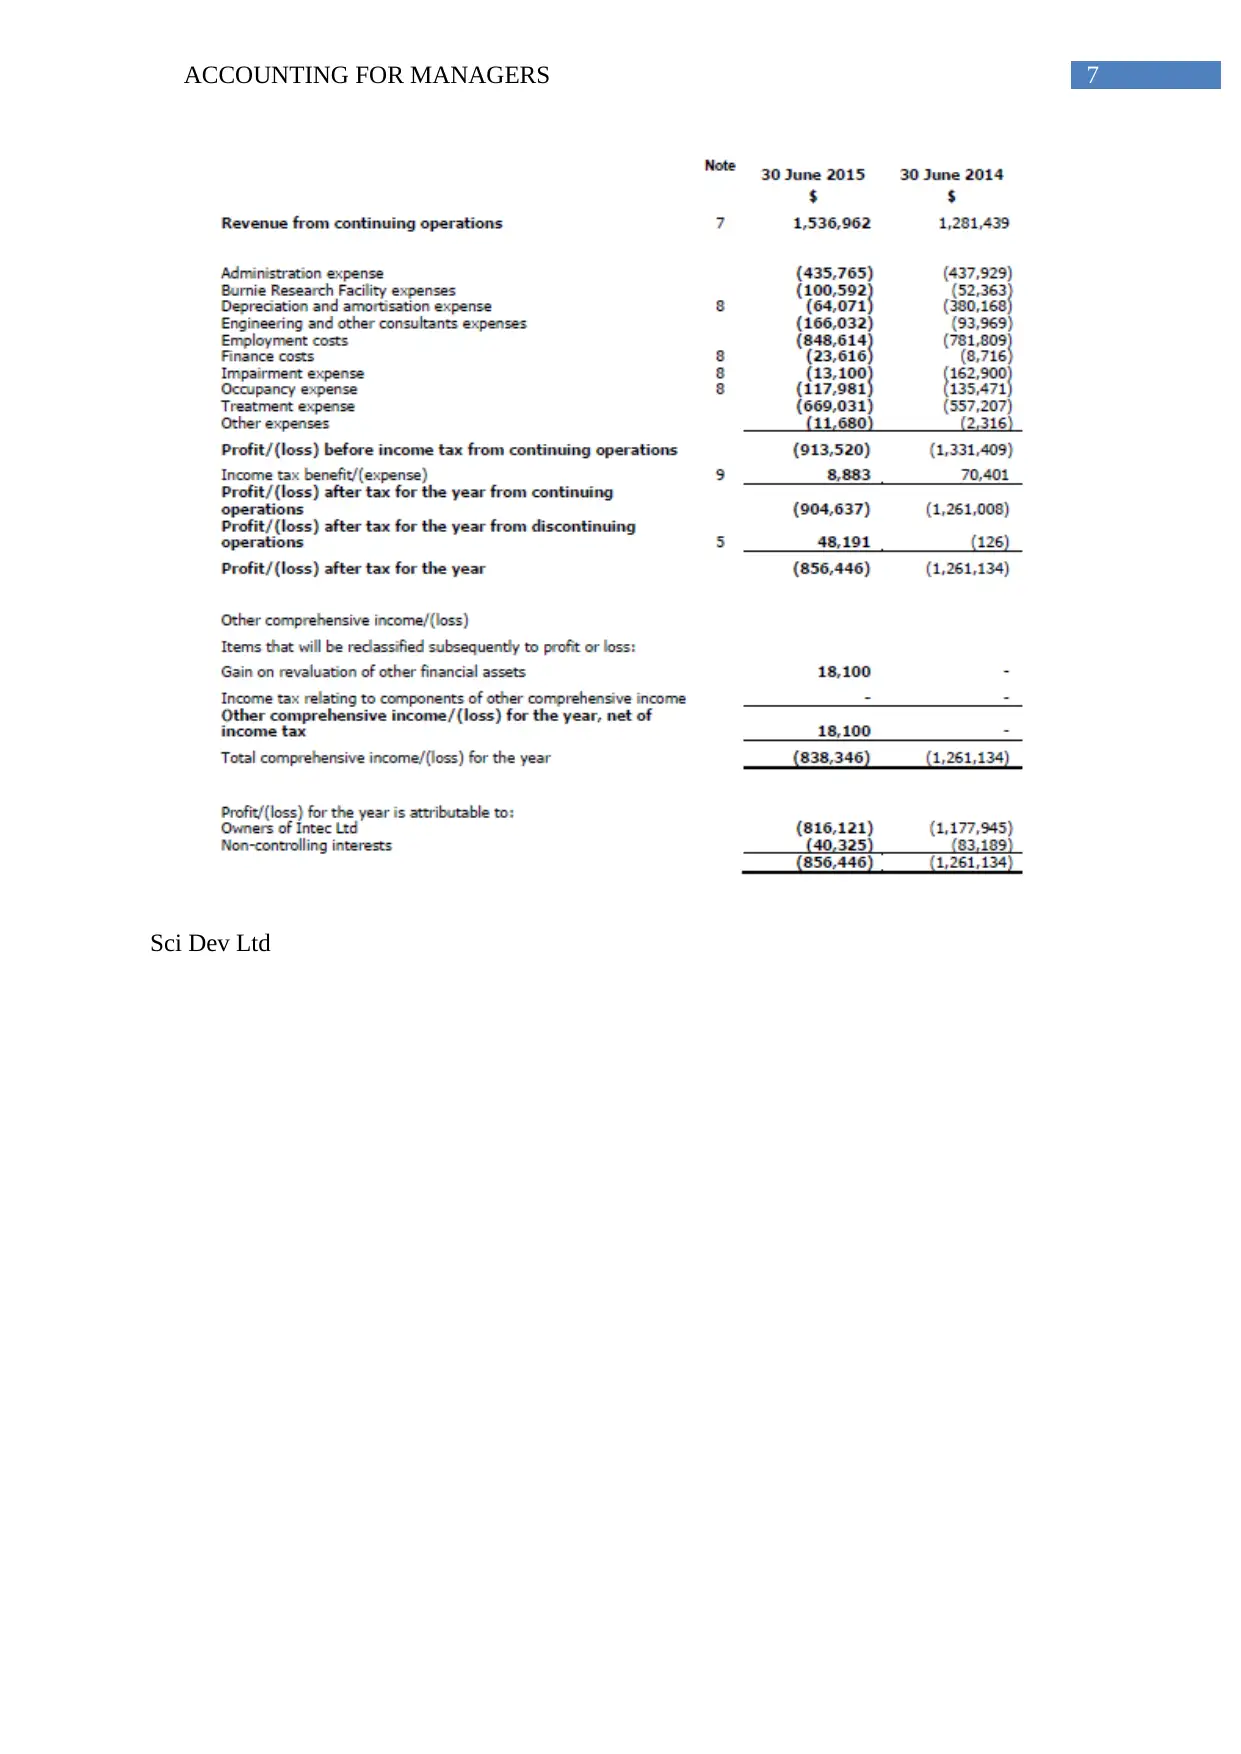
Incorporating above mentioned limitations in comparing the companies
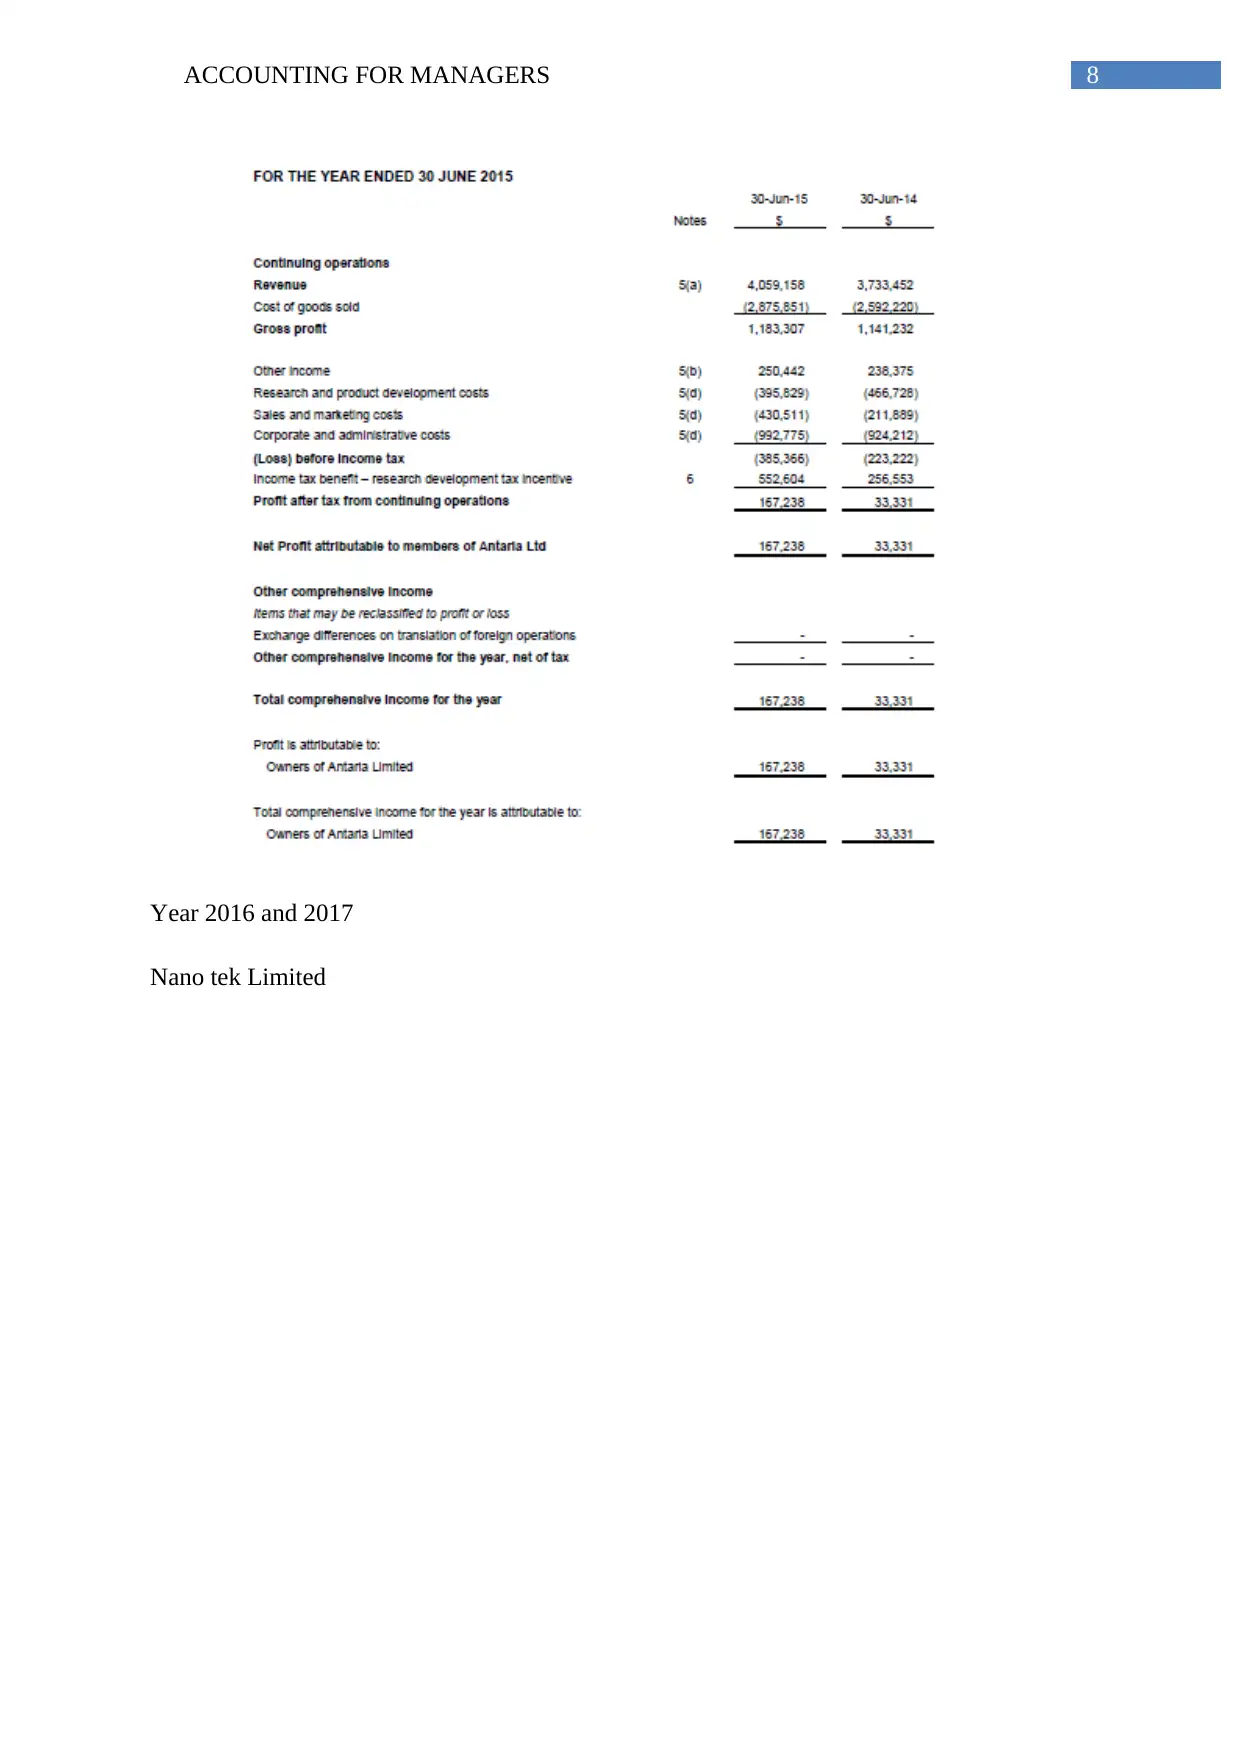
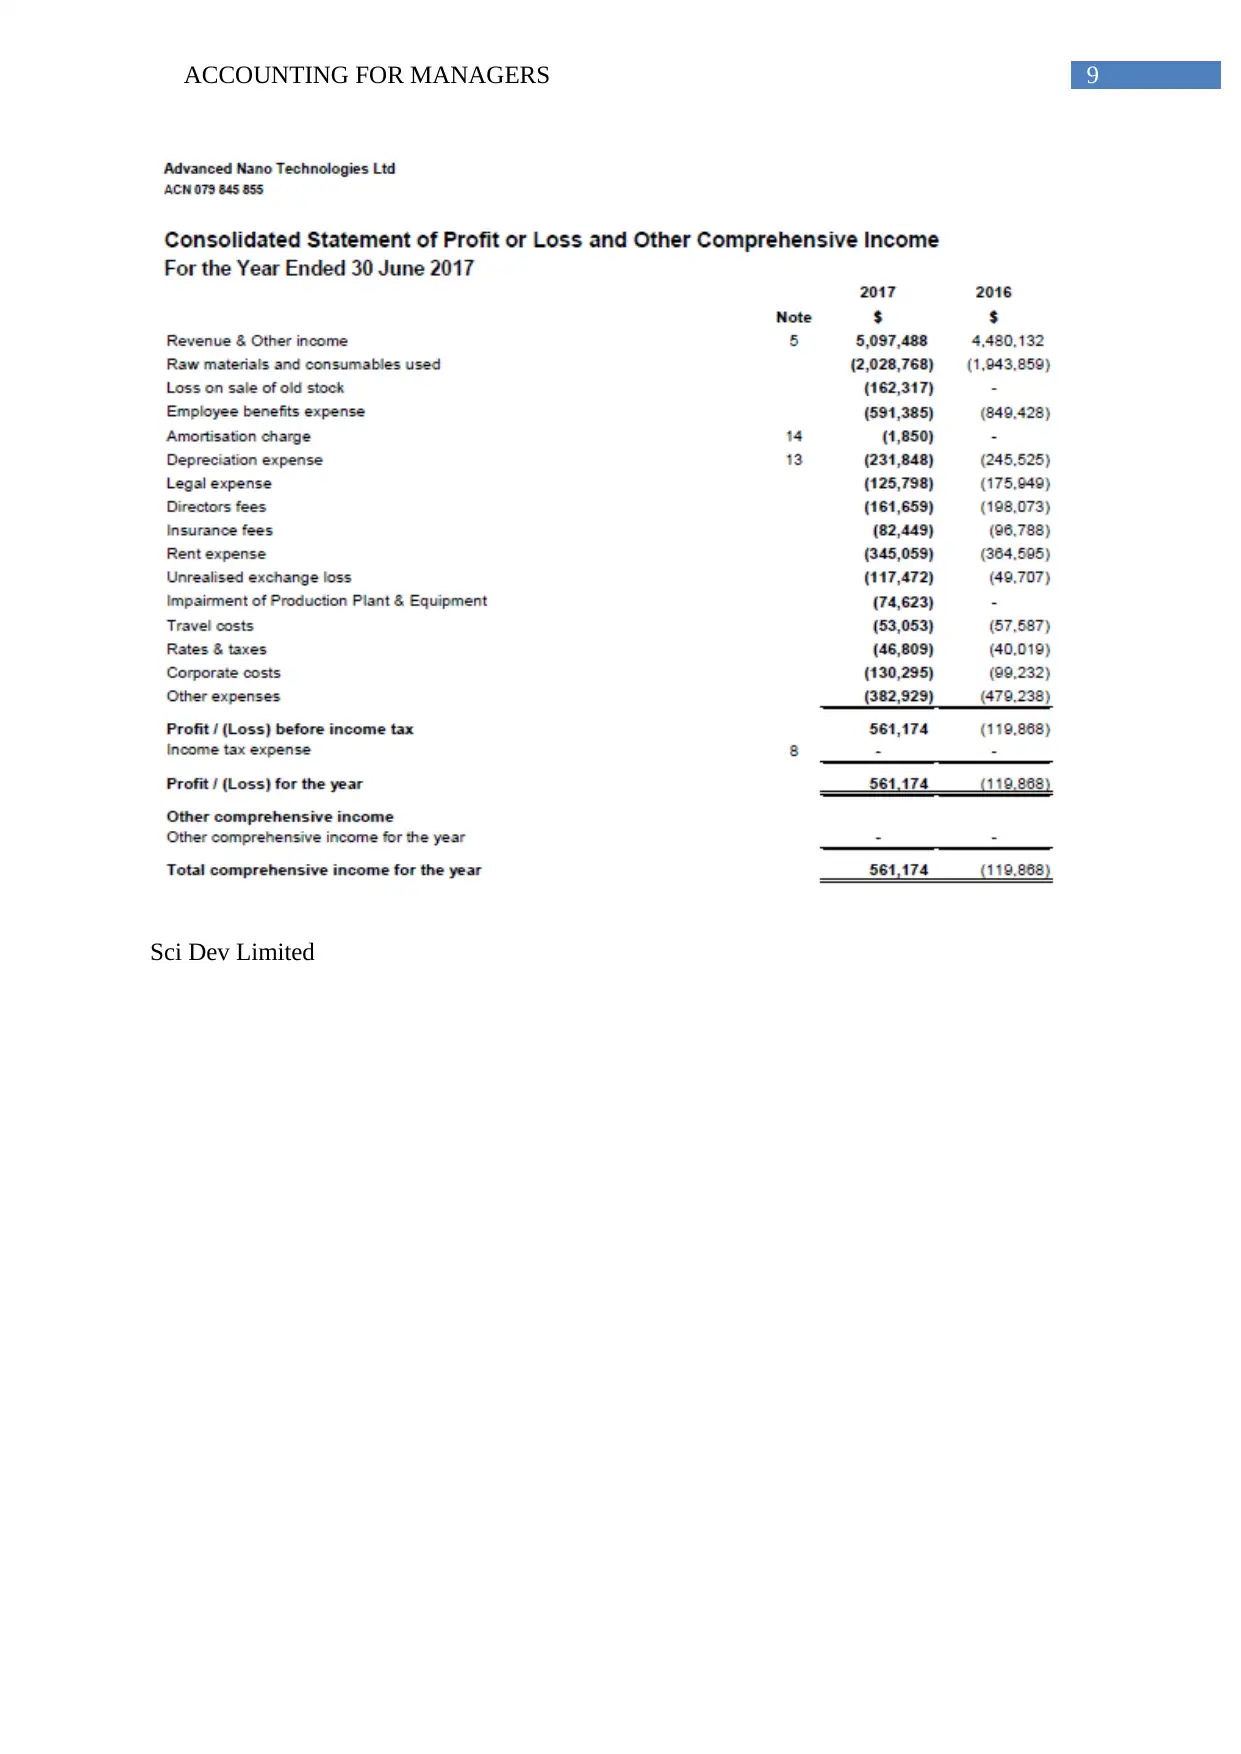
It can be identified that both the companies are using different methods for computing
the net income. Nano Tek is using the form of stating all the incomes and expenses together
and finally the positive or negative result signifies that whether the company has positive
income or negative income (Advance Nanotek Limited, 2018). On the contrary, Sci Dev
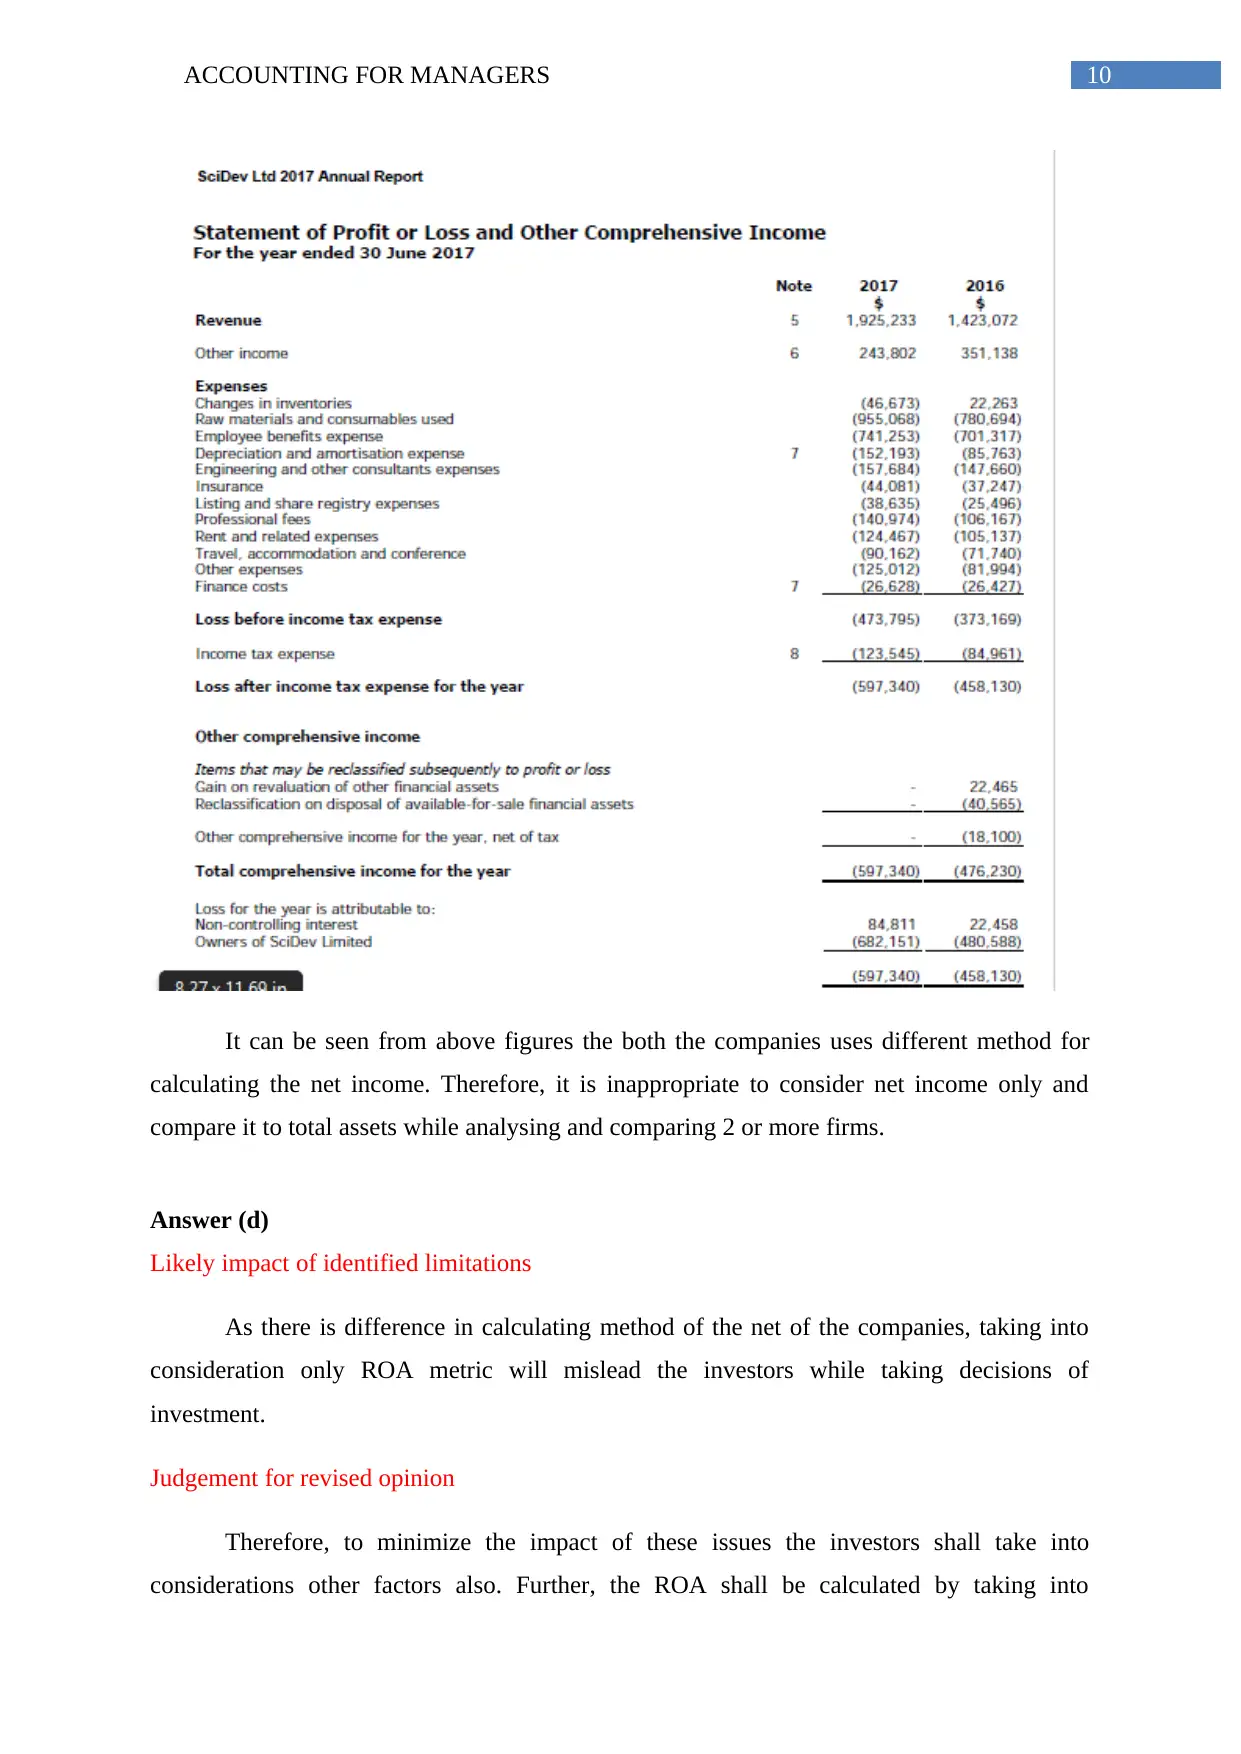
presents the income statement as revenue less expenses that gives the amount of net profit or
loss (Sci Dev Limited 2018).
For 2015
Nano Tek Limited
is. Therefore, ROA shall not be only considerable metric for the purpose of
investment (Niresh & Thirunavukkarasu, 2014).
Borrowings – it only takes into consideration the assets of the company and ignores
the borrowed capital that may have in the balance sheet of the company. Generally the
capital structure any company includes equity as well as debt. Therefore, considering
ROA metric solely will mislead the investor as the borrowed fund also plays
important role in making decisions related to investment (Xiang, Worthington &
Higgs, 2015).
Incorporating above mentioned limitations in comparing the companies
It can be identified that both the companies are using different methods for computing
the net income. Nano Tek is using the form of stating all the incomes and expenses together
and finally the positive or negative result signifies that whether the company has positive
income or negative income (Advance Nanotek Limited, 2018). On the contrary, Sci Dev
presents the income statement as revenue less expenses that gives the amount of net profit or
loss (Sci Dev Limited 2018).
For 2015
Nano Tek Limited
Paraphrase This Document
Need a fresh take? Get an instant paraphrase of this document with our AI Paraphraser
7ACCOUNTING FOR MANAGERS
Sci Dev Ltd
Sci Dev Ltd
8ACCOUNTING FOR MANAGERS
Year 2016 and 2017
Nano tek Limited
Year 2016 and 2017
Nano tek Limited
⊘ This is a preview!⊘
Do you want full access?
Subscribe today to unlock all pages.
Trusted by 1+ million students worldwide
9ACCOUNTING FOR MANAGERS
Sci Dev Limited
Sci Dev Limited
Paraphrase This Document
Need a fresh take? Get an instant paraphrase of this document with our AI Paraphraser
10ACCOUNTING FOR MANAGERS
It can be seen from above figures the both the companies uses different method for
calculating the net income. Therefore, it is inappropriate to consider net income only and
compare it to total assets while analysing and comparing 2 or more firms.
Answer (d)
Likely impact of identified limitations
As there is difference in calculating method of the net of the companies, taking into
consideration only ROA metric will mislead the investors while taking decisions of
investment.
Judgement for revised opinion
Therefore, to minimize the impact of these issues the investors shall take into
considerations other factors also. Further, the ROA shall be calculated by taking into
11ACCOUNTING FOR MANAGERS
considerations the liabilities also that is subtracting the liabilities from total assets or the net
assets of the company. it will give the true picture of the company and the investors will be
able to take appropriate decisions.
Reference
Advance Nanotek Limited. (2018). Antaria.com. Retrieved 6 May 2018, from
http://www.antaria.com/IRM/content/default.aspx
Alghifari, S., Triharjono, S., & Juhaeni, Y. (2013). Effect of return on assets (ROA) against
Tobin's Q: Studies in food and beverage company in Indonesia stock exchange years
2007-2011. International Journal Of Science and Research (IJSR), 2, 108-116.
Cook, A., & Glass, C. (2014). Women and top leadership positions: Towards an institutional
analysis. Gender, Work & Organization, 21(1), 91-103.
Grant, R. M. (2016). Contemporary strategy analysis: Text and cases edition. John Wiley &
Sons.
Graves, C., & Shan, Y. G. (2014). An empirical analysis of the effect of internationalization
on the performance of unlisted family and nonfamily firms in Australia. Family
Business Review, 27(2), 142-160.
Graves, C., & Shan, Y. G. (2014). An empirical analysis of the effect of internationalization
on the performance of unlisted family and nonfamily firms in Australia. Family
Business Review, 27(2), 142-160.
Heikal, M., Khaddafi, M., & Ummah, A. (2014). Influence analysis of return on assets
(ROA), return on equity (ROE), net profit margin (NPM), debt to equity ratio (DER),
and current ratio (CR), against corporate profit growth in automotive in Indonesia
Stock Exchange. International Journal of Academic Research in Business and Social
Sciences, 4(12), 101.
Li, X. (2015). Accounting conservatism and the cost of capital: An international
analysis. Journal of Business Finance & Accounting, 42(5-6), 555-582.
Muhammad, N., & Scrimgeour, F. (2014). Stock returns and fundamentals in the Australian
market. Asian Journal of Finance & Accounting, 6(1), 271-290.
⊘ This is a preview!⊘
Do you want full access?
Subscribe today to unlock all pages.
Trusted by 1+ million students worldwide
1 out of 13
Your All-in-One AI-Powered Toolkit for Academic Success.
+13062052269
info@desklib.com
Available 24*7 on WhatsApp / Email
![[object Object]](/_next/static/media/star-bottom.7253800d.svg)
Unlock your academic potential
Copyright © 2020–2026 A2Z Services. All Rights Reserved. Developed and managed by ZUCOL.