Accounting for Managers Report: Project Analysis for Benetton Plc
VerifiedAdded on 2023/04/19
|15
|3442
|471
Report
AI Summary
This report, titled "Accounting for Managers," presents a comprehensive analysis of a project undertaken by Benetton Plc. The report begins with an overview of the payback period, net present value (NPV), and internal rate of return (IRR) calculations, providing insights into the project's financial viability. The payback period is determined to be approximately 1.26 years, and the NPV is calculated to be around £141,894. The IRR is calculated at 43%. The report then analyzes the project from Benetton Plc.'s perspective, emphasizing the importance of financial factors and investment appraisal techniques in decision-making. It discusses the strengths and weaknesses of each investment appraisal technique, highlighting how each method contributes to a complete evaluation of the project's potential. Part B of the report explores the impact of costs and cost behavior on the preparation of an organization's budget. It discusses the significance of variable and fixed costs, and how changes in macro-economic factors like interest rates and inflation influence cost structures. The report also covers the application of break-even analysis in decision-making, emphasizing the importance of effective cost control and budgetary planning for sustainable business growth.

Running head: ACCOUNTING FOR MANAGERS
Accounting for Managers
Name of the Student:
Name of the University:
Author’s Note:
Accounting for Managers
Name of the Student:
Name of the University:
Author’s Note:
Paraphrase This Document
Need a fresh take? Get an instant paraphrase of this document with our AI Paraphraser
1ACCOUNTING FOR MANAGERS
Table of Contents
Part A.........................................................................................................................................2
A) Payback Period for the Project....................................................................................2
B) Net Present Value of the Project.................................................................................2
C) Internal Rate of Return of the Project..........................................................................2
D) Analysis of Project from the viewpoint of Benetton Plc.............................................3
E) Strength and Weakness of the Investment Appraisal Techniques Applied in the
evaluation of the project.........................................................................................................4
Part B..........................................................................................................................................7
A) Costs and Cost Behaviour Impact on the preparation of Organisation Budget...........7
B) Application of Break-even Analysis in the context of decision making.....................8
Reference..................................................................................................................................12
2ACCOUNTING FOR MANAGERS
Part A
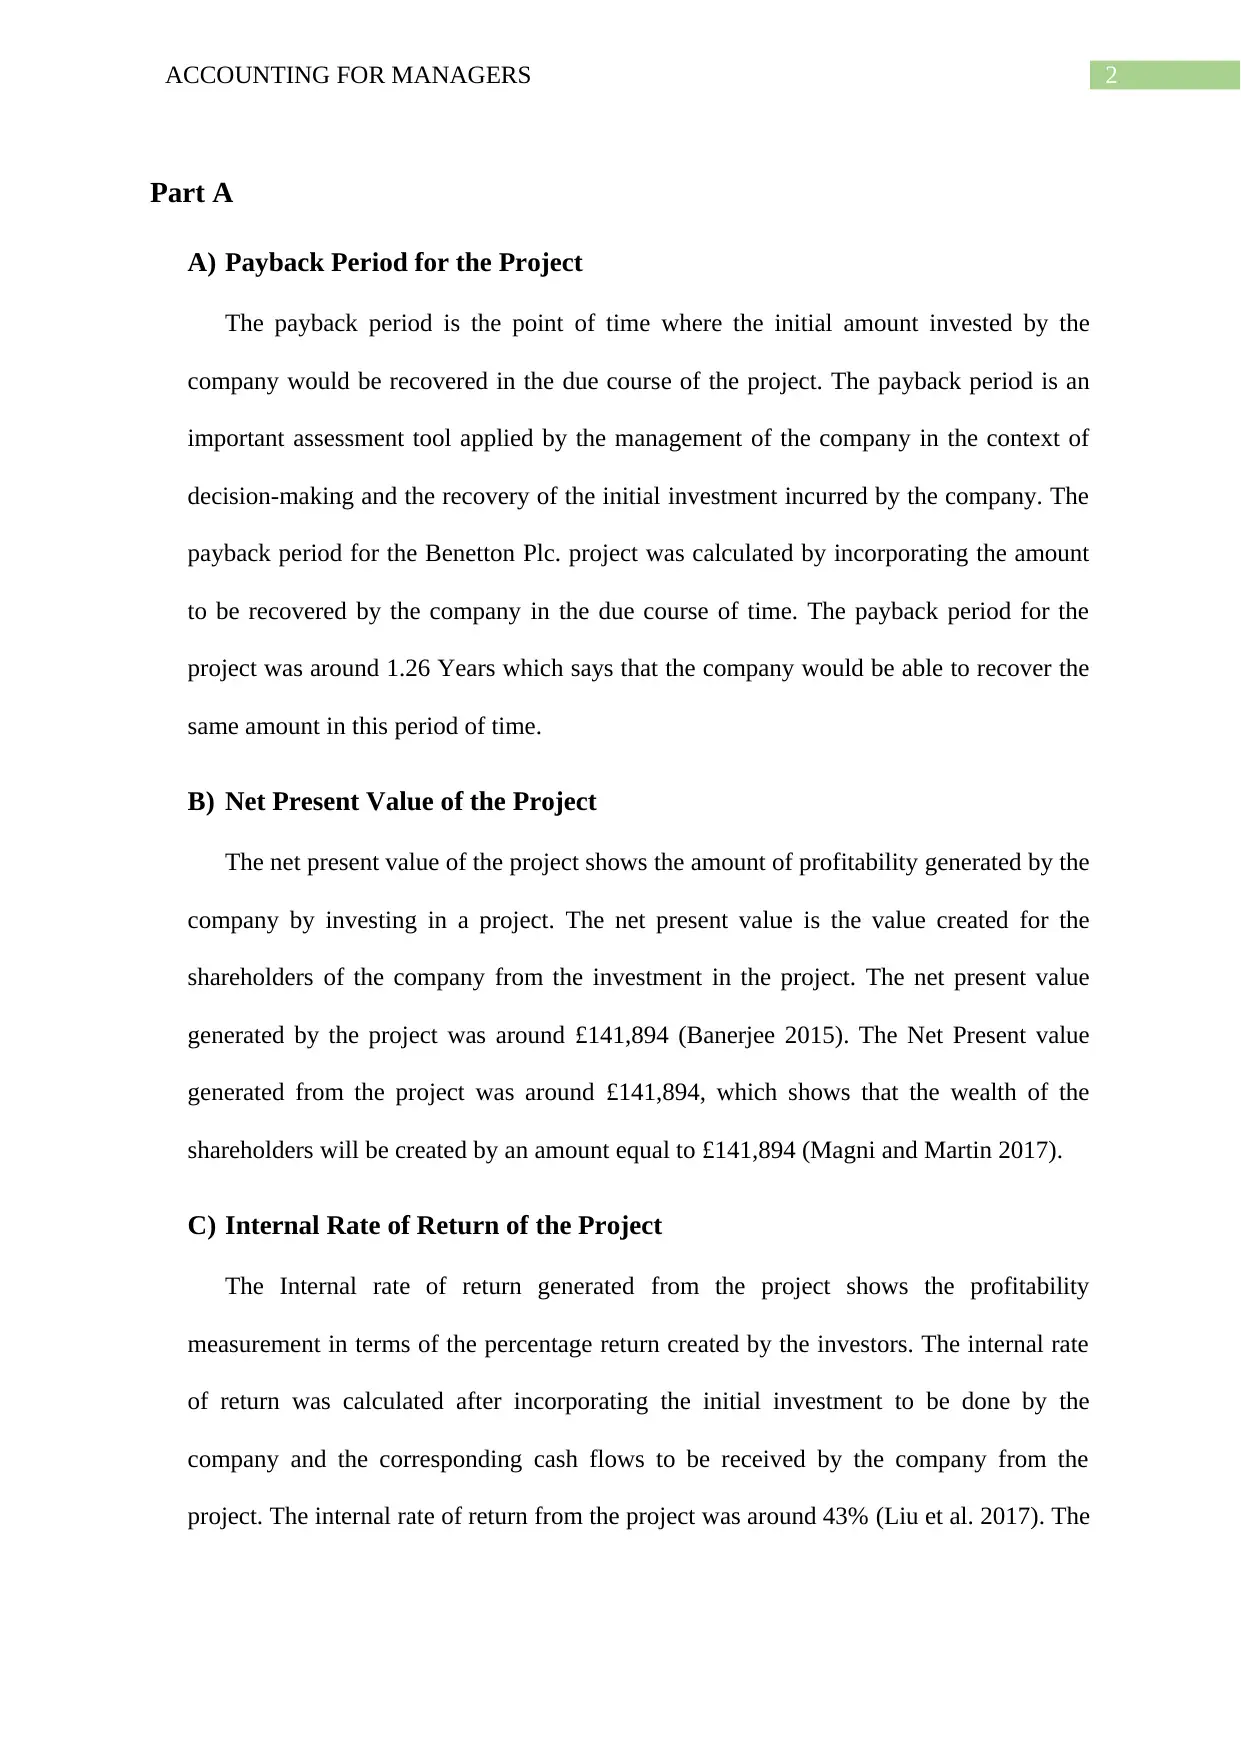
A) Payback Period for the Project
The payback period is the point of time where the initial amount invested by the
company would be recovered in the due course of the project. The payback period is an
important assessment tool applied by the management of the company in the context of
decision-making and the recovery of the initial investment incurred by the company. The
payback period for the Benetton Plc. project was calculated by incorporating the amount
to be recovered by the company in the due course of time. The payback period for the
project was around 1.26 Years which says that the company would be able to recover the
same amount in this period of time.
B) Net Present Value of the Project
The net present value of the project shows the amount of profitability generated by the
company by investing in a project. The net present value is the value created for the
shareholders of the company from the investment in the project. The net present value
generated by the project was around £141,894 (Banerjee 2015). The Net Present value
generated from the project was around £141,894, which shows that the wealth of the
shareholders will be created by an amount equal to £141,894 (Magni and Martin 2017).
C) Internal Rate of Return of the Project
The Internal rate of return generated from the project shows the profitability
measurement in terms of the percentage return created by the investors. The internal rate
of return was calculated after incorporating the initial investment to be done by the
company and the corresponding cash flows to be received by the company from the
project. The internal rate of return from the project was around 43% (Liu et al. 2017). The
Part A
A) Payback Period for the Project
The payback period is the point of time where the initial amount invested by the
company would be recovered in the due course of the project. The payback period is an
important assessment tool applied by the management of the company in the context of
decision-making and the recovery of the initial investment incurred by the company. The
payback period for the Benetton Plc. project was calculated by incorporating the amount
to be recovered by the company in the due course of time. The payback period for the
project was around 1.26 Years which says that the company would be able to recover the
same amount in this period of time.
B) Net Present Value of the Project
The net present value of the project shows the amount of profitability generated by the
company by investing in a project. The net present value is the value created for the
shareholders of the company from the investment in the project. The net present value
generated by the project was around £141,894 (Banerjee 2015). The Net Present value
generated from the project was around £141,894, which shows that the wealth of the
shareholders will be created by an amount equal to £141,894 (Magni and Martin 2017).
C) Internal Rate of Return of the Project
The Internal rate of return generated from the project shows the profitability
measurement in terms of the percentage return created by the investors. The internal rate
of return was calculated after incorporating the initial investment to be done by the
company and the corresponding cash flows to be received by the company from the
project. The internal rate of return from the project was around 43% (Liu et al. 2017). The
⊘ This is a preview!⊘
Do you want full access?
Subscribe today to unlock all pages.
Trusted by 1+ million students worldwide
3ACCOUNTING FOR MANAGERS
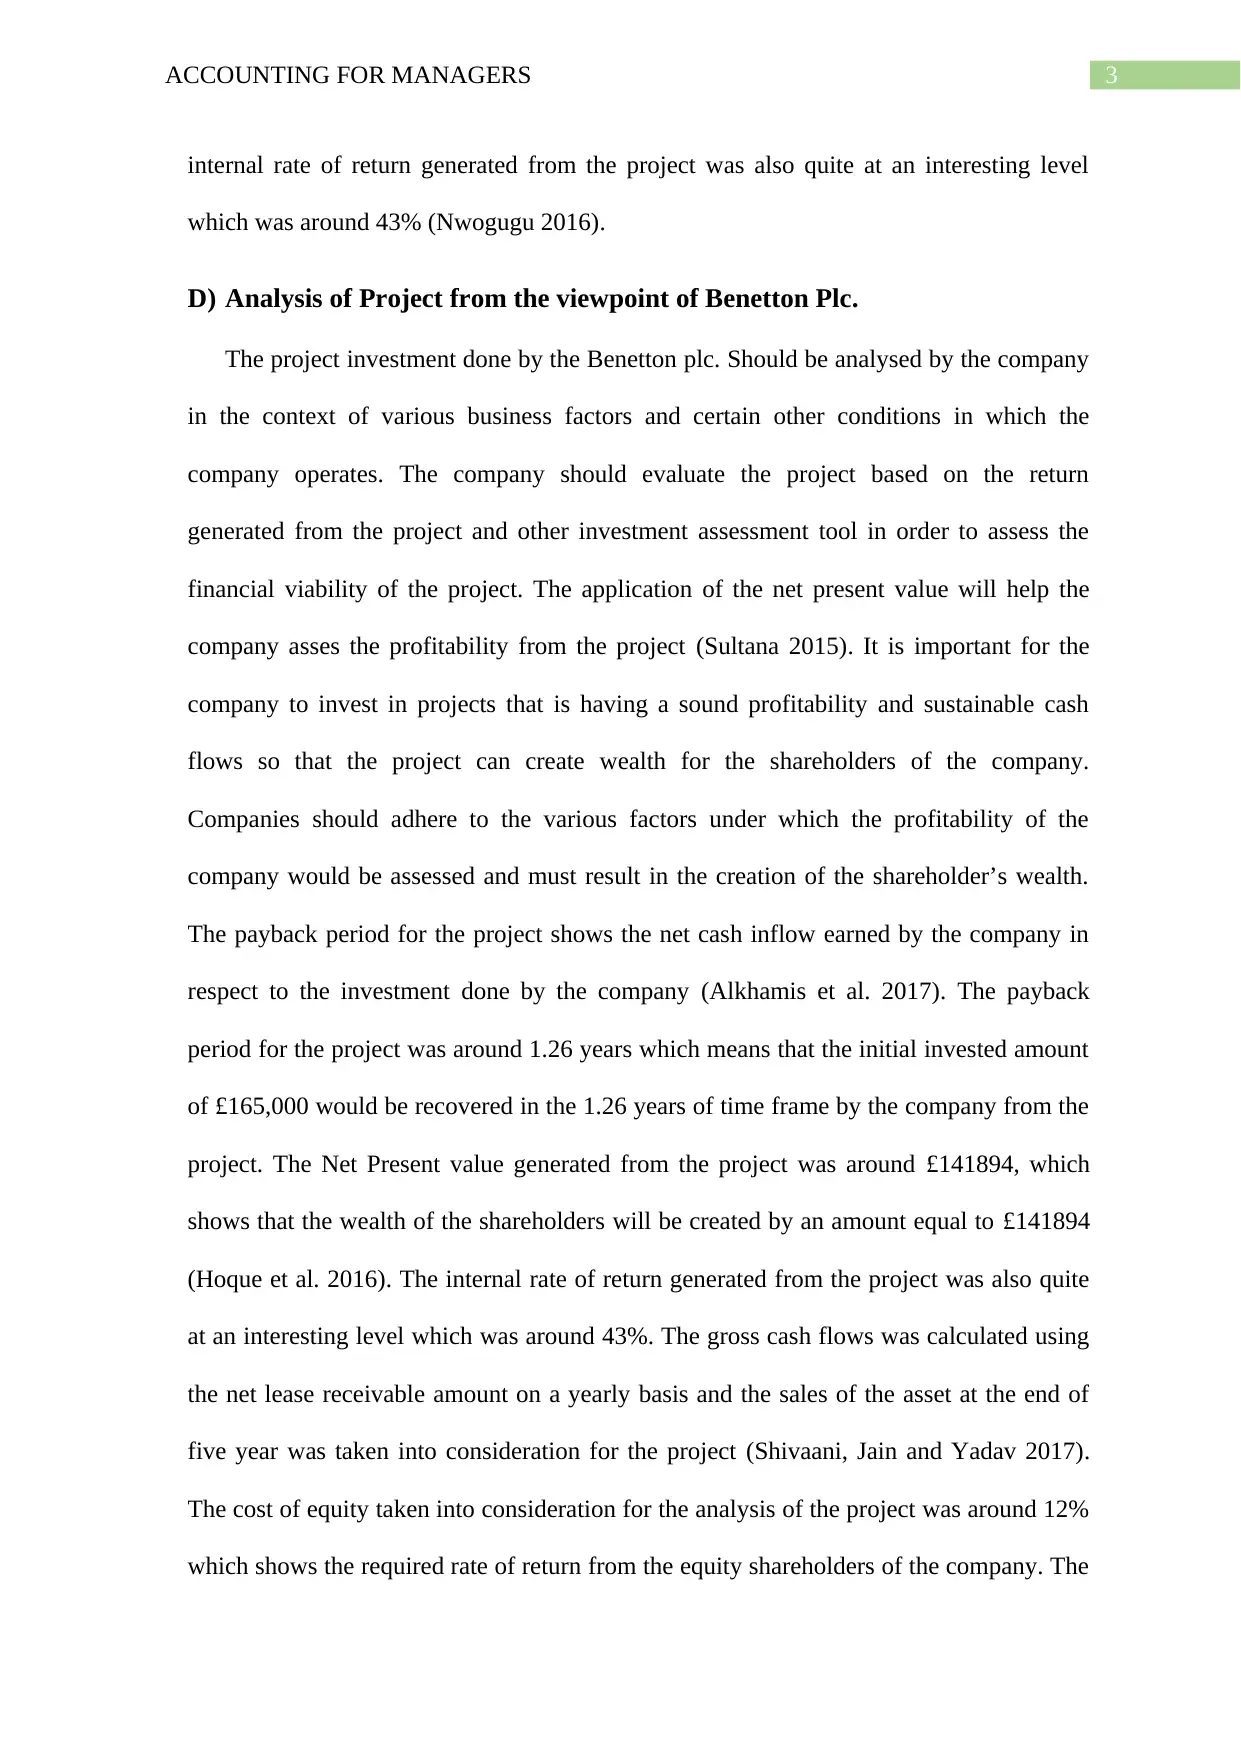
internal rate of return generated from the project was also quite at an interesting level
which was around 43% (Nwogugu 2016).
D) Analysis of Project from the viewpoint of Benetton Plc.
The project investment done by the Benetton plc. Should be analysed by the company
in the context of various business factors and certain other conditions in which the
company operates. The company should evaluate the project based on the return
generated from the project and other investment assessment tool in order to assess the
financial viability of the project. The application of the net present value will help the
company asses the profitability from the project (Sultana 2015). It is important for the
company to invest in projects that is having a sound profitability and sustainable cash
flows so that the project can create wealth for the shareholders of the company.
Companies should adhere to the various factors under which the profitability of the
company would be assessed and must result in the creation of the shareholder’s wealth.
The payback period for the project shows the net cash inflow earned by the company in
respect to the investment done by the company (Alkhamis et al. 2017). The payback
period for the project was around 1.26 years which means that the initial invested amount
of £165,000 would be recovered in the 1.26 years of time frame by the company from the
project. The Net Present value generated from the project was around £141894, which
shows that the wealth of the shareholders will be created by an amount equal to £141894
(Hoque et al. 2016). The internal rate of return generated from the project was also quite
at an interesting level which was around 43%. The gross cash flows was calculated using
the net lease receivable amount on a yearly basis and the sales of the asset at the end of
five year was taken into consideration for the project (Shivaani, Jain and Yadav 2017).
The cost of equity taken into consideration for the analysis of the project was around 12%
which shows the required rate of return from the equity shareholders of the company. The
Paraphrase This Document
Need a fresh take? Get an instant paraphrase of this document with our AI Paraphraser
4ACCOUNTING FOR MANAGERS
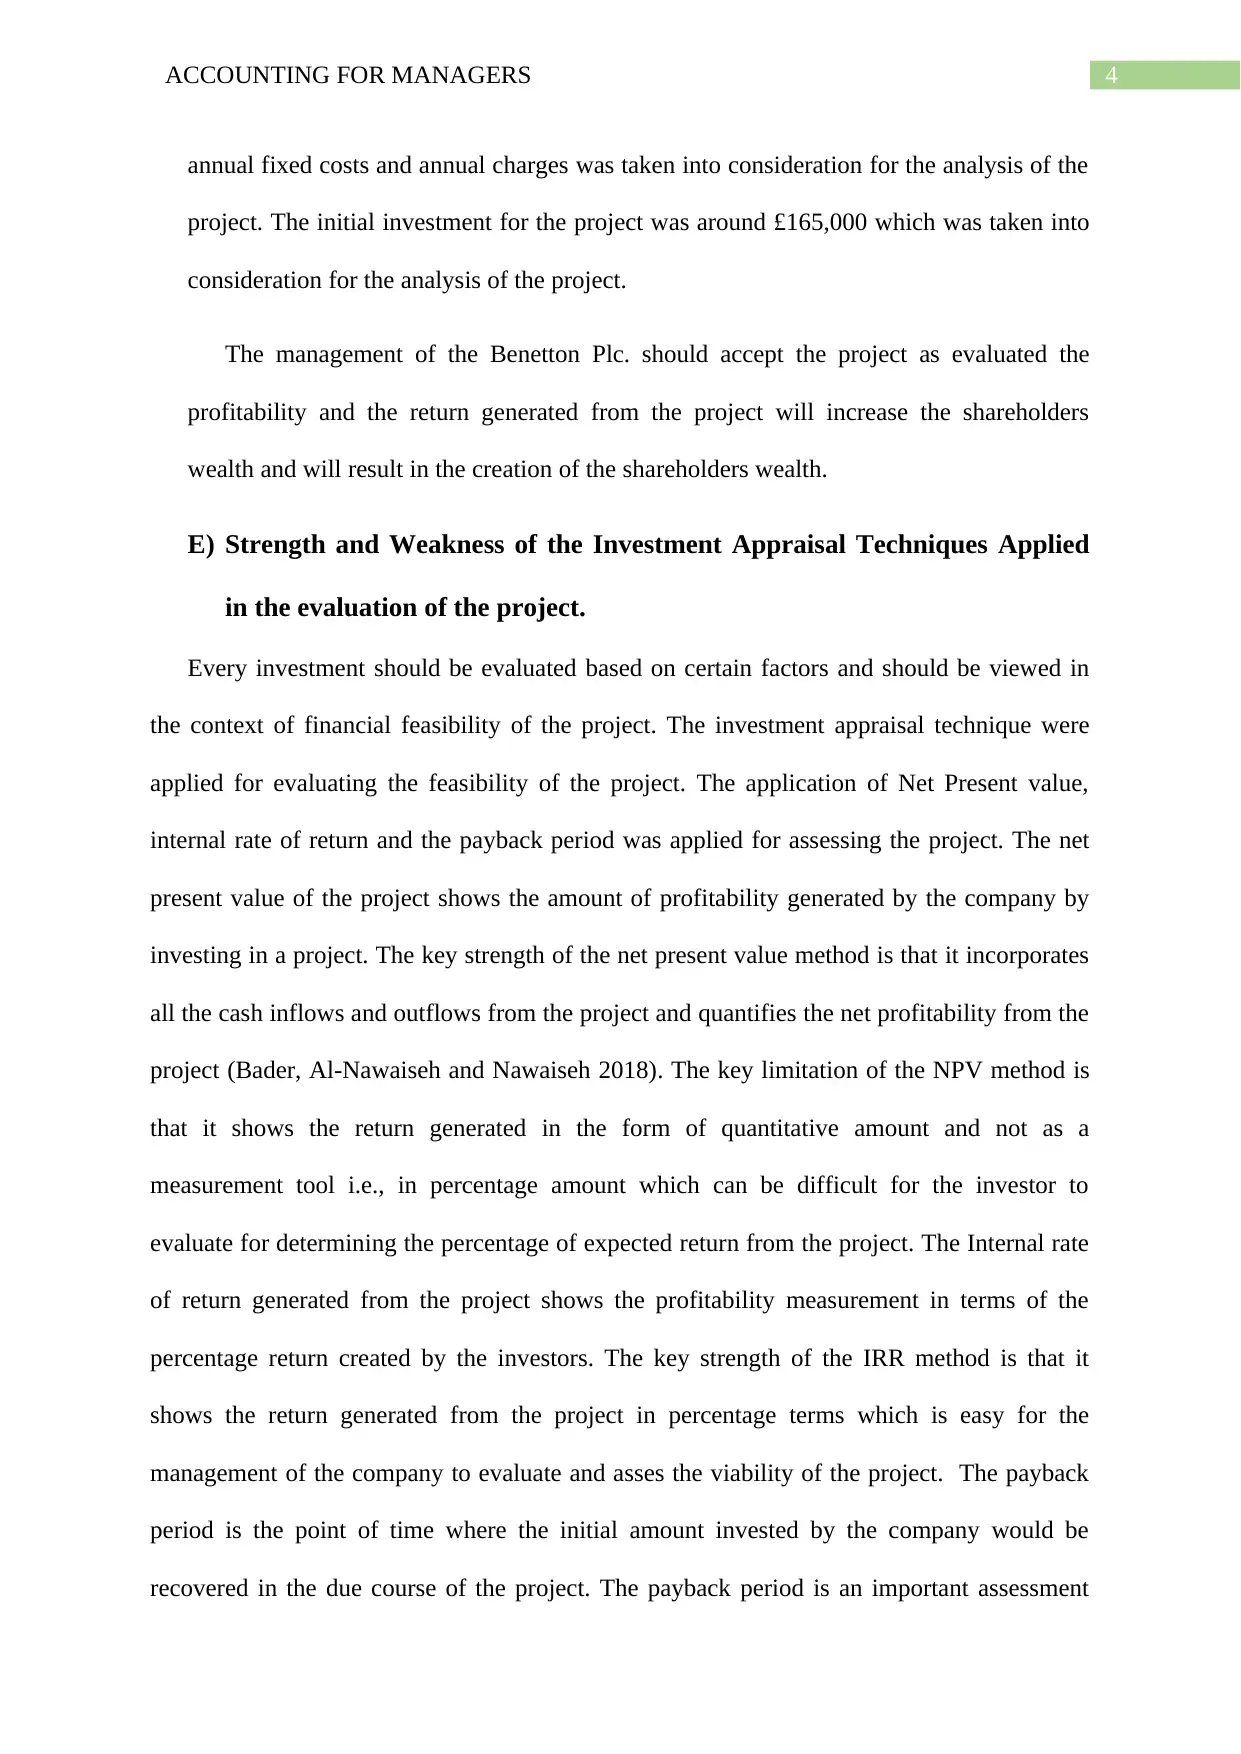
annual fixed costs and annual charges was taken into consideration for the analysis of the
project. The initial investment for the project was around £165,000 which was taken into
consideration for the analysis of the project.
The management of the Benetton Plc. should accept the project as evaluated the
profitability and the return generated from the project will increase the shareholders
wealth and will result in the creation of the shareholders wealth.
E) Strength and Weakness of the Investment Appraisal Techniques Applied
in the evaluation of the project.
Every investment should be evaluated based on certain factors and should be viewed in
the context of financial feasibility of the project. The investment appraisal technique were
applied for evaluating the feasibility of the project. The application of Net Present value,
internal rate of return and the payback period was applied for assessing the project. The net
present value of the project shows the amount of profitability generated by the company by
investing in a project. The key strength of the net present value method is that it incorporates
all the cash inflows and outflows from the project and quantifies the net profitability from the
project (Bader, Al-Nawaiseh and Nawaiseh 2018). The key limitation of the NPV method is
that it shows the return generated in the form of quantitative amount and not as a
measurement tool i.e., in percentage amount which can be difficult for the investor to
evaluate for determining the percentage of expected return from the project. The Internal rate
of return generated from the project shows the profitability measurement in terms of the
percentage return created by the investors. The key strength of the IRR method is that it
shows the return generated from the project in percentage terms which is easy for the
management of the company to evaluate and asses the viability of the project. The payback
period is the point of time where the initial amount invested by the company would be
recovered in the due course of the project. The payback period is an important assessment
5ACCOUNTING FOR MANAGERS
tool applied by the management of the company in the context of decision-making and the
recovery of the initial investment incurred by the company. The payback period shows the
recovery of the initial amount spend by the company in the due course of project. The key
strength is that it is easy for the management of the company to assess the recovery of the
initial amount in the due course of project (Ruegg and Short 2016). The key limitation of the
project is that it does not consider or takes time value of money into account thereby ignoring
the required return or the cost of equity for evaluation of the project. Thus in that case the
discounted payback period is a much more efficient tool than the payback period. Thus, every
investment tool assessed has its own strength and limitation and all were evaluated in context
of analysing the project.
⊘ This is a preview!⊘
Do you want full access?
Subscribe today to unlock all pages.
Trusted by 1+ million students worldwide
6ACCOUNTING FOR MANAGERS
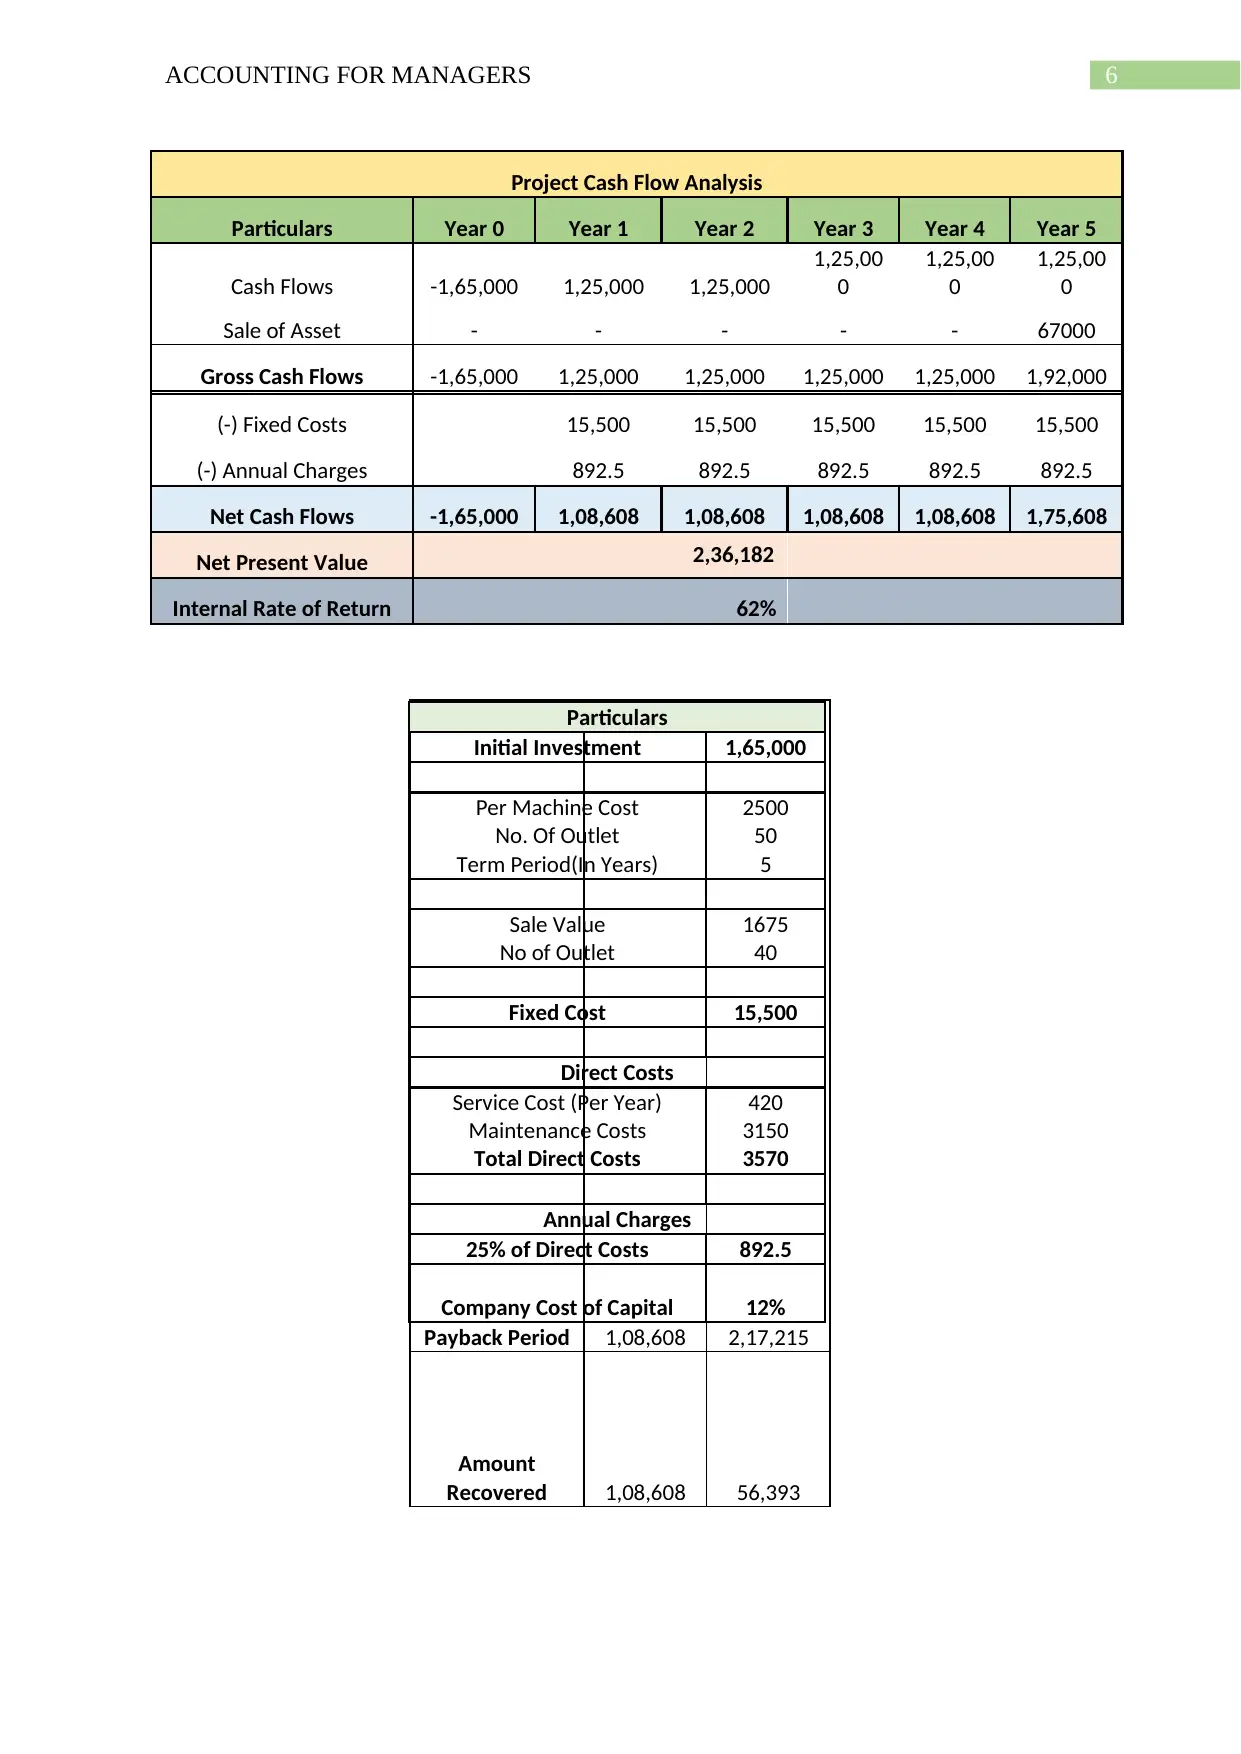
Project Cash Flow Analysis
Particulars Year 0 Year 1 Year 2 Year 3 Year 4 Year 5
Cash Flows -1,65,000 1,25,000 1,25,000
1,25,00
0
1,25,00
0
1,25,00
0
Sale of Asset - - - - - 67000
Gross Cash Flows -1,65,000 1,25,000 1,25,000 1,25,000 1,25,000 1,92,000
(-) Fixed Costs 15,500 15,500 15,500 15,500 15,500
(-) Annual Charges 892.5 892.5 892.5 892.5 892.5
Net Cash Flows -1,65,000 1,08,608 1,08,608 1,08,608 1,08,608 1,75,608
Net Present Value 2,36,182
Internal Rate of Return 62%
Payback Period 1,08,608 2,17,215
Amount
Recovered 1,08,608 56,393
Particulars
Initial Investment 1,65,000
Per Machine Cost 2500
No. Of Outlet 50
Term Period(In Years) 5
Sale Value 1675
No of Outlet 40
Fixed Cost 15,500
Direct Costs
Service Cost (Per Year) 420
Maintenance Costs 3150
Total Direct Costs 3570
Annual Charges
25% of Direct Costs 892.5
Company Cost of Capital 12%
Paraphrase This Document
Need a fresh take? Get an instant paraphrase of this document with our AI Paraphraser
7ACCOUNTING FOR MANAGERS
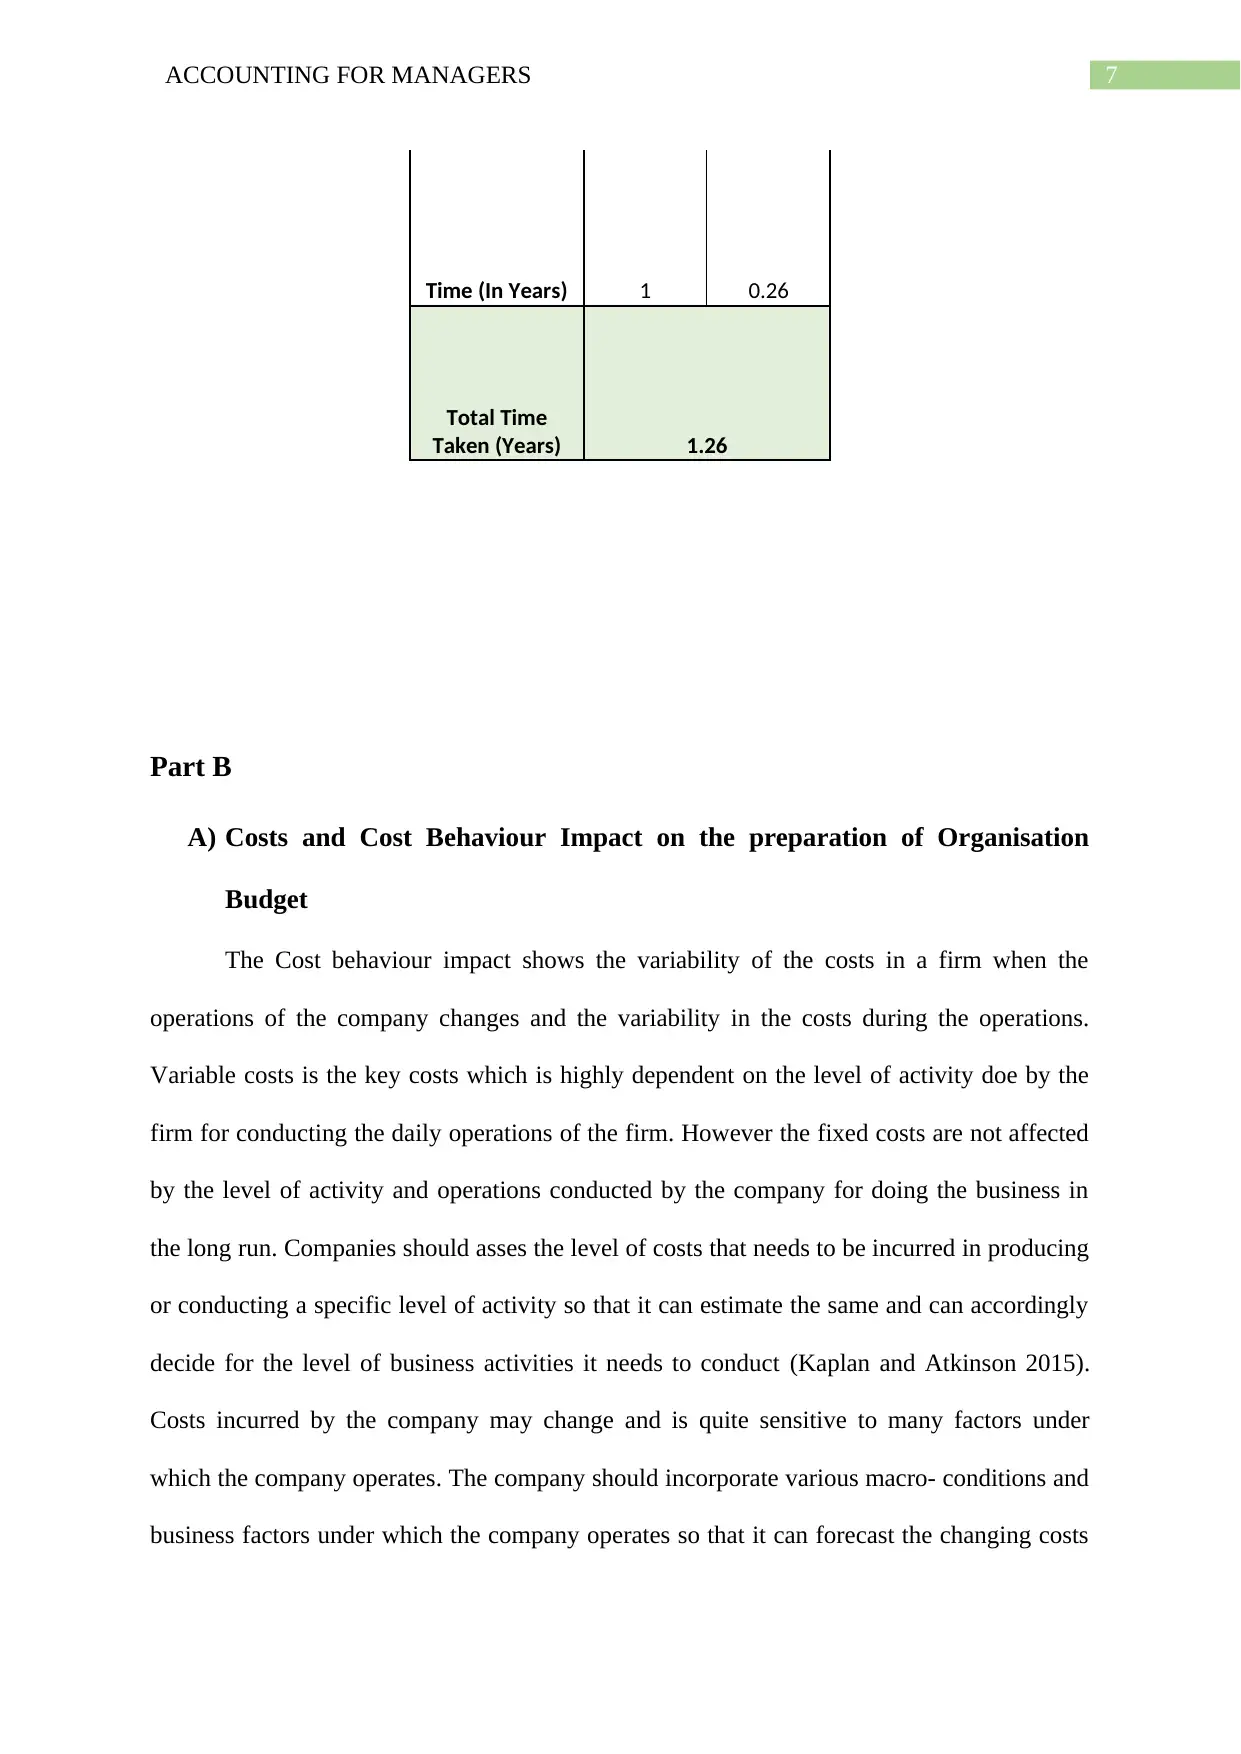
Time (In Years) 1 0.26
Total Time
Taken (Years) 1.26
Part B
A) Costs and Cost Behaviour Impact on the preparation of Organisation
Budget
The Cost behaviour impact shows the variability of the costs in a firm when the
operations of the company changes and the variability in the costs during the operations.
Variable costs is the key costs which is highly dependent on the level of activity doe by the
firm for conducting the daily operations of the firm. However the fixed costs are not affected
by the level of activity and operations conducted by the company for doing the business in
the long run. Companies should asses the level of costs that needs to be incurred in producing
or conducting a specific level of activity so that it can estimate the same and can accordingly
decide for the level of business activities it needs to conduct (Kaplan and Atkinson 2015).
Costs incurred by the company may change and is quite sensitive to many factors under
which the company operates. The company should incorporate various macro- conditions and
business factors under which the company operates so that it can forecast the changing costs
8ACCOUNTING FOR MANAGERS
and the impact on the company’s budget for conducting the business activities (Maskell,
Baggaley and Grasso 2016). Changes in the level of interest rate, inflation level and the price
of raw materials are some of the key macro-economic factors which should be taken into
consideration as the volatility in these factors can significantly influence the level of business
activity and the costs of the company. Changes in costs and forecasted expenses are an
estimates but the same should not change materially to a high significant level which can
distort the planned budget for the company. It is also essential for the companies to
understand how cost will react in the various business conditions so that it can optimally
decide the level of breakeven analysis it needs to conduct and cost volume profit analysis
(Noreen, Brewer and Garrison 2014). Planned Budget and variance report acts as a quite
important tool for the management of the company as the same help in making various
business strategy for the company. It is important for the companies in the long run and to
have a sustainable growth and that can only be possible if the total revenue of the company is
greater 1than the total costs of the company (Christopher 2016). An effective costs control
procedure and a proper budget plan, which includes various factors and condition assures the
management of the company that it can withstand stable and operates its business in a
sustainable way. The forecasted budget will help the company realise how costs will react in
different business conditions and scenarios. Business factors such as optimum utilisation of
resources, management efficiency, technology involved and current capacity of the company
in making the production level of a company also plays an important role in determining the
variability of costs in a company (Harrison and Lock 2017). If the above business factors
discussed above does not respond well and if the same is not efficient than it would affect the
company in rising costs that needs to be paid by the company and the same will affect the
budget of the company. There should always be a provision for the estimated costs that the
company is planning to spend so that a quite variability in the same can be tacked and
⊘ This is a preview!⊘
Do you want full access?
Subscribe today to unlock all pages.
Trusted by 1+ million students worldwide
9ACCOUNTING FOR MANAGERS
handled by the management of the company efficiently. Thus, it is crucial for the
management of the company to incorporate various factors and condition in the view point of
budget so that the same can be handled well be the management of the company and the
operations of the company runs smoothly ensuring long-term development of the company
(Carbaugh 2016).
B) Application of Break-even Analysis in the context of decision making
The Breakeven analysis is an important assessment tool in order to identify and
examine the relationship association between the fixed costs and the variable costs of a
company. The breakeven analysis act as a key tool for assessment of the minimum
production level or the revenue, which the company needs to generate in order to earn profit
(Goldenberg et al. 2015). The graphical assessment tool is an effective planning tool used by
the management of the company for deciding the level of activities to be done by the
company and the profitability the business will be achieving. The breakeven analysis tool
indicates the company whether the company should or should not go ahead with the
production activity. The breakeven point is also known as the critical point for the
organisation. The breakeven analysis will help the company in deciding whether it should go
ahead with selling a particular product or not. Breakeven point is that point of time where the
total cost incurred by the company for the production and selling is equal to the revenue of
the company (Dillon and Casey 2016). Organisations examine the various costs involved in
the operations of the business in the form of fixed cost and variable cost and the role they
play in the management of the same. It is important for the companies in the long run and to
have sustainable growth and that can only be possible if the total revenue of the company is
greater than the total costs of the company (Palia 2014).
The formula applicable in order to find out the breakeven point:
Paraphrase This Document
Need a fresh take? Get an instant paraphrase of this document with our AI Paraphraser
10ACCOUNTING FOR MANAGERS
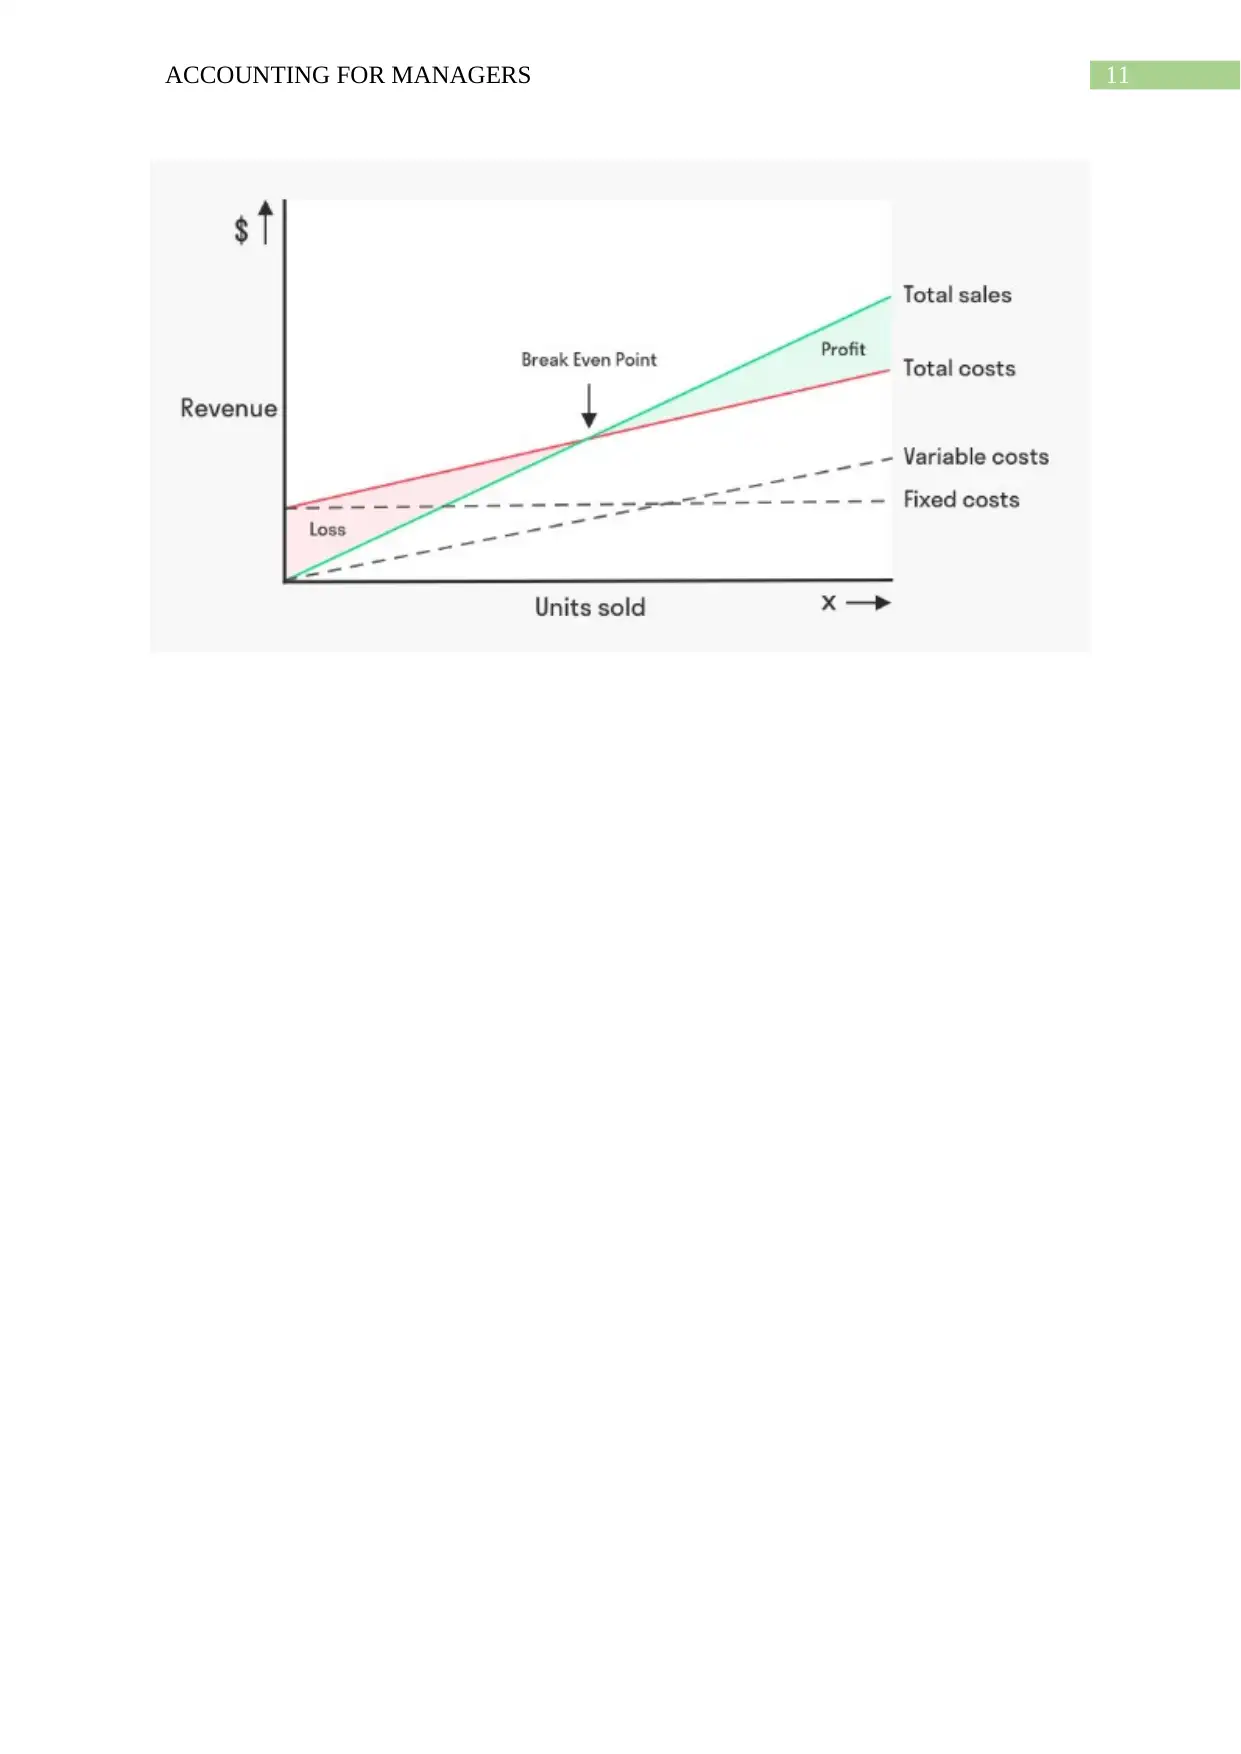
Breakeven Point (In Units) = Fixed Costs/ (Selling price – Variable Costs).
The key advantage of inclusion of breakeven analysis in the context of decision making can
be applied by the management of the company as the same will help them realise various
relationship associated with costs of the company, the revenue it earns and the volume of
goods it needs to produce. There are several business factors and other macroeconomic
factors which should be applied in the context of this so that the management of the company
can get a clear view about the same. The breakeven analysis is an important tool for the
management of a company when the same is applied by the companies in the context of
budgeting. Companies should asses the level of costs that needs to be incurred in producing
or conducting a specific level of activity so that it can estimate the same and can accordingly
decide for the level of business activities it needs to conduct. Thus, it is crucial for the
management of the company to examine various aspects and point from where it can assess
the breakeven point of business and apply the same in the context of business for making
impotent management decisions.
11ACCOUNTING FOR MANAGERS
⊘ This is a preview!⊘
Do you want full access?
Subscribe today to unlock all pages.
Trusted by 1+ million students worldwide
1 out of 15
Related Documents


Your All-in-One AI-Powered Toolkit for Academic Success.
+13062052269
info@desklib.com
Available 24*7 on WhatsApp / Email
![[object Object]](/_next/static/media/star-bottom.7253800d.svg)
Unlock your academic potential
Copyright © 2020–2026 A2Z Services. All Rights Reserved. Developed and managed by ZUCOL.