Organisational Performance of NAB: HC1010 Accounting for Business
VerifiedAdded on 2023/06/12
|20
|4418
|95
Report
AI Summary
This report provides a comprehensive financial analysis of National Australia Bank (NAB), examining its profitability, financial position, and cash flow statements. It includes a comparative analysis of NAB's performance against a competitor, Commonwealth Bank of Australia (CBA), using key profitability ratios such as return on equity and profit margin. The analysis covers the years 2016 and 2017, evaluating changes in interest income, net profit, and various balance sheet components like assets and liabilities. Additionally, the report calculates and interprets ratios like return on assets, quick ratio, and price-earnings ratio for the years 2015-2017, offering insights into the bank's financial health and operational efficiency. The study concludes with an assessment of management's role in safeguarding the corporation's interests.
Running head: ACCOUNTING FOR BUSINESS
Accounting for Business
University Name
Student Name
Authors’ Note
Accounting for Business
University Name
Student Name
Authors’ Note
Paraphrase This Document
Need a fresh take? Get an instant paraphrase of this document with our AI Paraphraser
2
ACCOUNTING FOR BUSINESS
Executive Summary
The study at hand intends to present financial standing of the firm by means of thorough
comparative analysis of profitability, investigation of financial assertions of the firm and
analysis of financial position from balance sheet statement. Moving further, this study
presents analysis of key ratio of three financial years that can aid understanding financial
health as well as soundness of organizational position. In the end, based on report announced
by the firm, this current study discusses in detail about the way management works for the
best interest of the entire corporation.
3
ACCOUNTING FOR BUSINESS
Table of Contents
Introduction................................................................................................................................3
Section 1:....................................................................................................................................3
Section 2:..................................................................................................................................11
Section 3:..................................................................................................................................13
Conclusion................................................................................................................................17
References................................................................................................................................19
⊘ This is a preview!⊘
Do you want full access?
Subscribe today to unlock all pages.
Trusted by 1+ million students worldwide
4
ACCOUNTING FOR BUSINESS
Introduction
For the purpose of the current study on analysis of organizational performance of the
company National Australian Bank (NAB) is selected. NAB is a Melbourne based Australian
bank that is necessarily a different financial services group, conventionally focussed on
banking business with presence in segment of wealth. In essence, National Australia Bank is
presently the third largest bank in terms of market capitalisation as well as benefits from a
huge national branch network and enhancing market share in both home loans as well as
retail deposits.
Section 1:
Evaluation of financial standing of the allocated company National Australian Bank
(NAB)
Analysis of profitability of the company
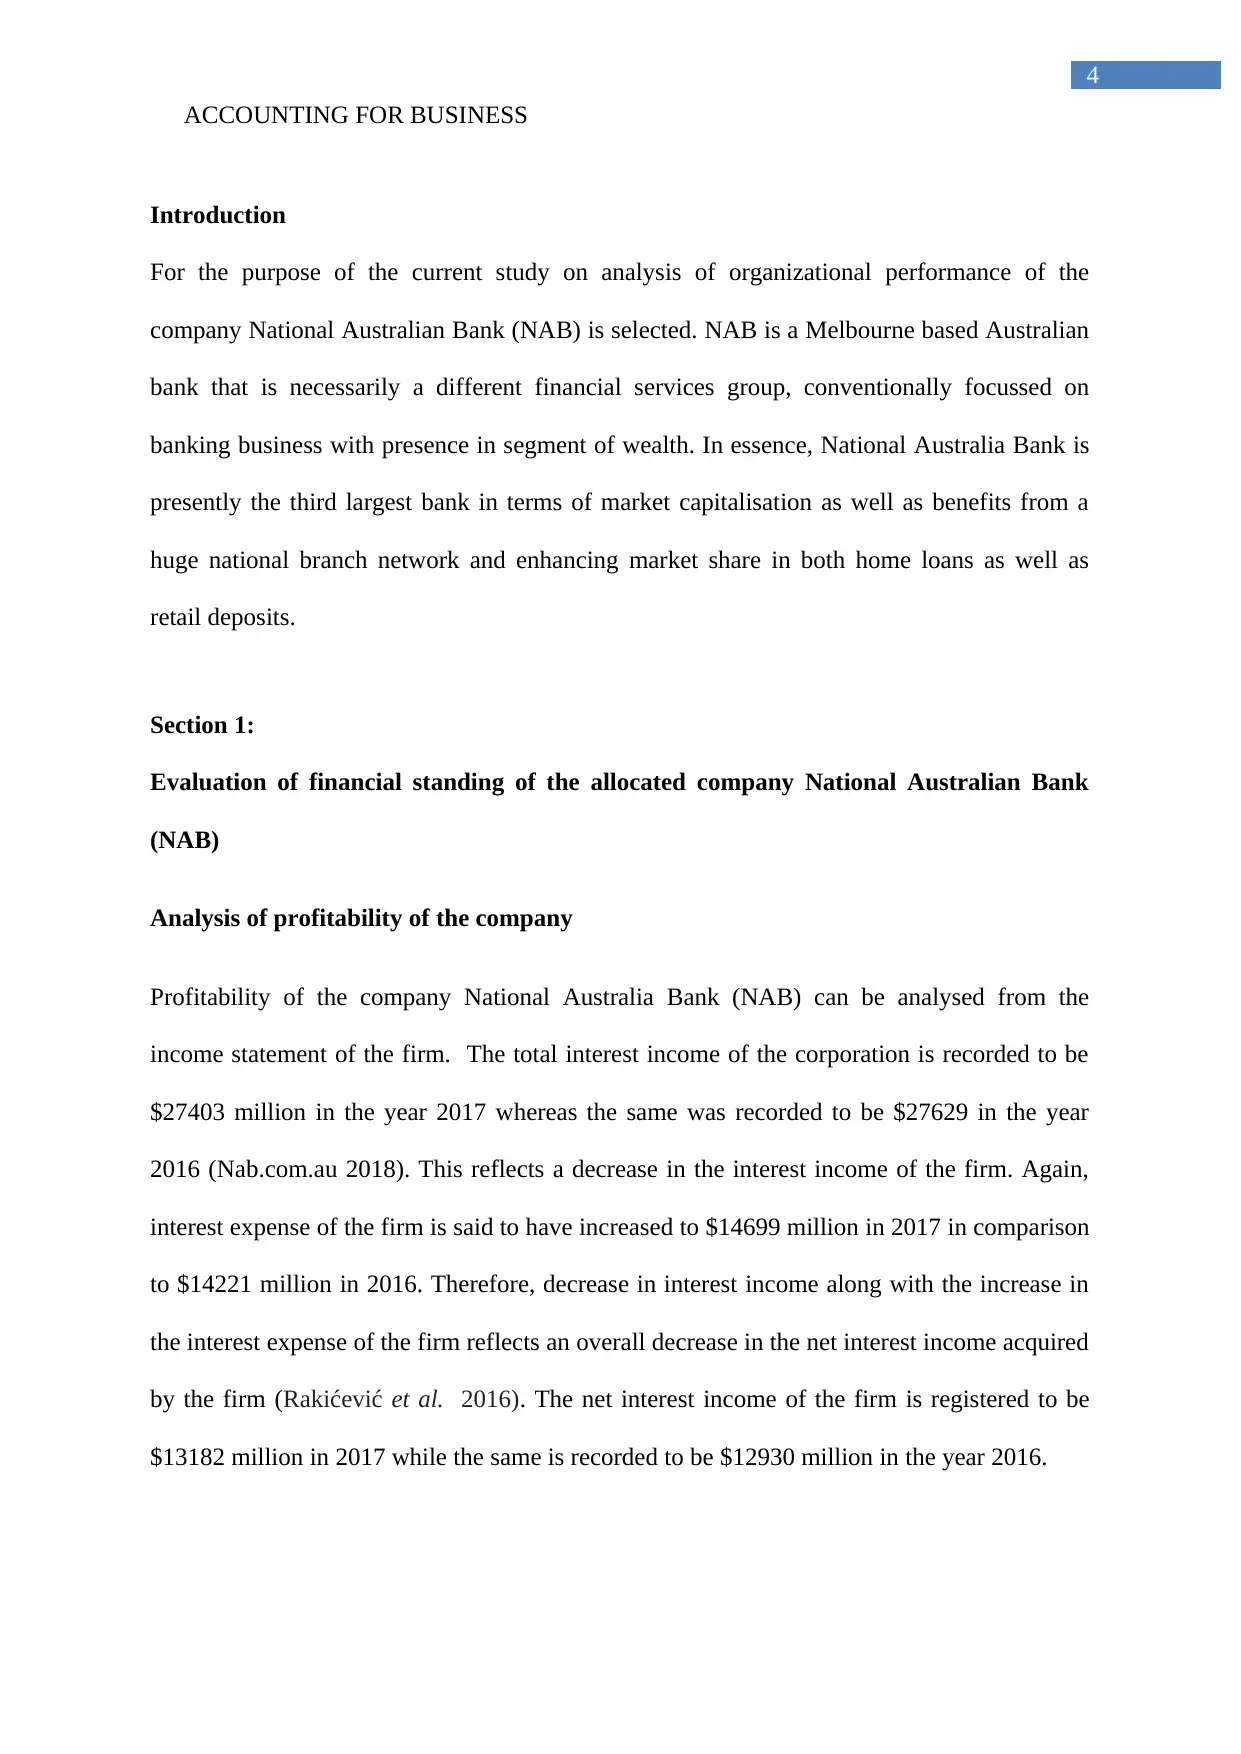
Profitability of the company National Australia Bank (NAB) can be analysed from the
income statement of the firm. The total interest income of the corporation is recorded to be
$27403 million in the year 2017 whereas the same was recorded to be $27629 in the year
2016 (Nab.com.au 2018). This reflects a decrease in the interest income of the firm. Again,
interest expense of the firm is said to have increased to $14699 million in 2017 in comparison
to $14221 million in 2016. Therefore, decrease in interest income along with the increase in
the interest expense of the firm reflects an overall decrease in the net interest income acquired
by the firm (Rakićević et al. 2016). The net interest income of the firm is registered to be
$13182 million in 2017 while the same is recorded to be $12930 million in the year 2016.
ACCOUNTING FOR BUSINESS
Introduction
For the purpose of the current study on analysis of organizational performance of the
company National Australian Bank (NAB) is selected. NAB is a Melbourne based Australian
bank that is necessarily a different financial services group, conventionally focussed on
banking business with presence in segment of wealth. In essence, National Australia Bank is
presently the third largest bank in terms of market capitalisation as well as benefits from a
huge national branch network and enhancing market share in both home loans as well as
retail deposits.
Section 1:
Evaluation of financial standing of the allocated company National Australian Bank
(NAB)
Analysis of profitability of the company
Profitability of the company National Australia Bank (NAB) can be analysed from the
income statement of the firm. The total interest income of the corporation is recorded to be
$27403 million in the year 2017 whereas the same was recorded to be $27629 in the year
2016 (Nab.com.au 2018). This reflects a decrease in the interest income of the firm. Again,
interest expense of the firm is said to have increased to $14699 million in 2017 in comparison
to $14221 million in 2016. Therefore, decrease in interest income along with the increase in
the interest expense of the firm reflects an overall decrease in the net interest income acquired
by the firm (Rakićević et al. 2016). The net interest income of the firm is registered to be
$13182 million in 2017 while the same is recorded to be $12930 million in the year 2016.
Paraphrase This Document
Need a fresh take? Get an instant paraphrase of this document with our AI Paraphraser
5
ACCOUNTING FOR BUSINESS
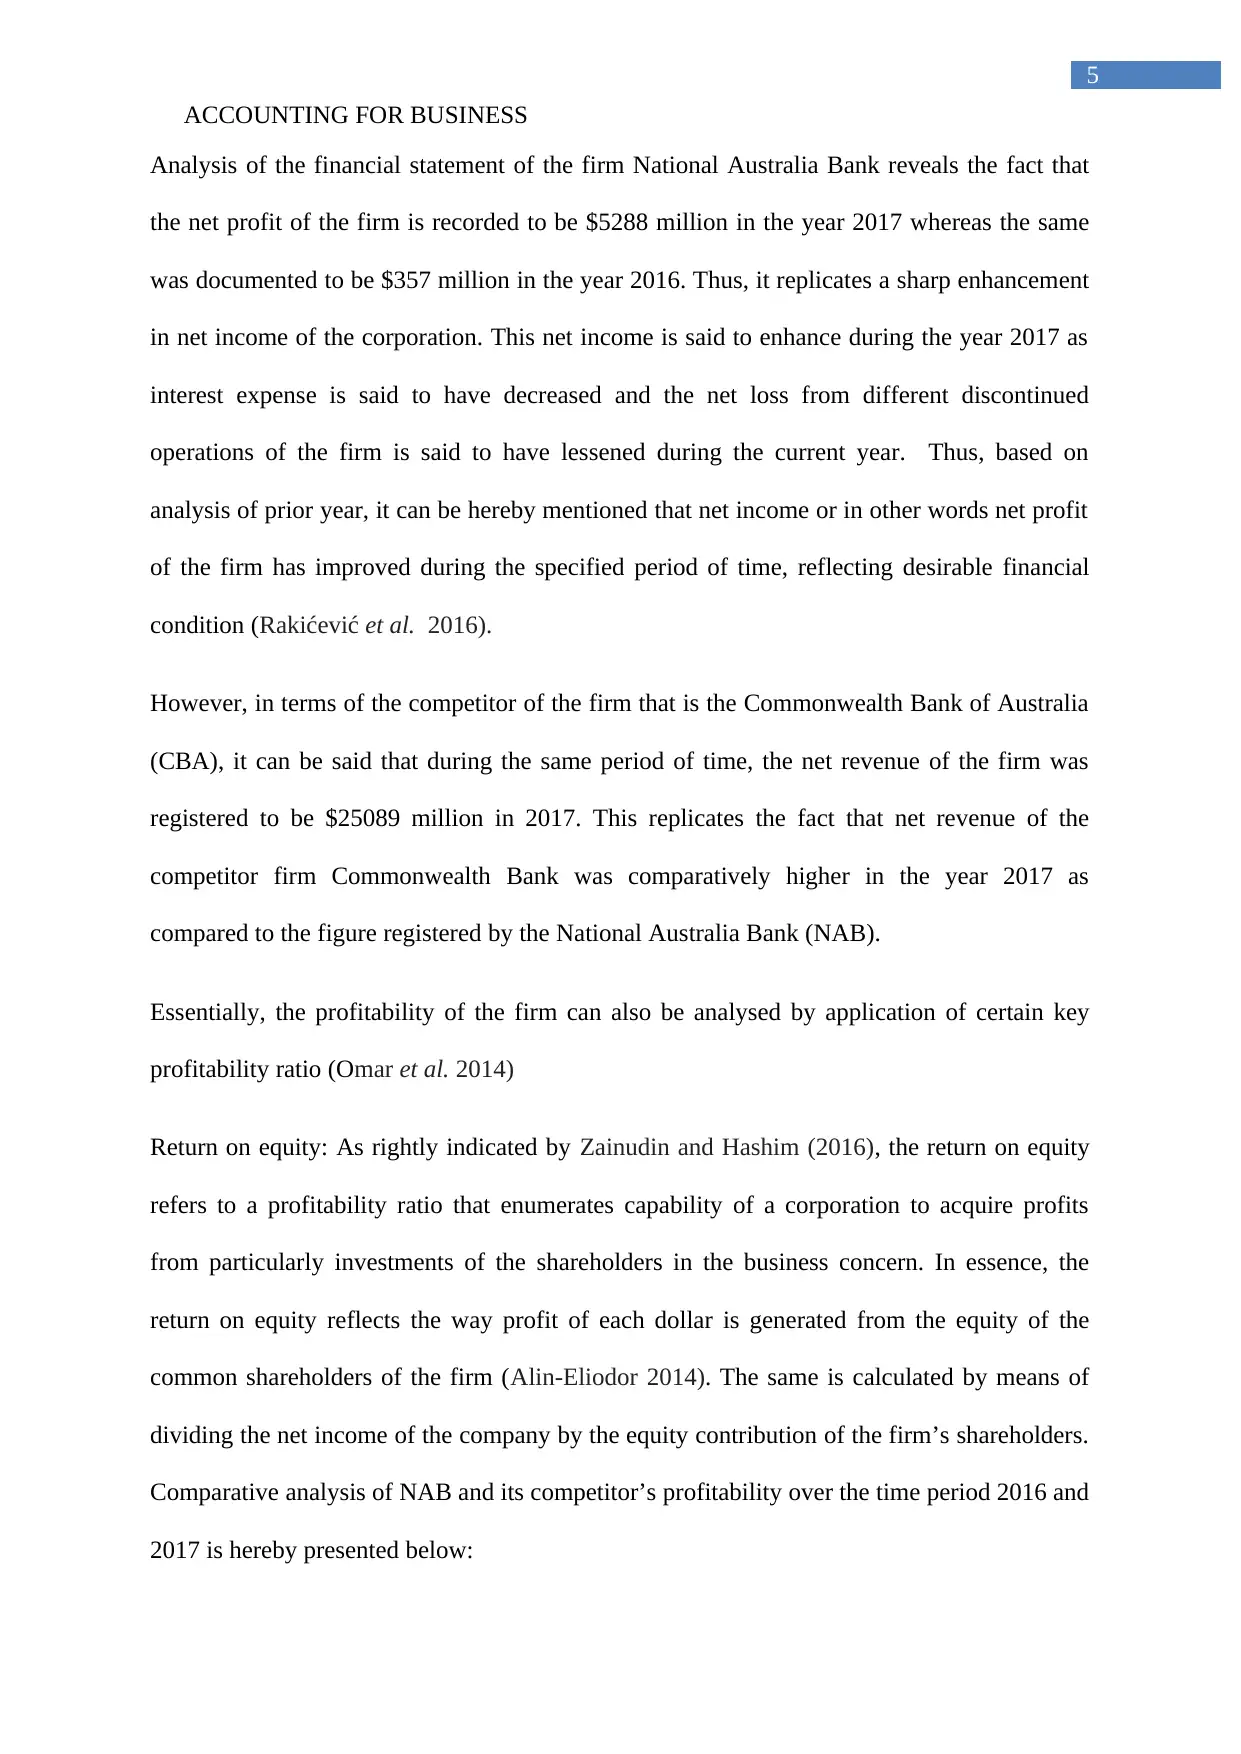
Analysis of the financial statement of the firm National Australia Bank reveals the fact that
the net profit of the firm is recorded to be $5288 million in the year 2017 whereas the same
was documented to be $357 million in the year 2016. Thus, it replicates a sharp enhancement
in net income of the corporation. This net income is said to enhance during the year 2017 as
interest expense is said to have decreased and the net loss from different discontinued
operations of the firm is said to have lessened during the current year. Thus, based on
analysis of prior year, it can be hereby mentioned that net income or in other words net profit
of the firm has improved during the specified period of time, reflecting desirable financial
condition (Rakićević et al. 2016).
However, in terms of the competitor of the firm that is the Commonwealth Bank of Australia
(CBA), it can be said that during the same period of time, the net revenue of the firm was
registered to be $25089 million in 2017. This replicates the fact that net revenue of the
competitor firm Commonwealth Bank was comparatively higher in the year 2017 as
compared to the figure registered by the National Australia Bank (NAB).
Essentially, the profitability of the firm can also be analysed by application of certain key
profitability ratio (Omar et al. 2014)
Return on equity: As rightly indicated by Zainudin and Hashim (2016), the return on equity
refers to a profitability ratio that enumerates capability of a corporation to acquire profits
from particularly investments of the shareholders in the business concern. In essence, the
return on equity reflects the way profit of each dollar is generated from the equity of the
common shareholders of the firm (Alin-Eliodor 2014). The same is calculated by means of
dividing the net income of the company by the equity contribution of the firm’s shareholders.
Comparative analysis of NAB and its competitor’s profitability over the time period 2016 and
2017 is hereby presented below:
ACCOUNTING FOR BUSINESS
Analysis of the financial statement of the firm National Australia Bank reveals the fact that
the net profit of the firm is recorded to be $5288 million in the year 2017 whereas the same
was documented to be $357 million in the year 2016. Thus, it replicates a sharp enhancement
in net income of the corporation. This net income is said to enhance during the year 2017 as
interest expense is said to have decreased and the net loss from different discontinued
operations of the firm is said to have lessened during the current year. Thus, based on
analysis of prior year, it can be hereby mentioned that net income or in other words net profit
of the firm has improved during the specified period of time, reflecting desirable financial
condition (Rakićević et al. 2016).
However, in terms of the competitor of the firm that is the Commonwealth Bank of Australia
(CBA), it can be said that during the same period of time, the net revenue of the firm was
registered to be $25089 million in 2017. This replicates the fact that net revenue of the
competitor firm Commonwealth Bank was comparatively higher in the year 2017 as
compared to the figure registered by the National Australia Bank (NAB).
Essentially, the profitability of the firm can also be analysed by application of certain key
profitability ratio (Omar et al. 2014)
Return on equity: As rightly indicated by Zainudin and Hashim (2016), the return on equity
refers to a profitability ratio that enumerates capability of a corporation to acquire profits
from particularly investments of the shareholders in the business concern. In essence, the
return on equity reflects the way profit of each dollar is generated from the equity of the
common shareholders of the firm (Alin-Eliodor 2014). The same is calculated by means of
dividing the net income of the company by the equity contribution of the firm’s shareholders.
Comparative analysis of NAB and its competitor’s profitability over the time period 2016 and
2017 is hereby presented below:
6
ACCOUNTING FOR BUSINESS
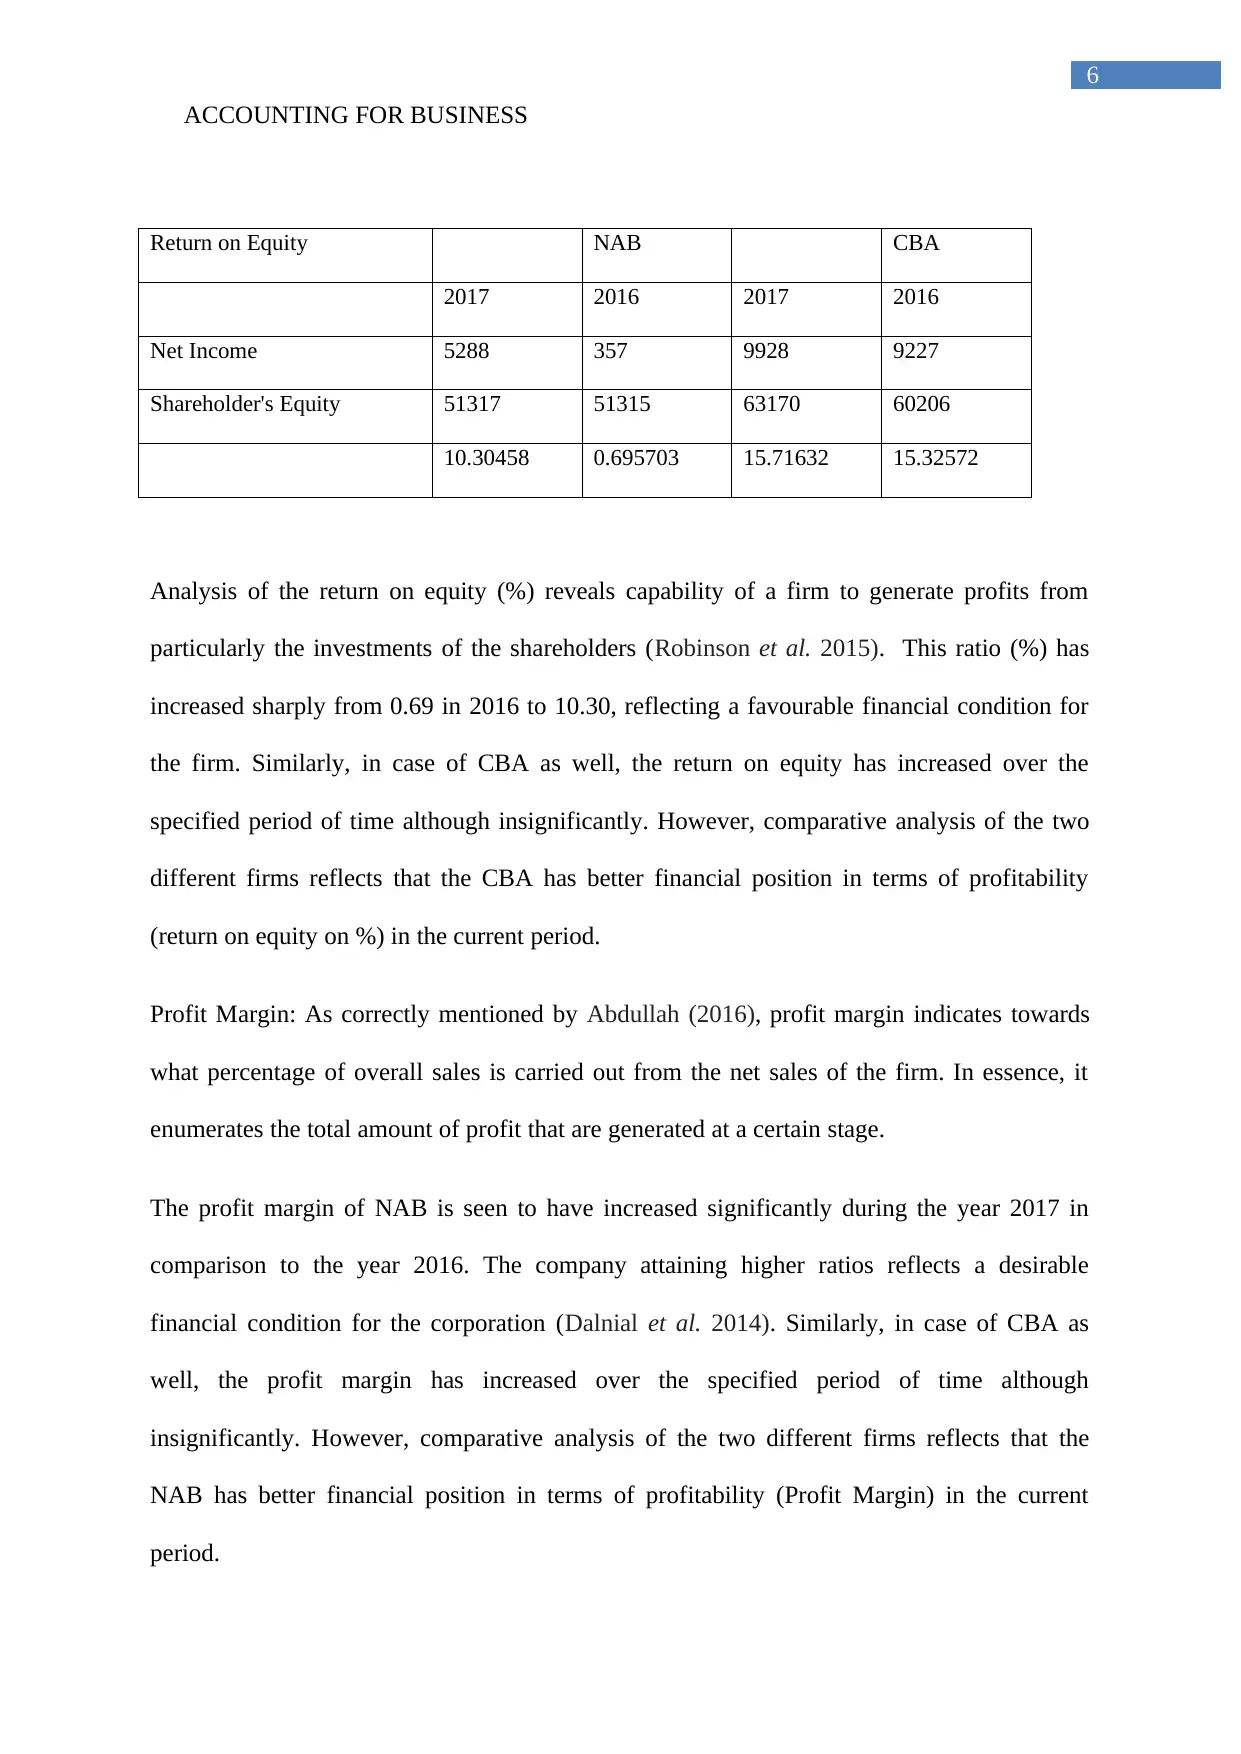
Return on Equity NAB CBA
2017 2016 2017 2016
Net Income 5288 357 9928 9227
Shareholder's Equity 51317 51315 63170 60206
10.30458 0.695703 15.71632 15.32572
Analysis of the return on equity (%) reveals capability of a firm to generate profits from
particularly the investments of the shareholders (Robinson et al. 2015). This ratio (%) has
increased sharply from 0.69 in 2016 to 10.30, reflecting a favourable financial condition for
the firm. Similarly, in case of CBA as well, the return on equity has increased over the
specified period of time although insignificantly. However, comparative analysis of the two
different firms reflects that the CBA has better financial position in terms of profitability
(return on equity on %) in the current period.
Profit Margin: As correctly mentioned by Abdullah (2016), profit margin indicates towards
what percentage of overall sales is carried out from the net sales of the firm. In essence, it
enumerates the total amount of profit that are generated at a certain stage.
The profit margin of NAB is seen to have increased significantly during the year 2017 in
comparison to the year 2016. The company attaining higher ratios reflects a desirable
financial condition for the corporation (Dalnial et al. 2014). Similarly, in case of CBA as
well, the profit margin has increased over the specified period of time although
insignificantly. However, comparative analysis of the two different firms reflects that the
NAB has better financial position in terms of profitability (Profit Margin) in the current
period.
ACCOUNTING FOR BUSINESS
Return on Equity NAB CBA
2017 2016 2017 2016
Net Income 5288 357 9928 9227
Shareholder's Equity 51317 51315 63170 60206
10.30458 0.695703 15.71632 15.32572
Analysis of the return on equity (%) reveals capability of a firm to generate profits from
particularly the investments of the shareholders (Robinson et al. 2015). This ratio (%) has
increased sharply from 0.69 in 2016 to 10.30, reflecting a favourable financial condition for
the firm. Similarly, in case of CBA as well, the return on equity has increased over the
specified period of time although insignificantly. However, comparative analysis of the two
different firms reflects that the CBA has better financial position in terms of profitability
(return on equity on %) in the current period.
Profit Margin: As correctly mentioned by Abdullah (2016), profit margin indicates towards
what percentage of overall sales is carried out from the net sales of the firm. In essence, it
enumerates the total amount of profit that are generated at a certain stage.
The profit margin of NAB is seen to have increased significantly during the year 2017 in
comparison to the year 2016. The company attaining higher ratios reflects a desirable
financial condition for the corporation (Dalnial et al. 2014). Similarly, in case of CBA as
well, the profit margin has increased over the specified period of time although
insignificantly. However, comparative analysis of the two different firms reflects that the
NAB has better financial position in terms of profitability (Profit Margin) in the current
period.
⊘ This is a preview!⊘
Do you want full access?
Subscribe today to unlock all pages.
Trusted by 1+ million students worldwide
7
ACCOUNTING FOR BUSINESS
NAB CBA
Profit Margin 2017 2016 2017 2016
Net Income 5288 357 9928 9227
Net Sales 8661 8978 25089 24225
0.610553 0.039764 0.395711 0.380888
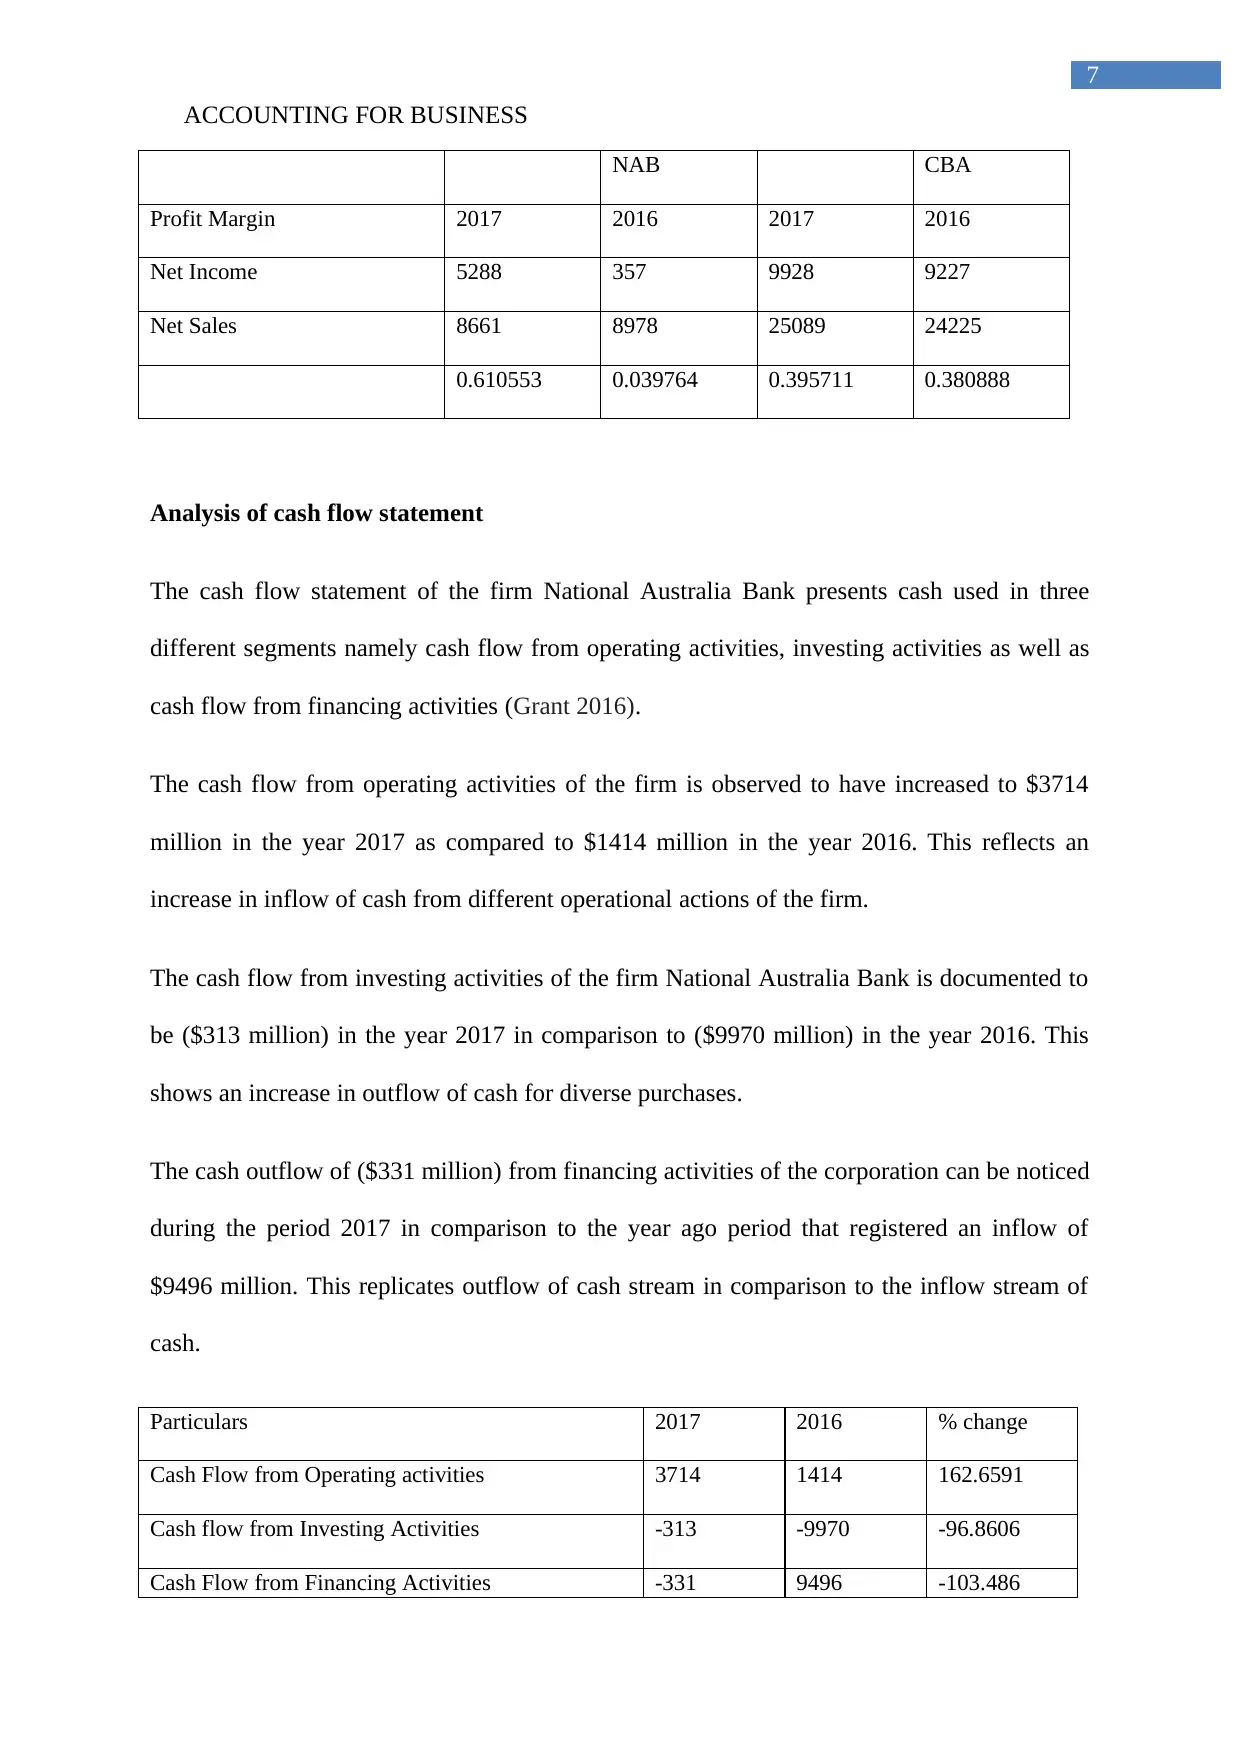
Analysis of cash flow statement
The cash flow statement of the firm National Australia Bank presents cash used in three
different segments namely cash flow from operating activities, investing activities as well as
cash flow from financing activities (Grant 2016).
The cash flow from operating activities of the firm is observed to have increased to $3714
million in the year 2017 as compared to $1414 million in the year 2016. This reflects an
increase in inflow of cash from different operational actions of the firm.
The cash flow from investing activities of the firm National Australia Bank is documented to
be ($313 million) in the year 2017 in comparison to ($9970 million) in the year 2016. This
shows an increase in outflow of cash for diverse purchases.
The cash outflow of ($331 million) from financing activities of the corporation can be noticed
during the period 2017 in comparison to the year ago period that registered an inflow of
$9496 million. This replicates outflow of cash stream in comparison to the inflow stream of
cash.
Particulars 2017 2016 % change
Cash Flow from Operating activities 3714 1414 162.6591
Cash flow from Investing Activities -313 -9970 -96.8606
Cash Flow from Financing Activities -331 9496 -103.486
ACCOUNTING FOR BUSINESS
NAB CBA
Profit Margin 2017 2016 2017 2016
Net Income 5288 357 9928 9227
Net Sales 8661 8978 25089 24225
0.610553 0.039764 0.395711 0.380888
Analysis of cash flow statement
The cash flow statement of the firm National Australia Bank presents cash used in three
different segments namely cash flow from operating activities, investing activities as well as
cash flow from financing activities (Grant 2016).
The cash flow from operating activities of the firm is observed to have increased to $3714
million in the year 2017 as compared to $1414 million in the year 2016. This reflects an
increase in inflow of cash from different operational actions of the firm.
The cash flow from investing activities of the firm National Australia Bank is documented to
be ($313 million) in the year 2017 in comparison to ($9970 million) in the year 2016. This
shows an increase in outflow of cash for diverse purchases.
The cash outflow of ($331 million) from financing activities of the corporation can be noticed
during the period 2017 in comparison to the year ago period that registered an inflow of
$9496 million. This replicates outflow of cash stream in comparison to the inflow stream of
cash.
Particulars 2017 2016 % change
Cash Flow from Operating activities 3714 1414 162.6591
Cash flow from Investing Activities -313 -9970 -96.8606
Cash Flow from Financing Activities -331 9496 -103.486
Paraphrase This Document
Need a fresh take? Get an instant paraphrase of this document with our AI Paraphraser
8
ACCOUNTING FOR BUSINESS
Cash Flow from Operating
activities Cash flow from Investing
Activities Cash Flow from Financing
Acitvities
-15000
-10000
-5000
0
5000
10000
15000
Cash Flow Analysis
2017
2016
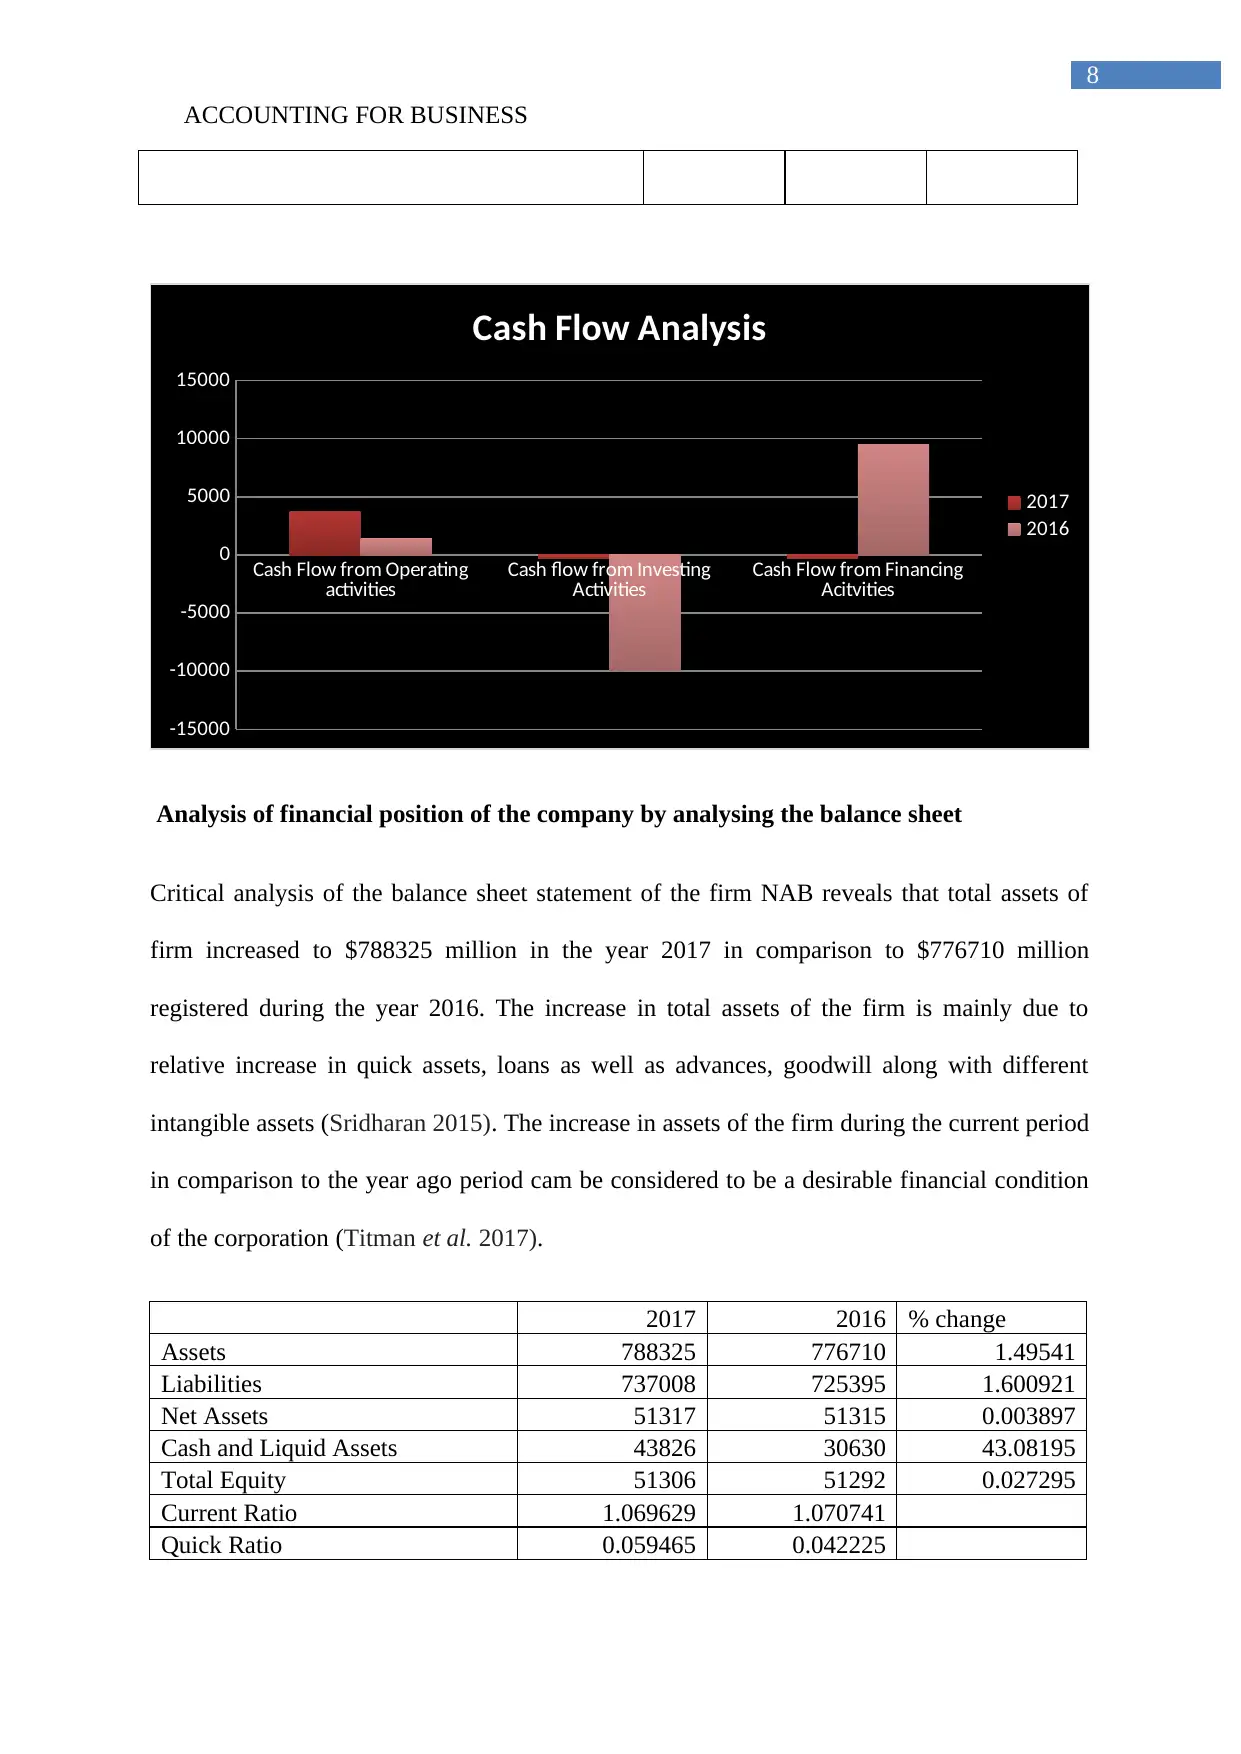
Analysis of financial position of the company by analysing the balance sheet
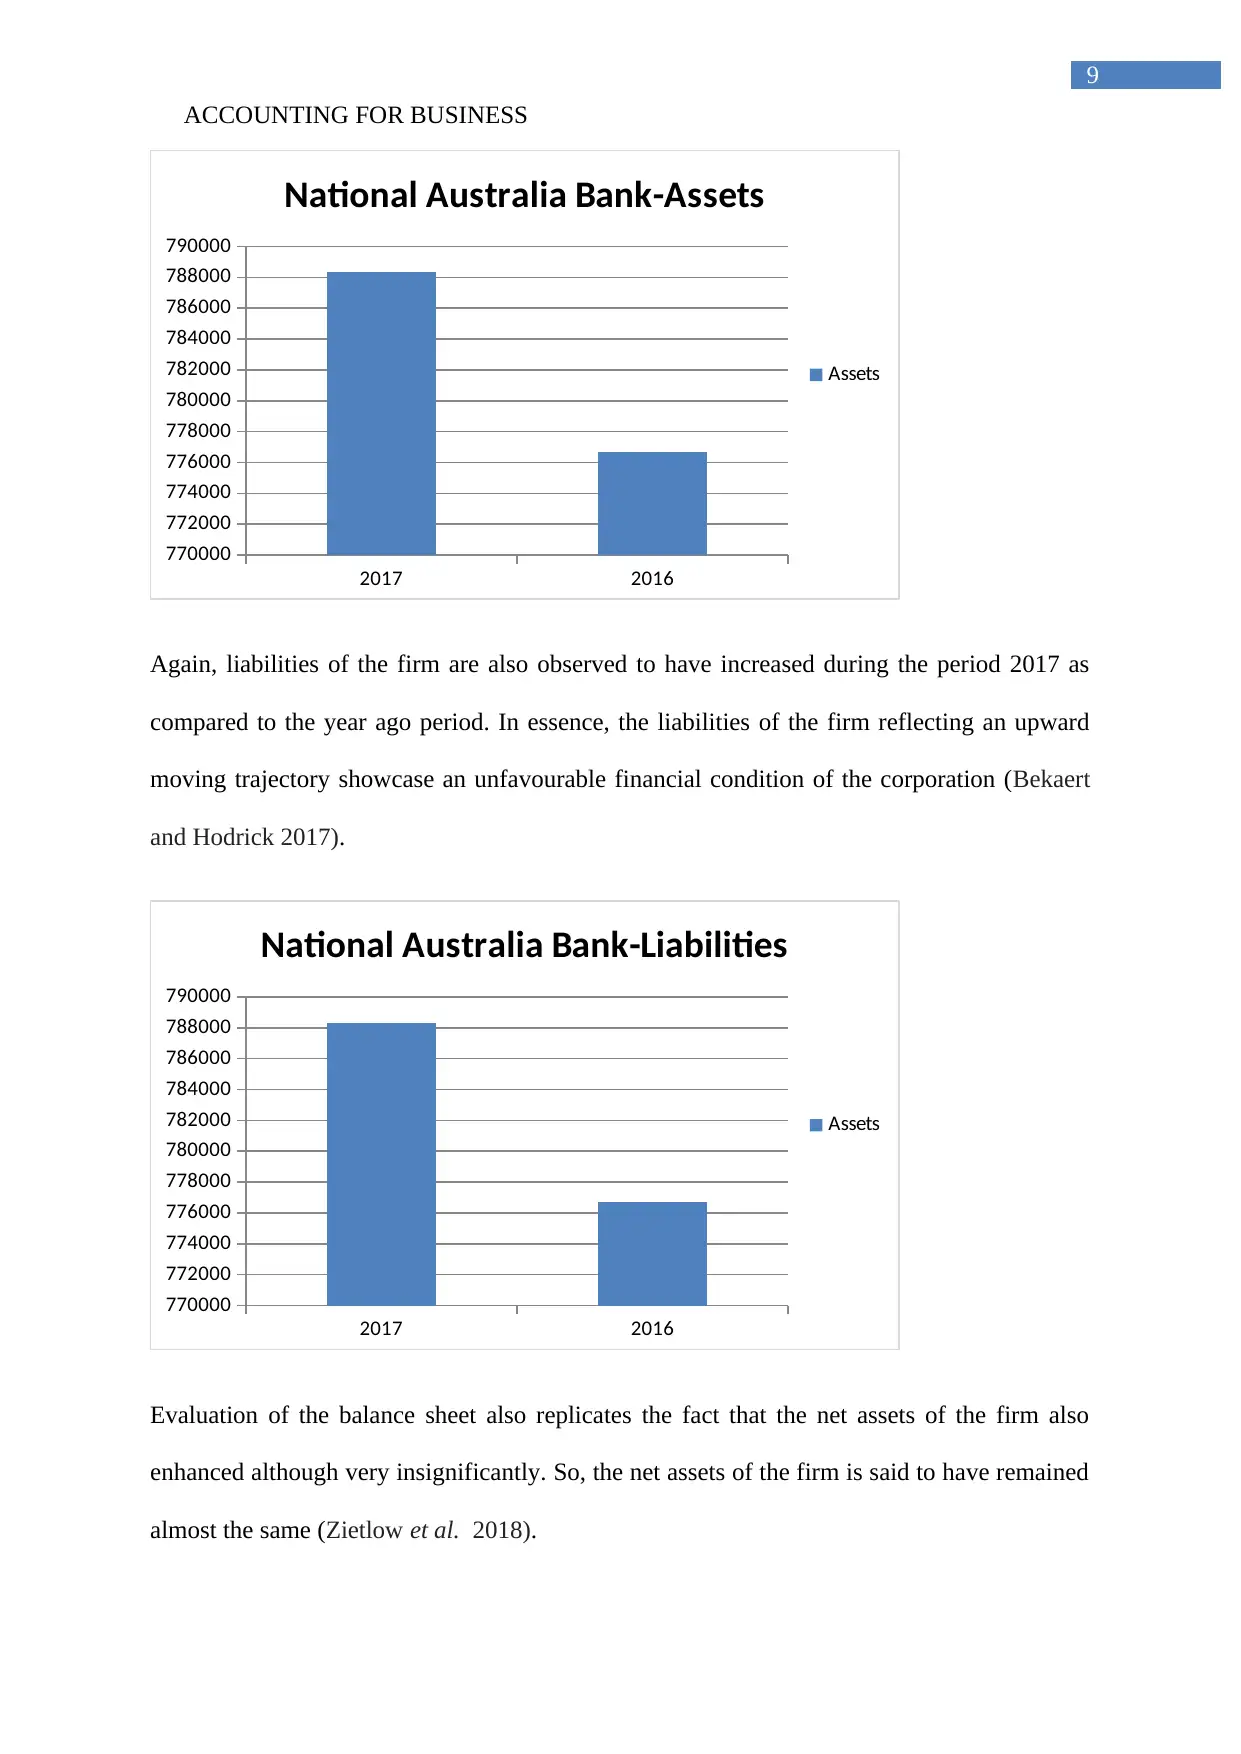
Critical analysis of the balance sheet statement of the firm NAB reveals that total assets of
firm increased to $788325 million in the year 2017 in comparison to $776710 million
registered during the year 2016. The increase in total assets of the firm is mainly due to
relative increase in quick assets, loans as well as advances, goodwill along with different
intangible assets (Sridharan 2015). The increase in assets of the firm during the current period
in comparison to the year ago period cam be considered to be a desirable financial condition
of the corporation (Titman et al. 2017).
2017 2016 % change
Assets 788325 776710 1.49541
Liabilities 737008 725395 1.600921
Net Assets 51317 51315 0.003897
Cash and Liquid Assets 43826 30630 43.08195
Total Equity 51306 51292 0.027295
Current Ratio 1.069629 1.070741
Quick Ratio 0.059465 0.042225
ACCOUNTING FOR BUSINESS
Cash Flow from Operating
activities Cash flow from Investing
Activities Cash Flow from Financing
Acitvities
-15000
-10000
-5000
0
5000
10000
15000
Cash Flow Analysis
2017
2016
Analysis of financial position of the company by analysing the balance sheet
Critical analysis of the balance sheet statement of the firm NAB reveals that total assets of
firm increased to $788325 million in the year 2017 in comparison to $776710 million
registered during the year 2016. The increase in total assets of the firm is mainly due to
relative increase in quick assets, loans as well as advances, goodwill along with different
intangible assets (Sridharan 2015). The increase in assets of the firm during the current period
in comparison to the year ago period cam be considered to be a desirable financial condition
of the corporation (Titman et al. 2017).
2017 2016 % change
Assets 788325 776710 1.49541
Liabilities 737008 725395 1.600921
Net Assets 51317 51315 0.003897
Cash and Liquid Assets 43826 30630 43.08195
Total Equity 51306 51292 0.027295
Current Ratio 1.069629 1.070741
Quick Ratio 0.059465 0.042225
9
ACCOUNTING FOR BUSINESS
2017 2016
770000
772000
774000
776000
778000
780000
782000
784000
786000
788000
790000
National Australia Bank-Assets
Assets
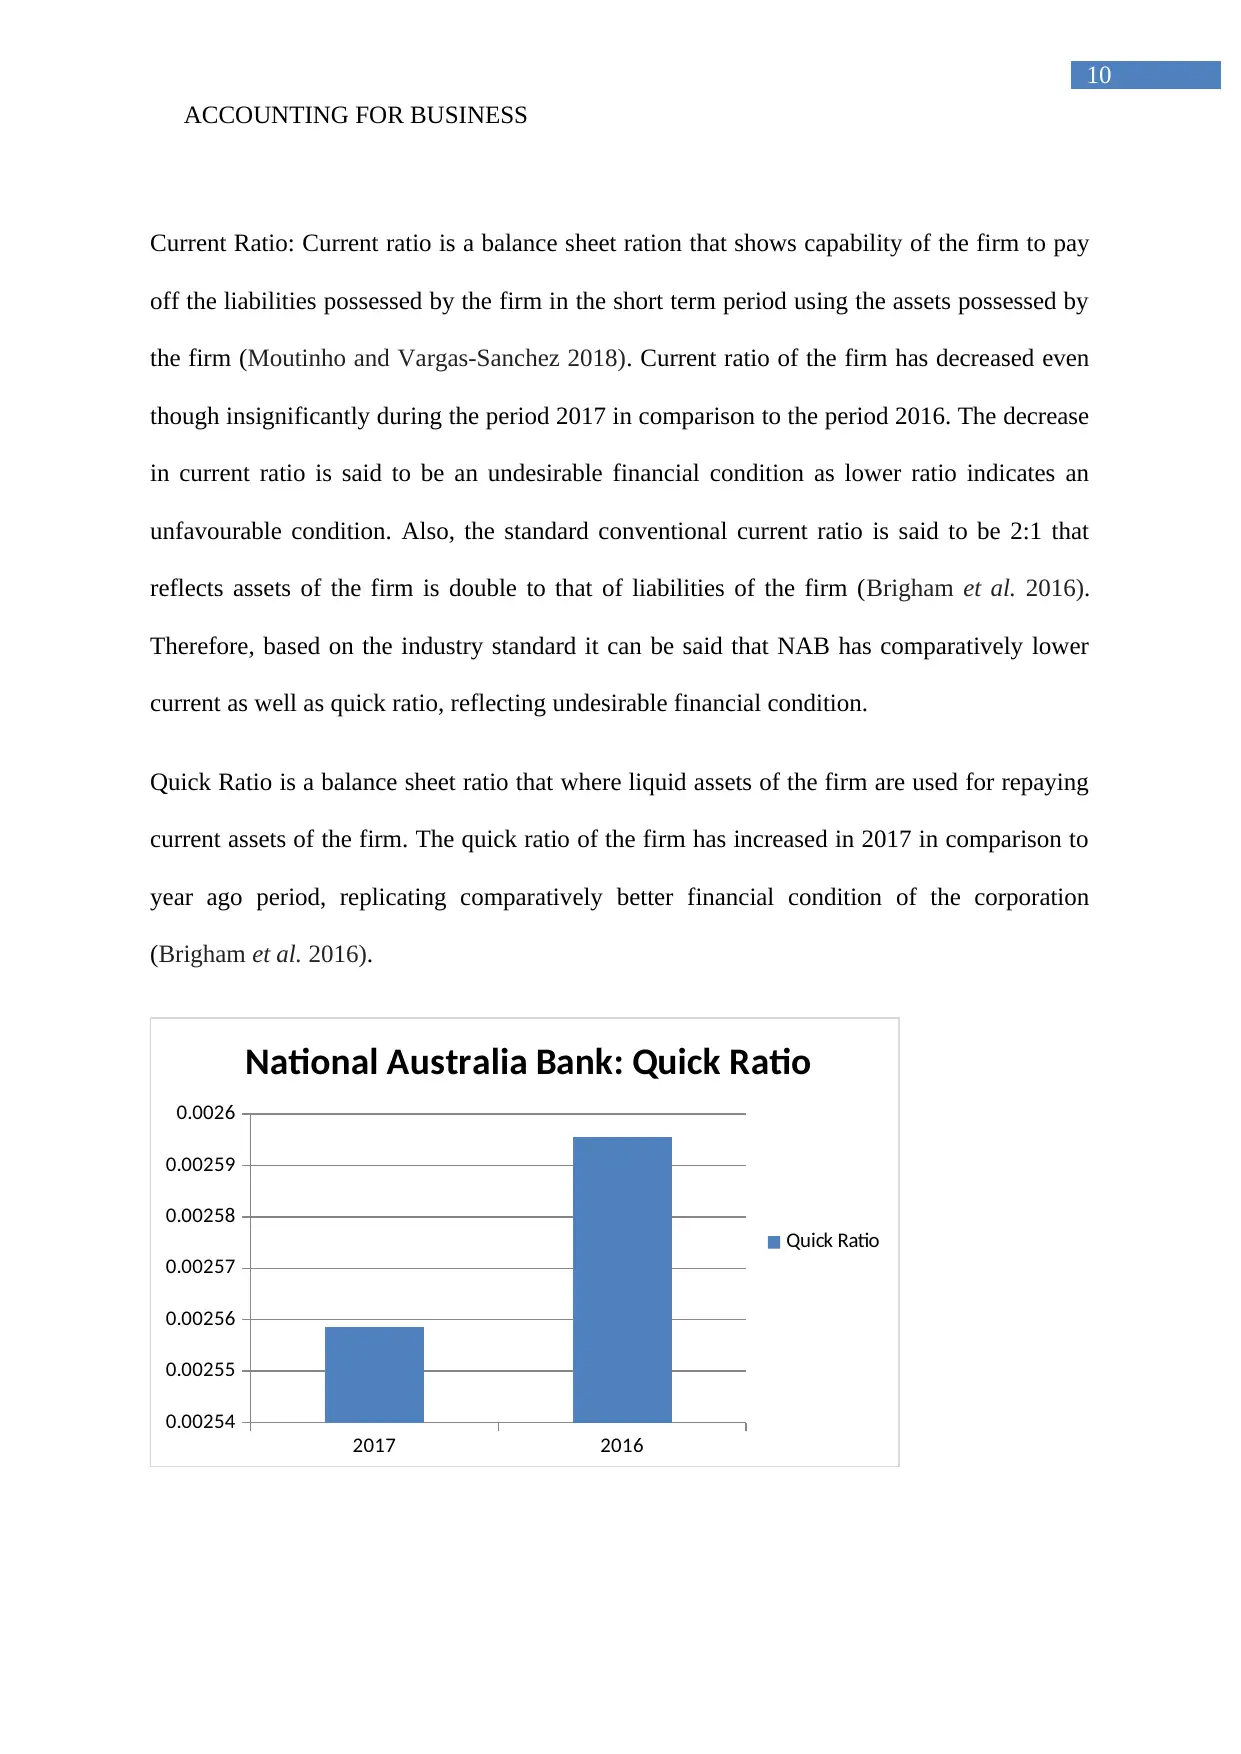
Again, liabilities of the firm are also observed to have increased during the period 2017 as
compared to the year ago period. In essence, the liabilities of the firm reflecting an upward
moving trajectory showcase an unfavourable financial condition of the corporation (Bekaert
and Hodrick 2017).
2017 2016
770000
772000
774000
776000
778000
780000
782000
784000
786000
788000
790000
National Australia Bank-Liabilities
Assets
Evaluation of the balance sheet also replicates the fact that the net assets of the firm also
enhanced although very insignificantly. So, the net assets of the firm is said to have remained
almost the same (Zietlow et al. 2018).
ACCOUNTING FOR BUSINESS
2017 2016
770000
772000
774000
776000
778000
780000
782000
784000
786000
788000
790000
National Australia Bank-Assets
Assets
Again, liabilities of the firm are also observed to have increased during the period 2017 as
compared to the year ago period. In essence, the liabilities of the firm reflecting an upward
moving trajectory showcase an unfavourable financial condition of the corporation (Bekaert
and Hodrick 2017).
2017 2016
770000
772000
774000
776000
778000
780000
782000
784000
786000
788000
790000
National Australia Bank-Liabilities
Assets
Evaluation of the balance sheet also replicates the fact that the net assets of the firm also
enhanced although very insignificantly. So, the net assets of the firm is said to have remained
almost the same (Zietlow et al. 2018).
⊘ This is a preview!⊘
Do you want full access?
Subscribe today to unlock all pages.
Trusted by 1+ million students worldwide
10
ACCOUNTING FOR BUSINESS
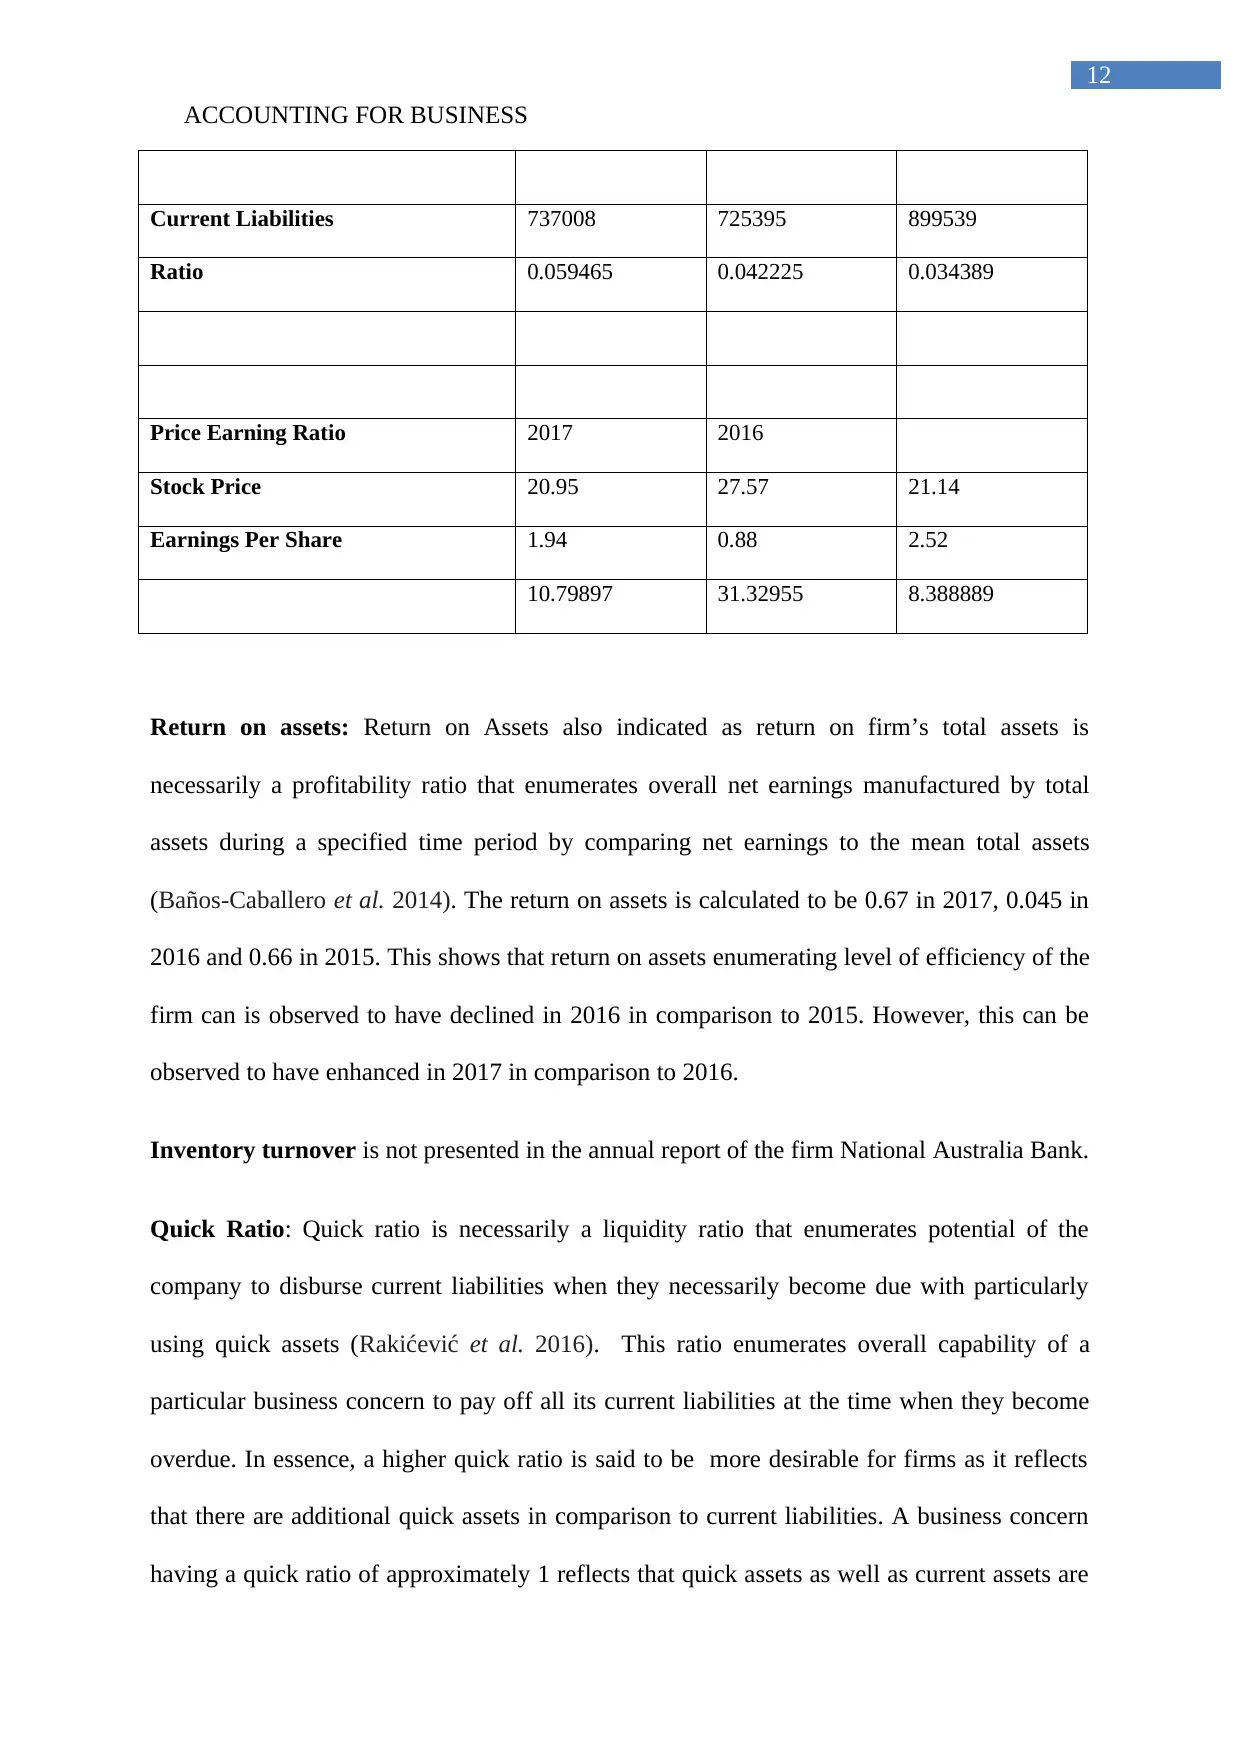
Current Ratio: Current ratio is a balance sheet ration that shows capability of the firm to pay
off the liabilities possessed by the firm in the short term period using the assets possessed by
the firm (Moutinho and Vargas-Sanchez 2018). Current ratio of the firm has decreased even
though insignificantly during the period 2017 in comparison to the period 2016. The decrease
in current ratio is said to be an undesirable financial condition as lower ratio indicates an
unfavourable condition. Also, the standard conventional current ratio is said to be 2:1 that
reflects assets of the firm is double to that of liabilities of the firm (Brigham et al. 2016).
Therefore, based on the industry standard it can be said that NAB has comparatively lower
current as well as quick ratio, reflecting undesirable financial condition.
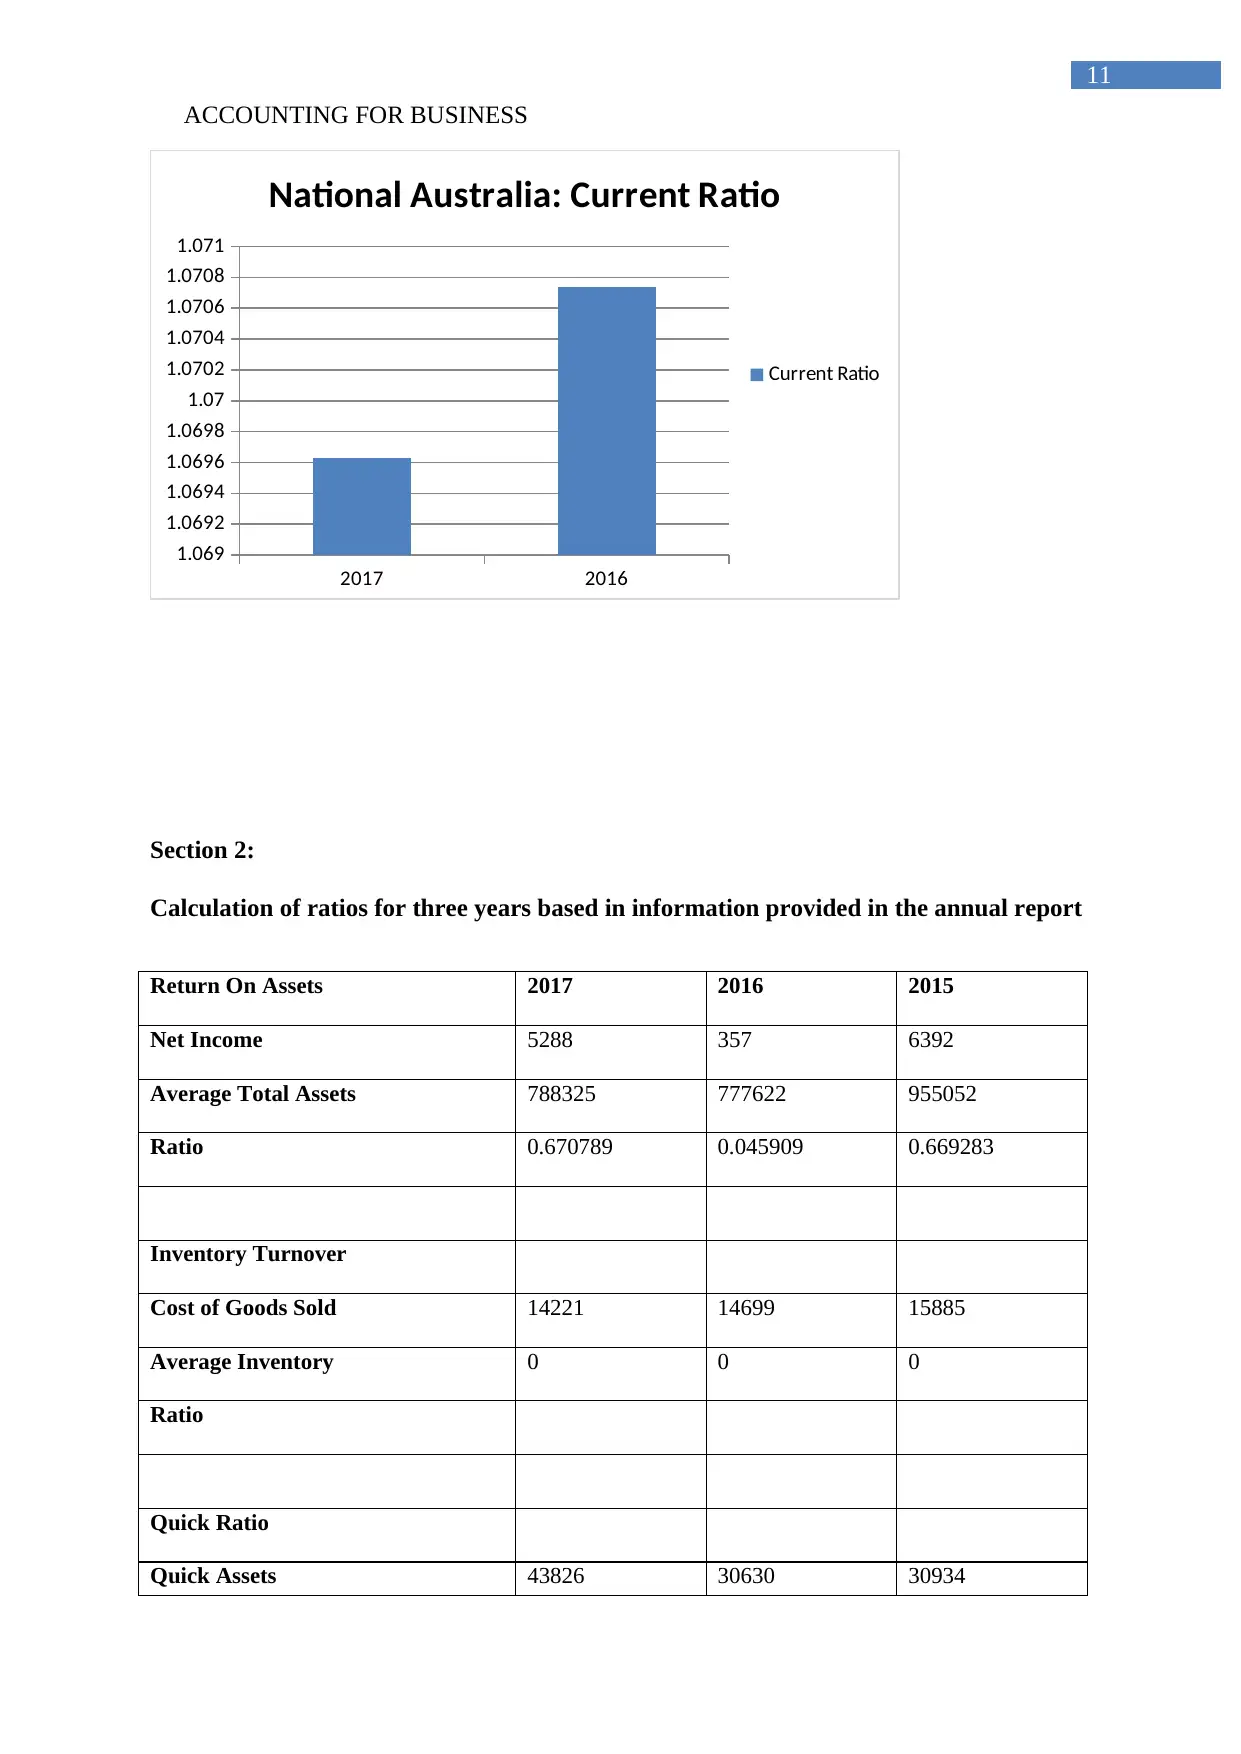
Quick Ratio is a balance sheet ratio that where liquid assets of the firm are used for repaying
current assets of the firm. The quick ratio of the firm has increased in 2017 in comparison to
year ago period, replicating comparatively better financial condition of the corporation
(Brigham et al. 2016).
2017 2016
0.00254
0.00255
0.00256
0.00257
0.00258
0.00259
0.0026
National Australia Bank: Quick Ratio
Quick Ratio
ACCOUNTING FOR BUSINESS
Current Ratio: Current ratio is a balance sheet ration that shows capability of the firm to pay
off the liabilities possessed by the firm in the short term period using the assets possessed by
the firm (Moutinho and Vargas-Sanchez 2018). Current ratio of the firm has decreased even
though insignificantly during the period 2017 in comparison to the period 2016. The decrease
in current ratio is said to be an undesirable financial condition as lower ratio indicates an
unfavourable condition. Also, the standard conventional current ratio is said to be 2:1 that
reflects assets of the firm is double to that of liabilities of the firm (Brigham et al. 2016).
Therefore, based on the industry standard it can be said that NAB has comparatively lower
current as well as quick ratio, reflecting undesirable financial condition.
Quick Ratio is a balance sheet ratio that where liquid assets of the firm are used for repaying
current assets of the firm. The quick ratio of the firm has increased in 2017 in comparison to
year ago period, replicating comparatively better financial condition of the corporation
(Brigham et al. 2016).
2017 2016
0.00254
0.00255
0.00256
0.00257
0.00258
0.00259
0.0026
National Australia Bank: Quick Ratio
Quick Ratio
Paraphrase This Document
Need a fresh take? Get an instant paraphrase of this document with our AI Paraphraser
11
ACCOUNTING FOR BUSINESS
2017 2016
1.069
1.0692
1.0694
1.0696
1.0698
1.07
1.0702
1.0704
1.0706
1.0708
1.071
National Australia: Current Ratio
Current Ratio
Section 2:
Calculation of ratios for three years based in information provided in the annual report
Return On Assets 2017 2016 2015
Net Income 5288 357 6392
Average Total Assets 788325 777622 955052
Ratio 0.670789 0.045909 0.669283
Inventory Turnover
Cost of Goods Sold 14221 14699 15885
Average Inventory 0 0 0
Ratio
Quick Ratio
Quick Assets 43826 30630 30934
12
ACCOUNTING FOR BUSINESS
Current Liabilities 737008 725395 899539
Ratio 0.059465 0.042225 0.034389
Price Earning Ratio 2017 2016
Stock Price 20.95 27.57 21.14
Earnings Per Share 1.94 0.88 2.52
10.79897 31.32955 8.388889
Return on assets: Return on Assets also indicated as return on firm’s total assets is
necessarily a profitability ratio that enumerates overall net earnings manufactured by total
assets during a specified time period by comparing net earnings to the mean total assets
(Baños-Caballero et al. 2014). The return on assets is calculated to be 0.67 in 2017, 0.045 in
2016 and 0.66 in 2015. This shows that return on assets enumerating level of efficiency of the
firm can is observed to have declined in 2016 in comparison to 2015. However, this can be
observed to have enhanced in 2017 in comparison to 2016.
Inventory turnover is not presented in the annual report of the firm National Australia Bank.
Quick Ratio: Quick ratio is necessarily a liquidity ratio that enumerates potential of the
company to disburse current liabilities when they necessarily become due with particularly
using quick assets (Rakićević et al. 2016). This ratio enumerates overall capability of a
particular business concern to pay off all its current liabilities at the time when they become
overdue. In essence, a higher quick ratio is said to be more desirable for firms as it reflects
that there are additional quick assets in comparison to current liabilities. A business concern
having a quick ratio of approximately 1 reflects that quick assets as well as current assets are
⊘ This is a preview!⊘
Do you want full access?
Subscribe today to unlock all pages.
Trusted by 1+ million students worldwide
1 out of 20
Related Documents


Your All-in-One AI-Powered Toolkit for Academic Success.
+13062052269
info@desklib.com
Available 24*7 on WhatsApp / Email
![[object Object]](/_next/static/media/star-bottom.7253800d.svg)
Unlock your academic potential
Copyright © 2020–2026 A2Z Services. All Rights Reserved. Developed and managed by ZUCOL.