UGB 163 Accounting and Finance Report: Performance Analysis
VerifiedAdded on 2023/01/18
|21
|3719
|23
Report
AI Summary
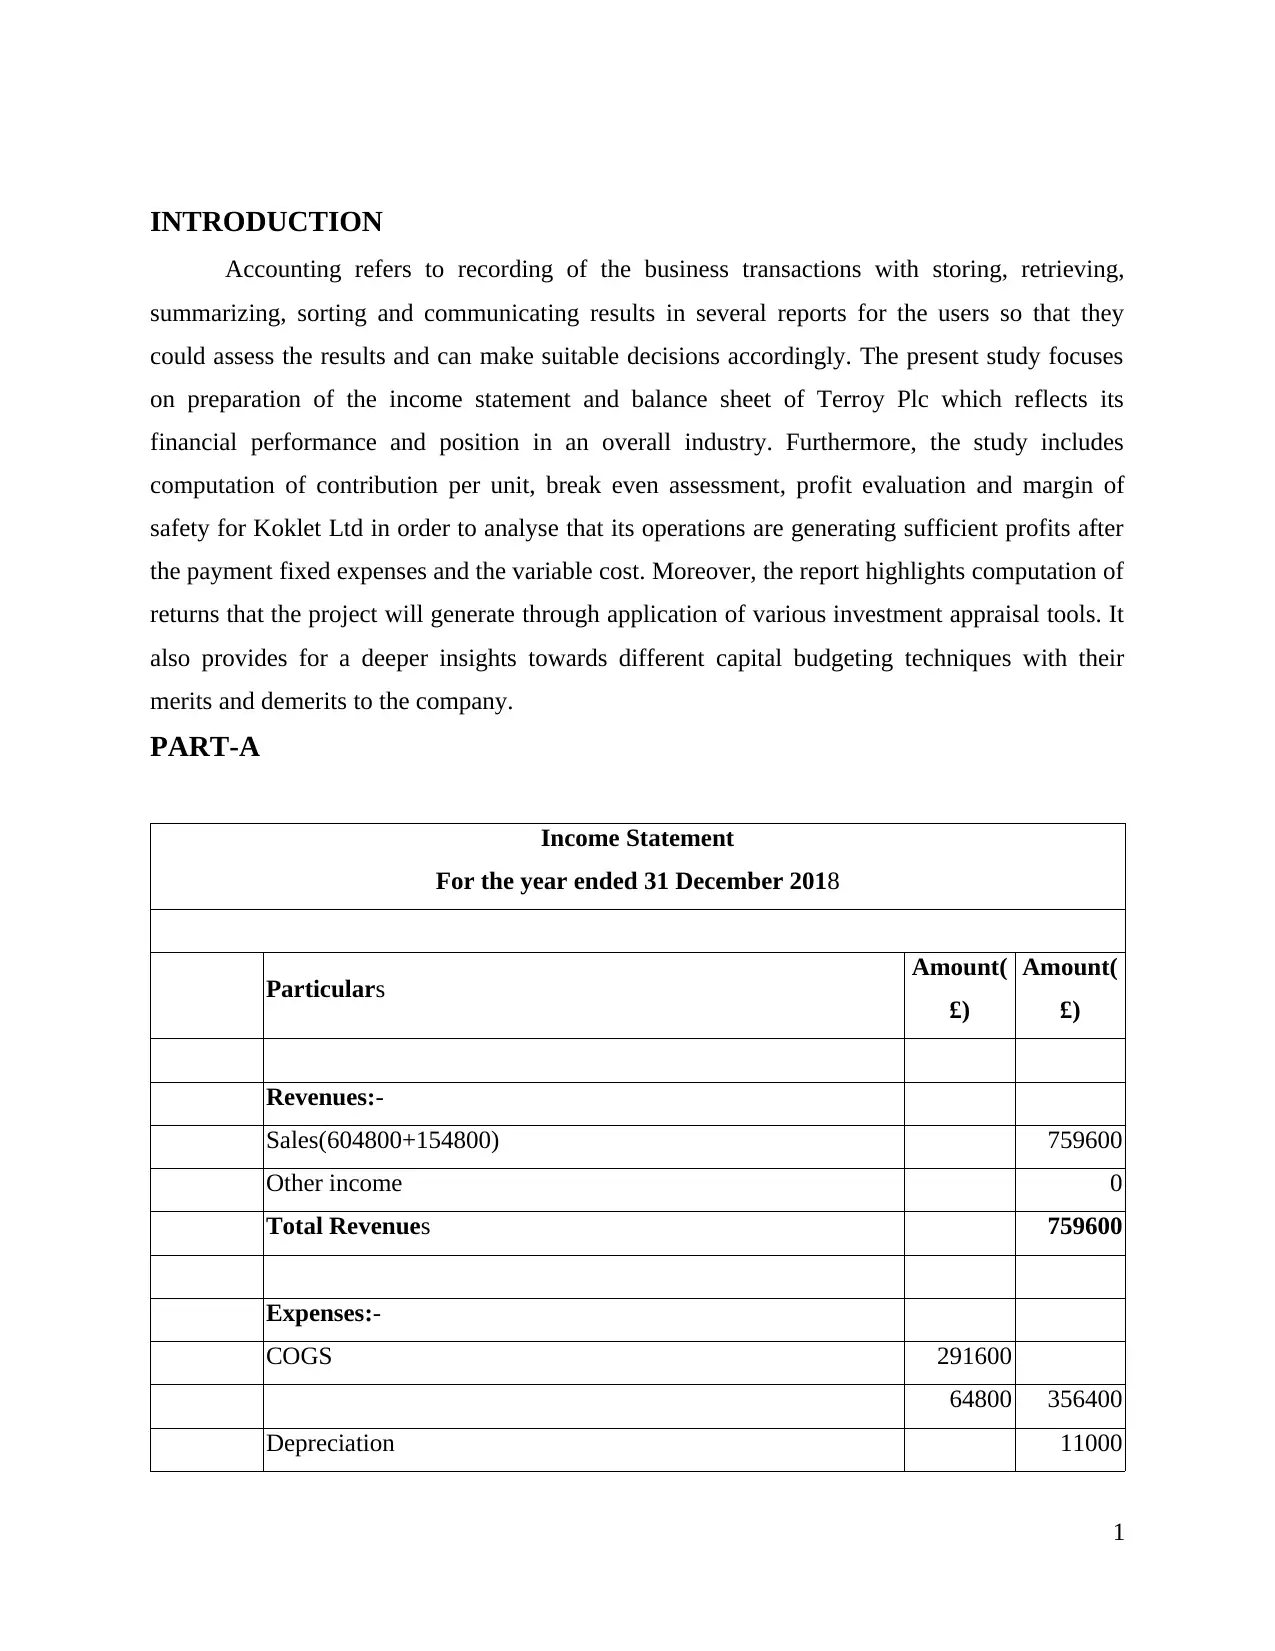
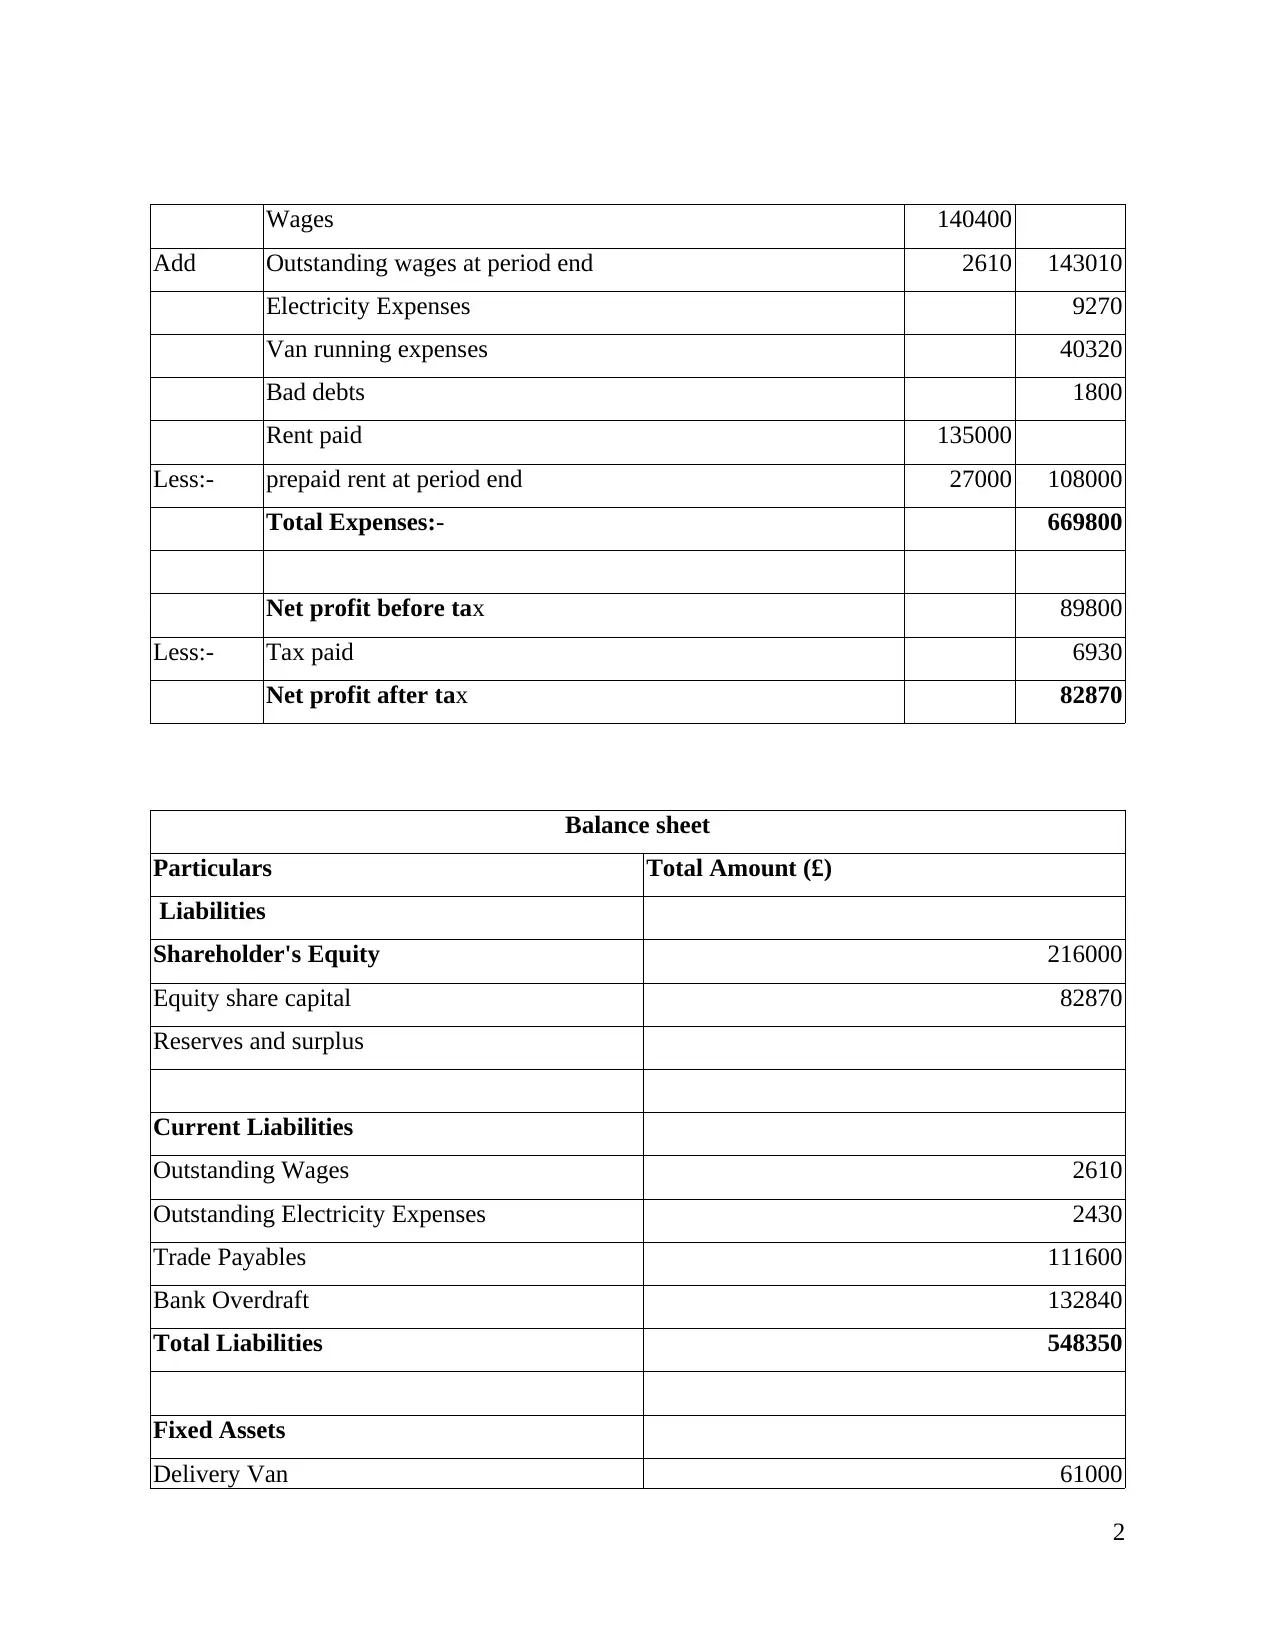
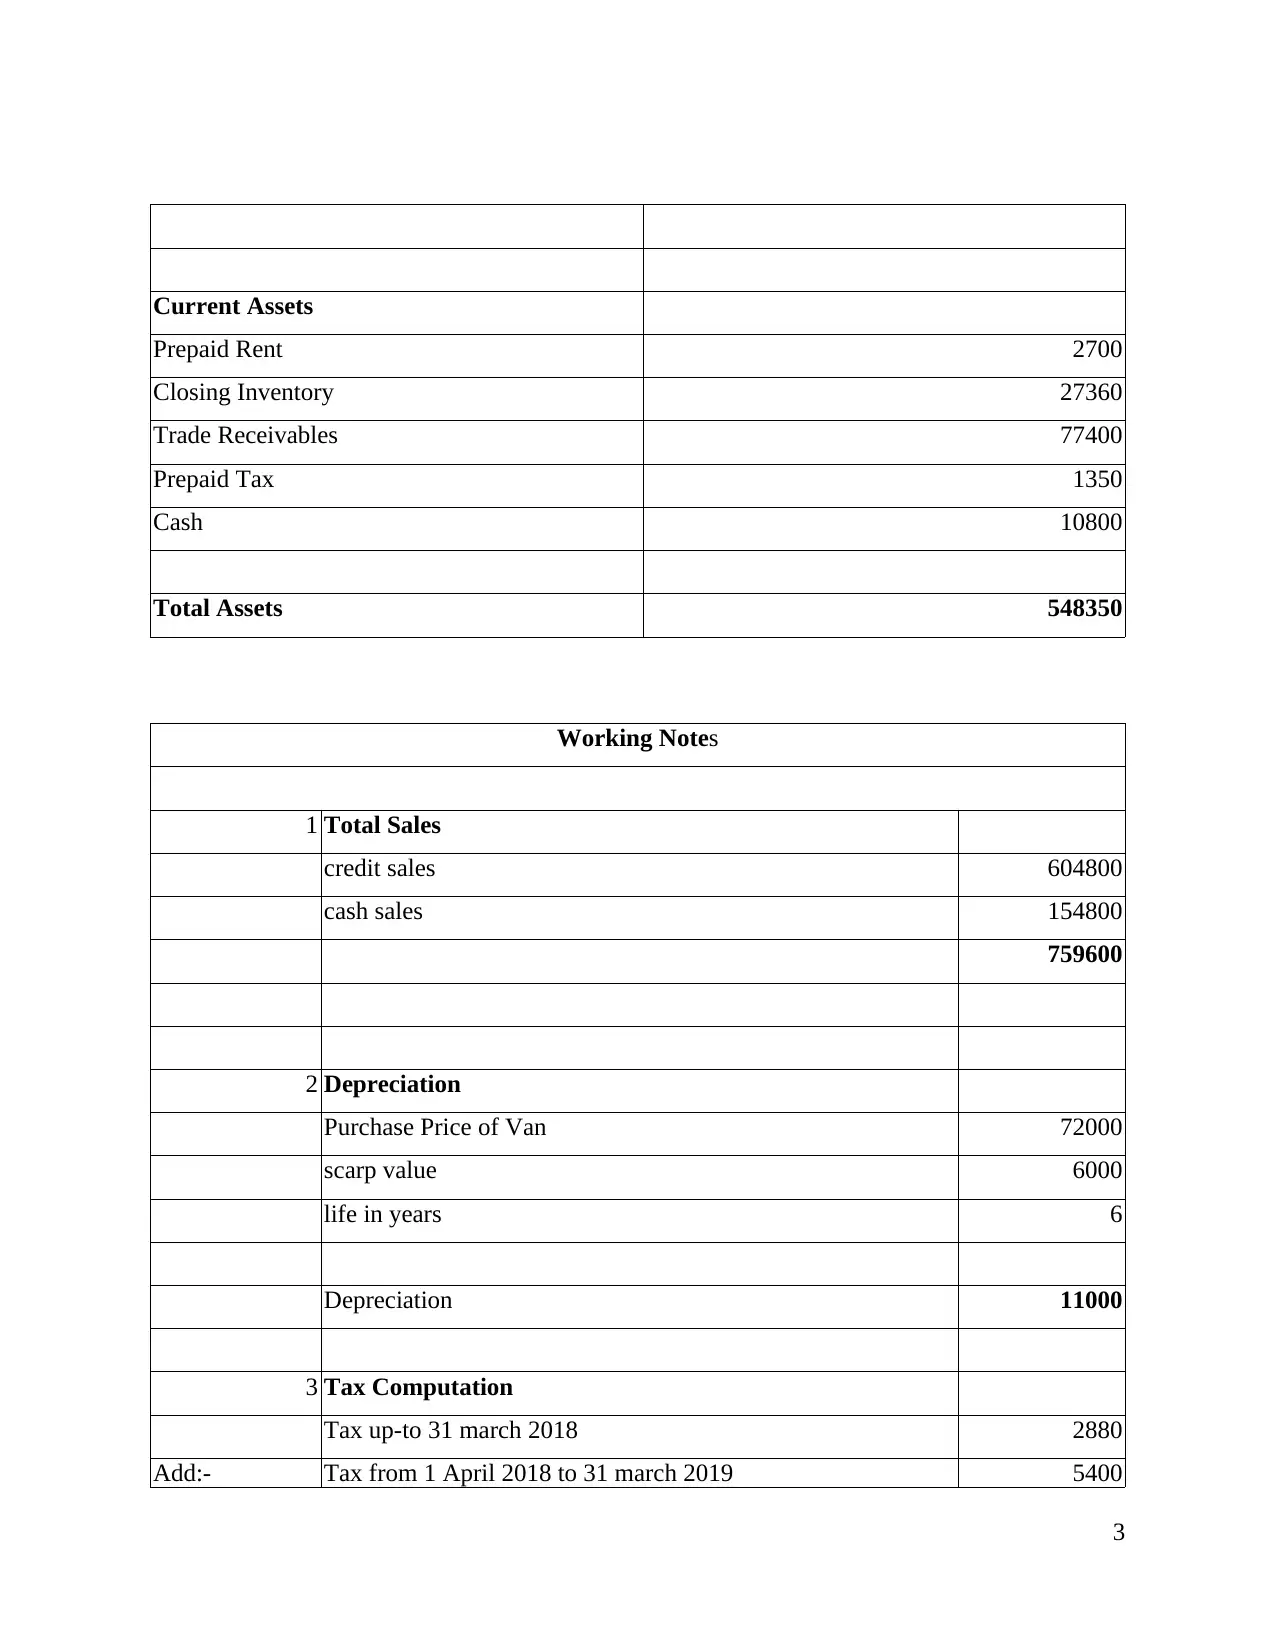
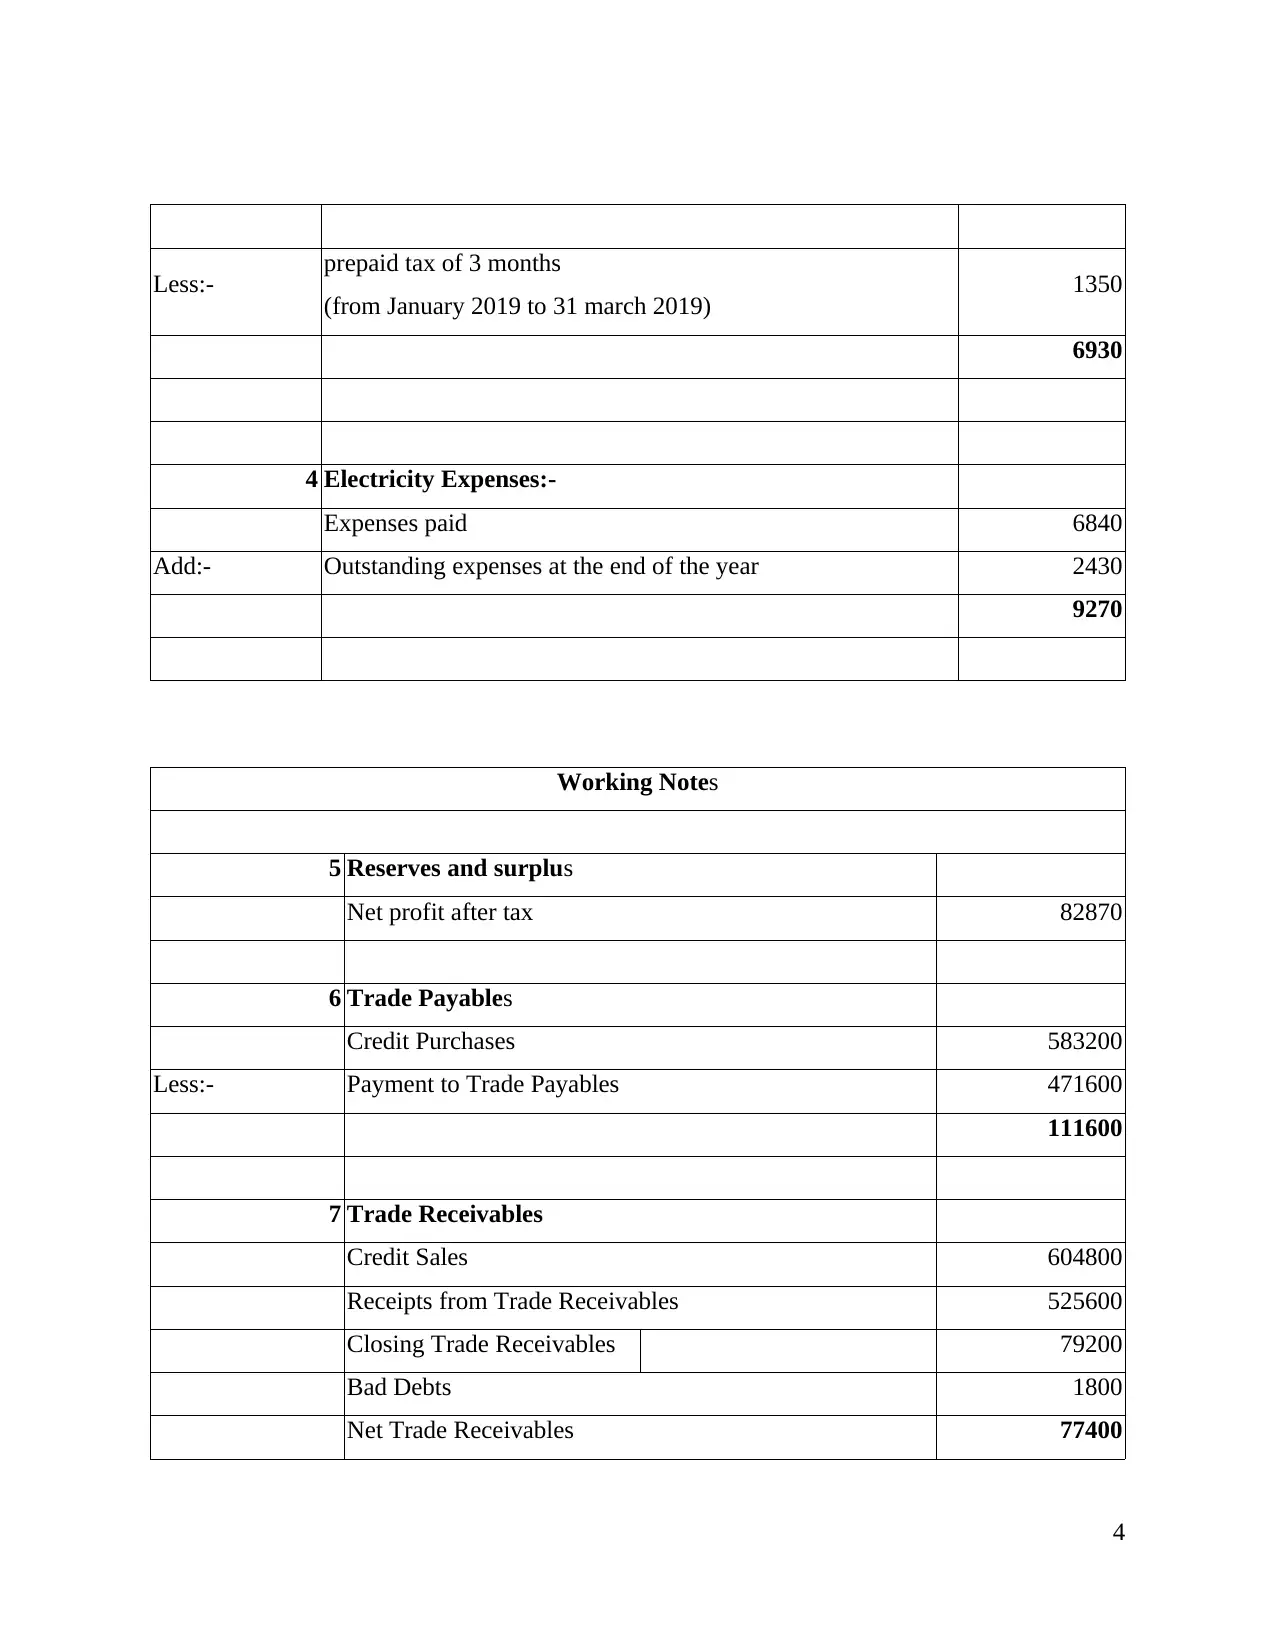
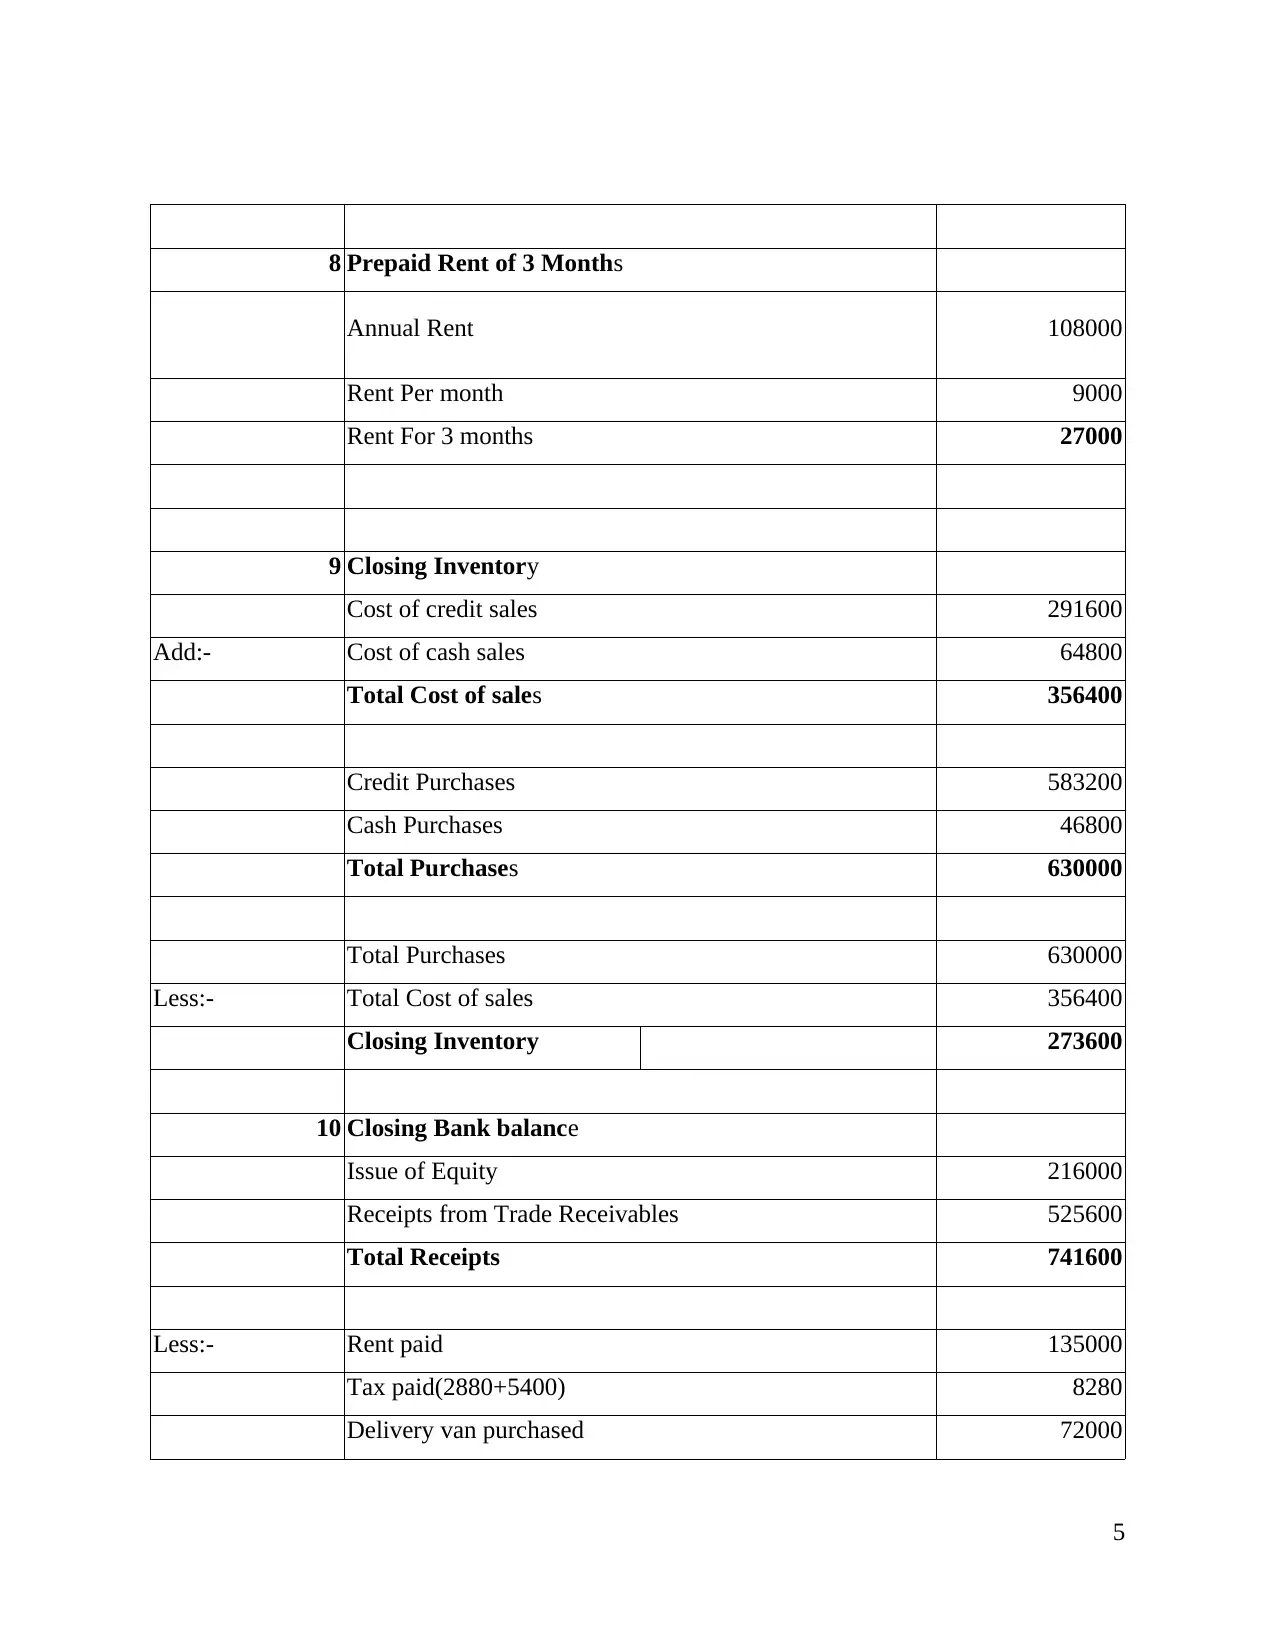
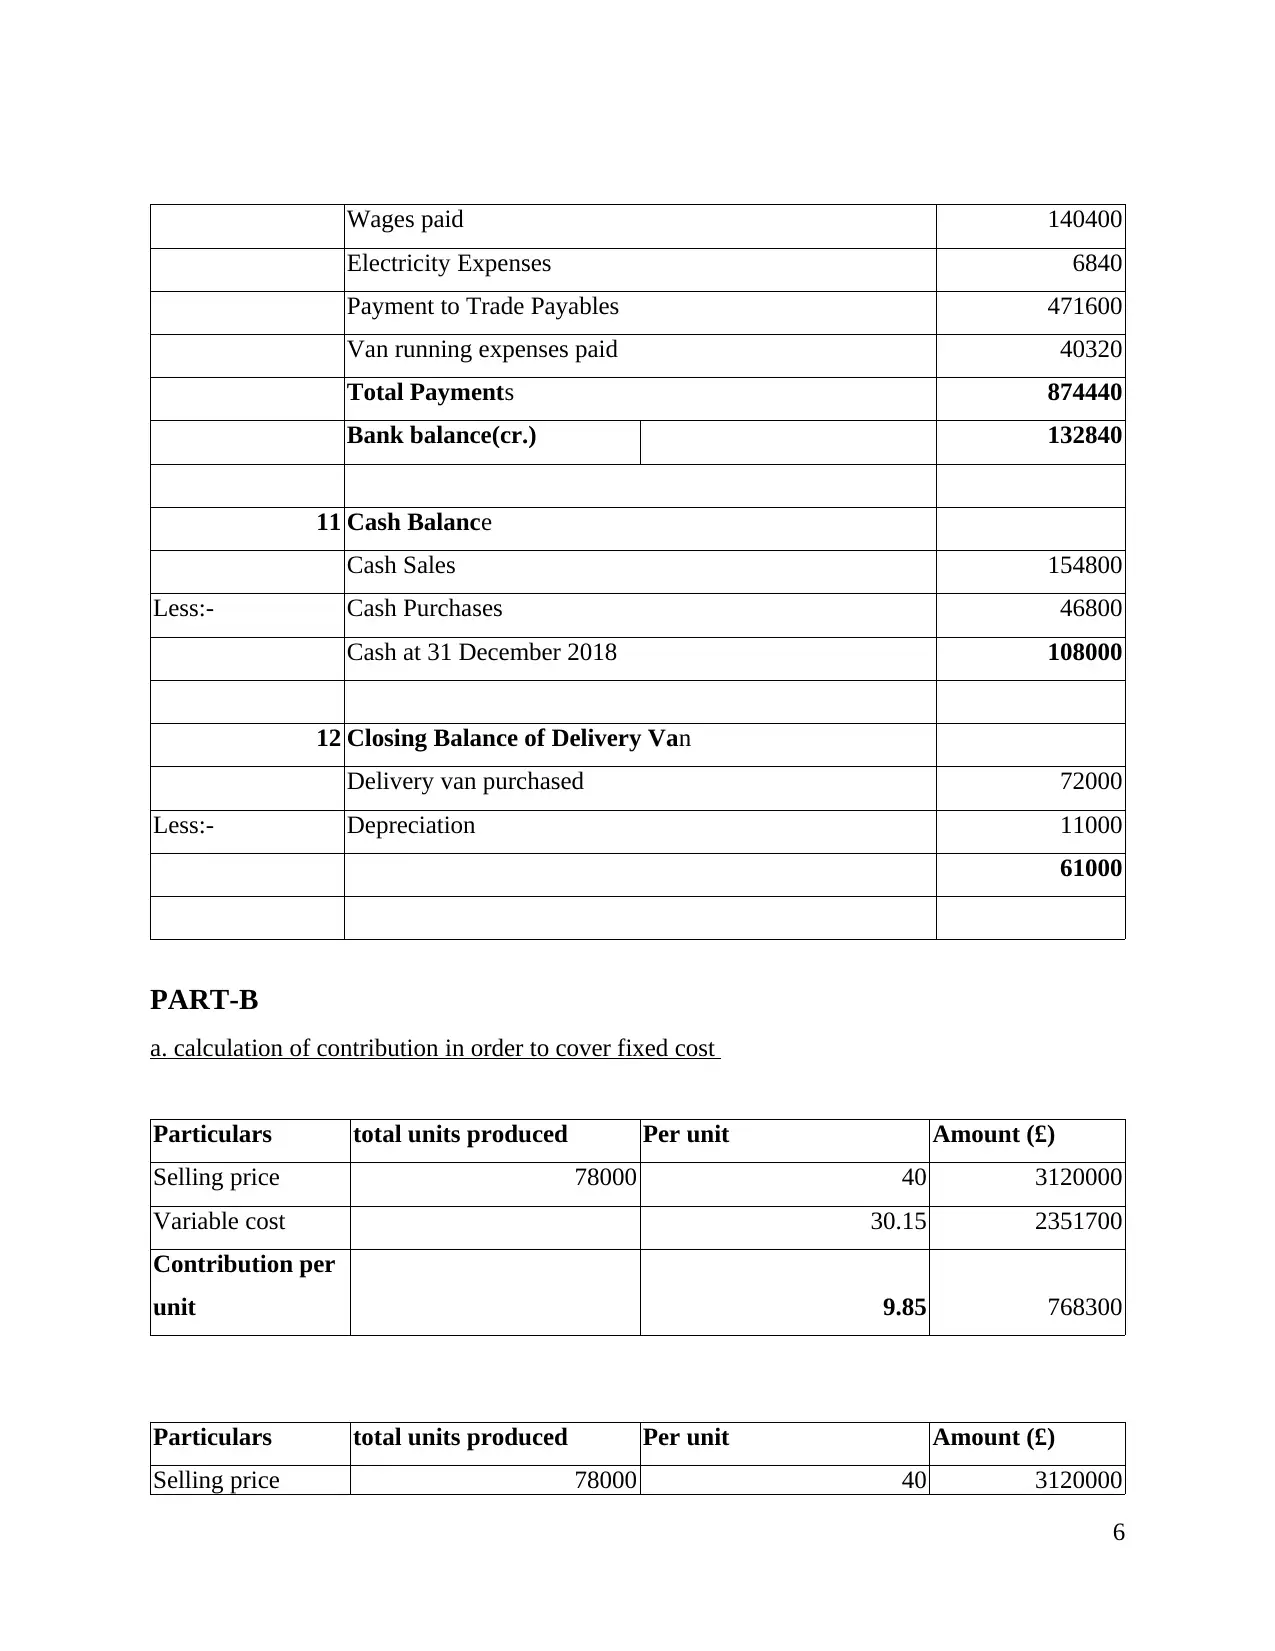
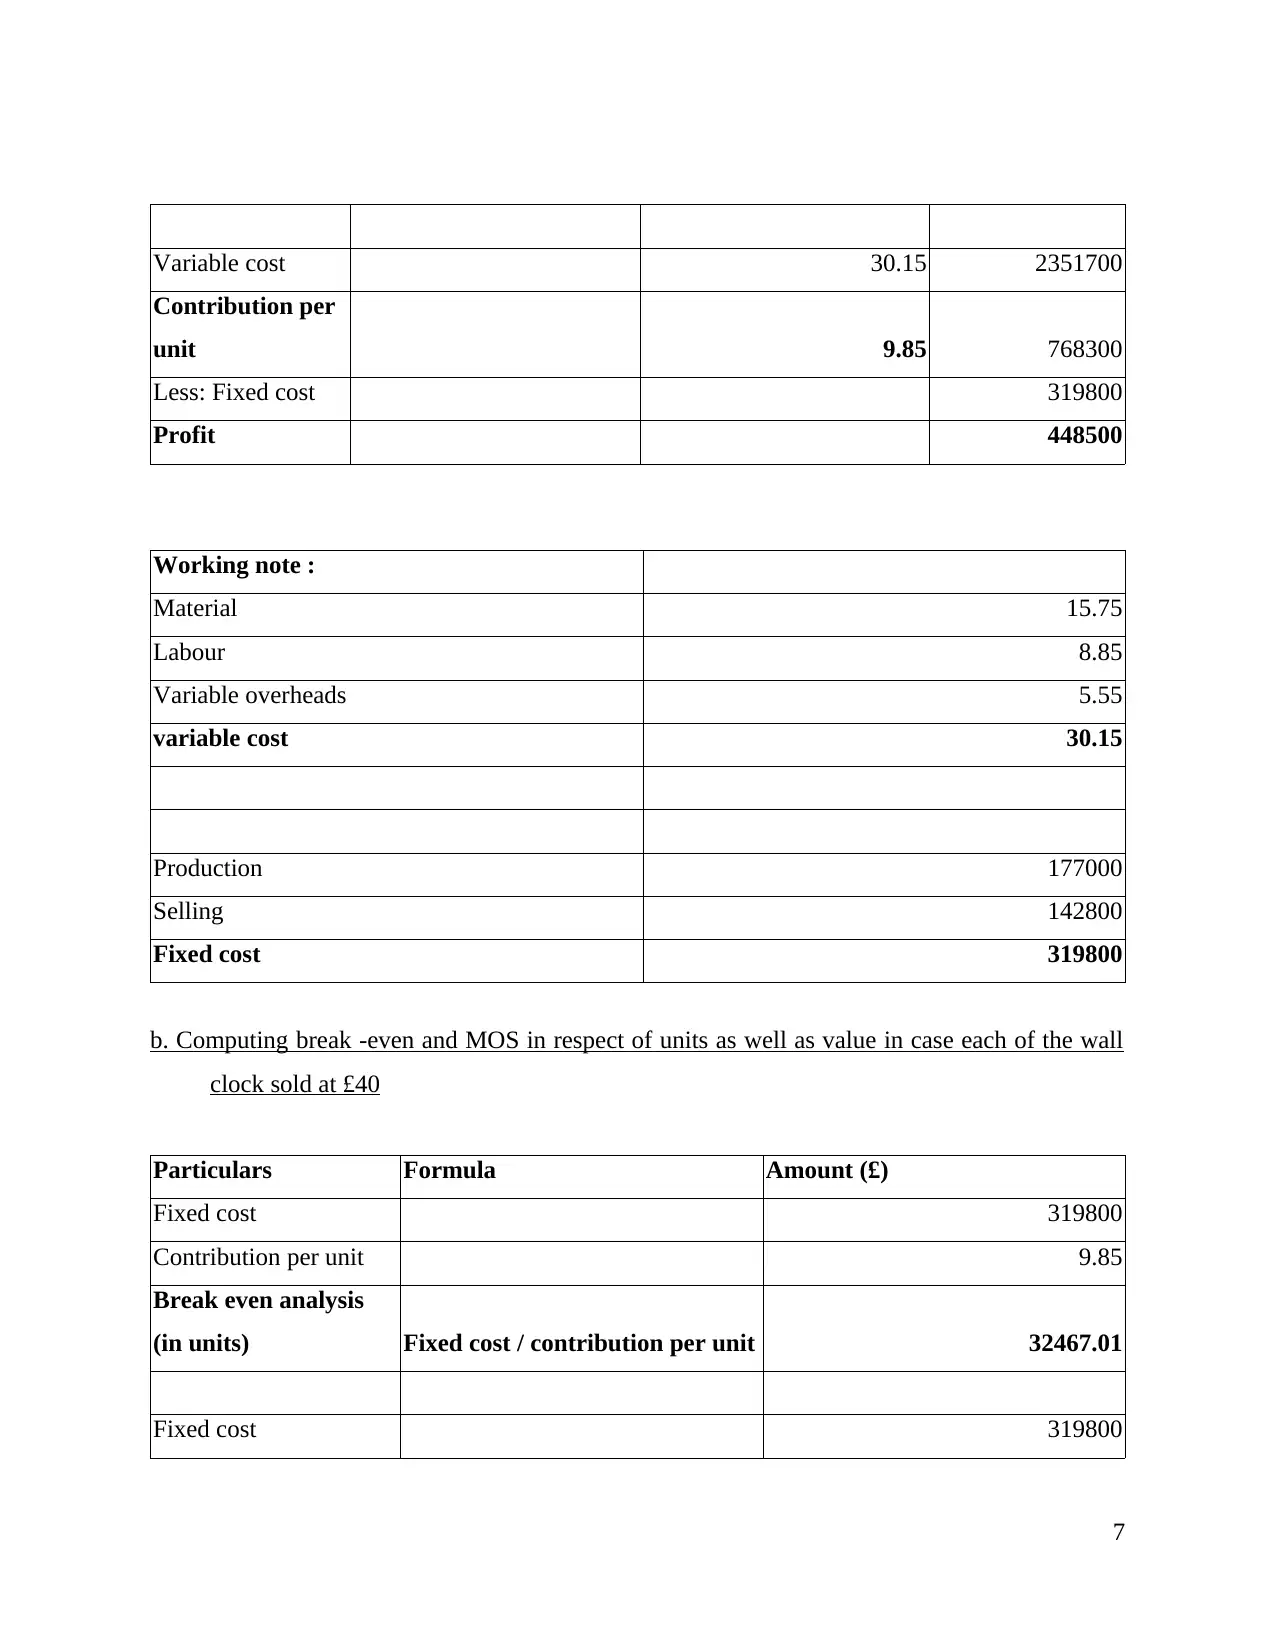
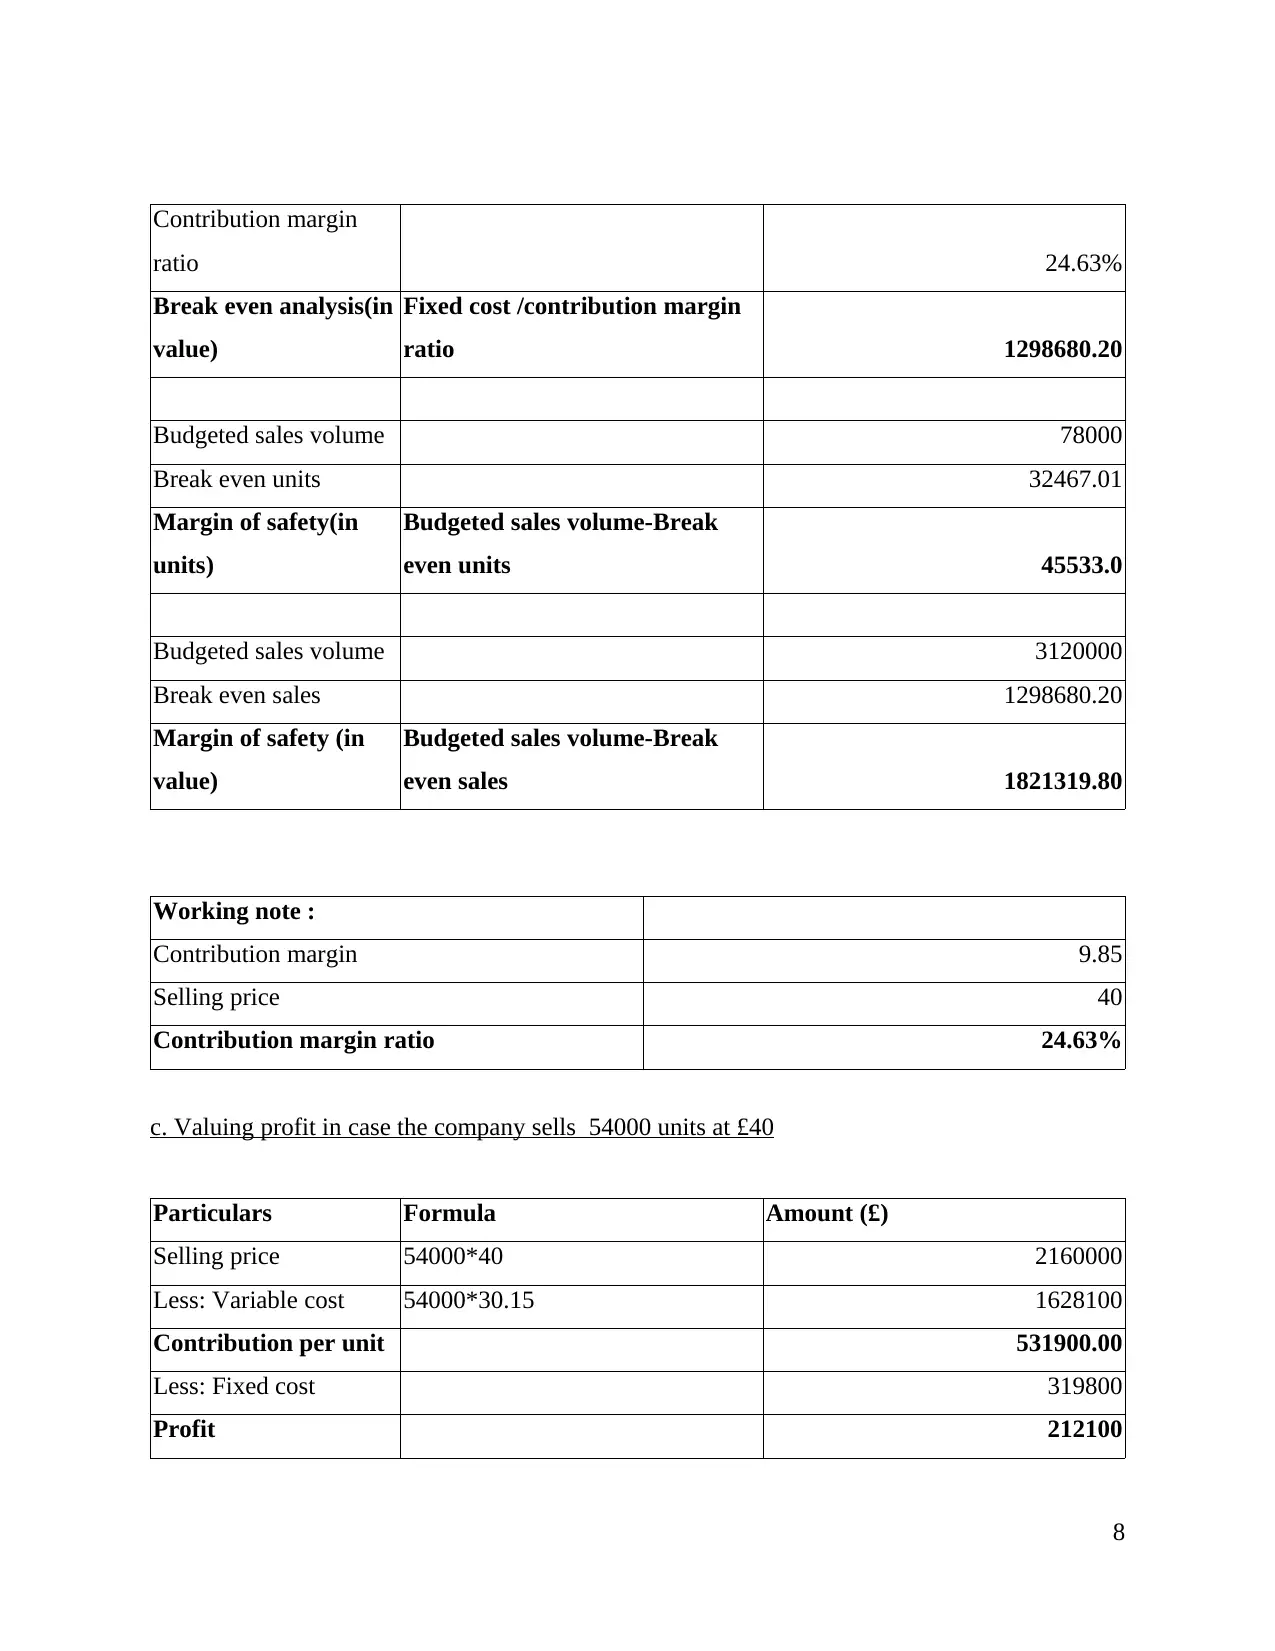
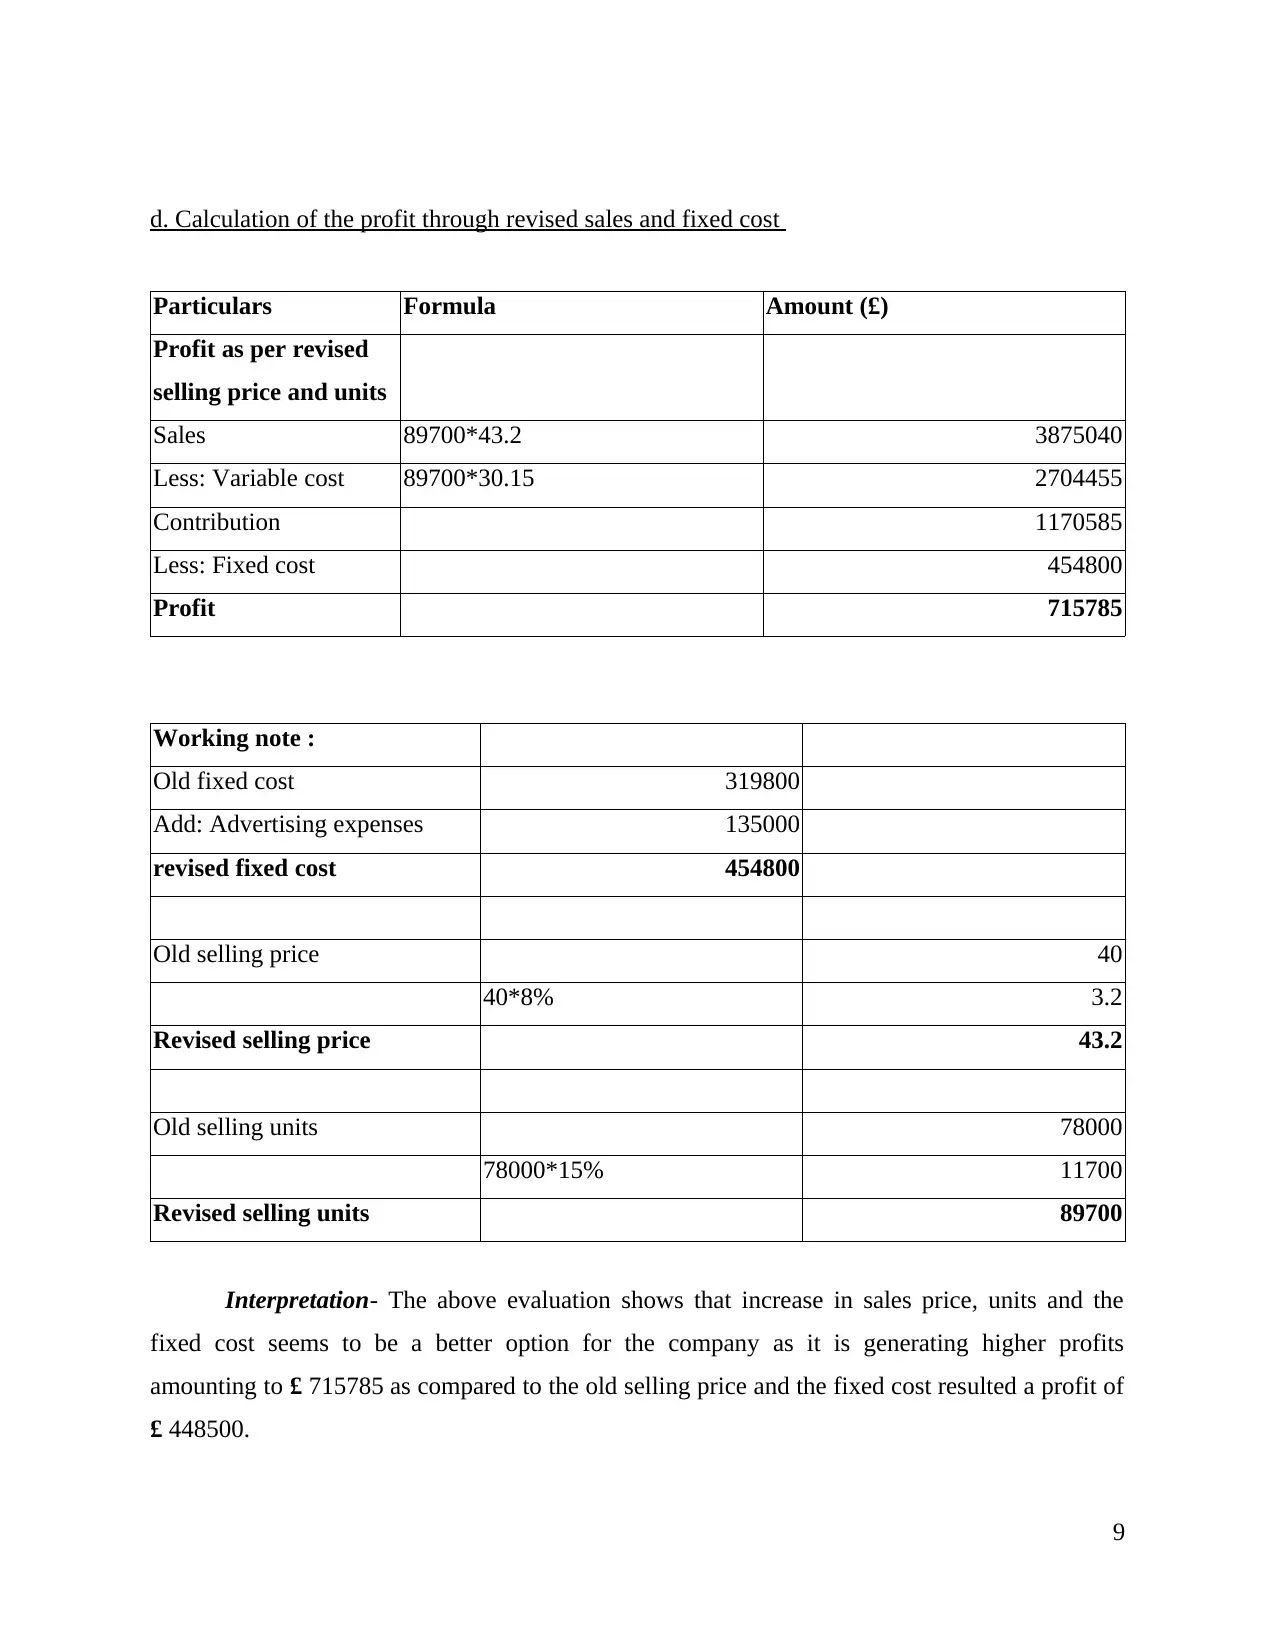
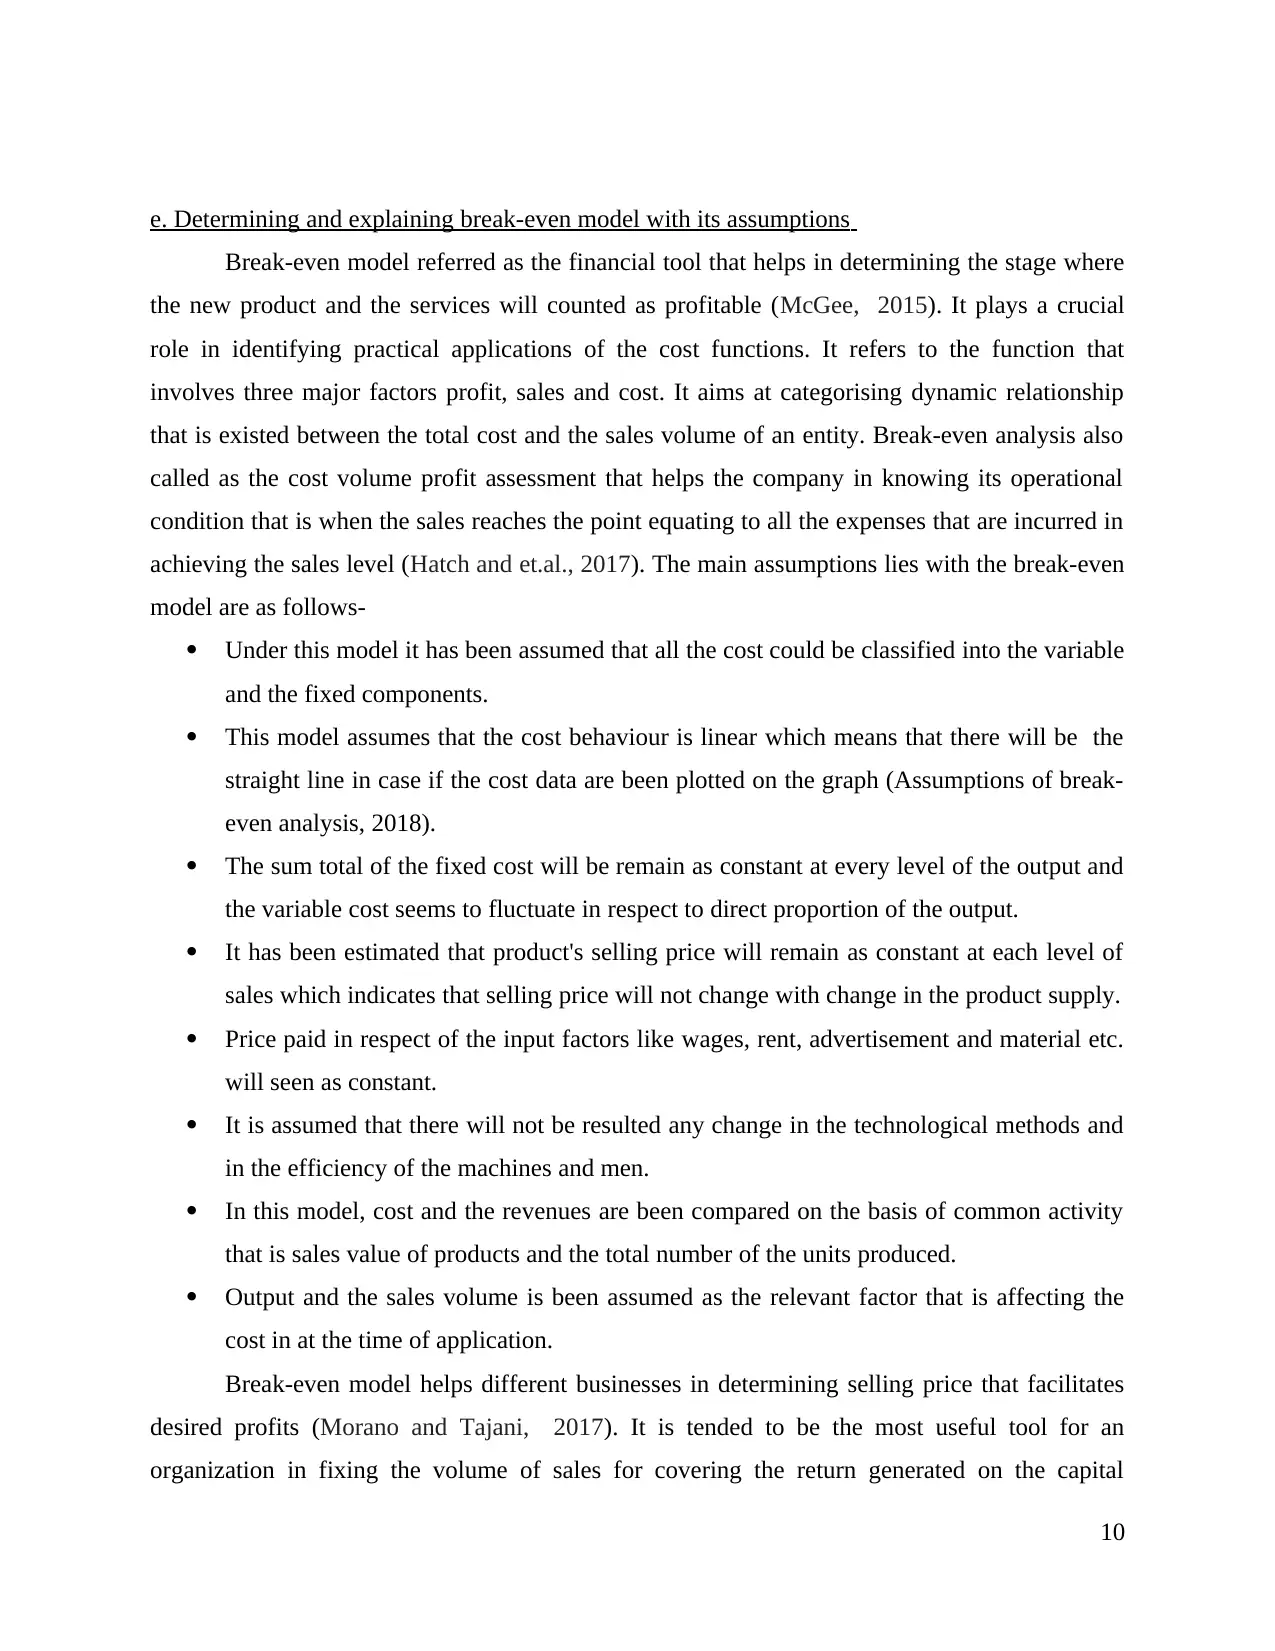
This report presents a comprehensive financial analysis, encompassing the preparation of income statements and balance sheets for Terroy Plc, reflecting its financial position. It delves into the computation of contribution per unit, break-even assessment, profit evaluation, and margin of safety for Koklet Ltd, assessing its profitability. Furthermore, the report explores investment appraisal tools, including payback period, Net Present Value (NPV), and Accounting Rate of Return (ARR), to evaluate project viability. It also examines capital budgeting techniques, including their merits and demerits, offering insights for informed decision-making. The report includes detailed calculations and interpretations of financial data, providing a robust understanding of financial performance and investment analysis.

Accounting
Paraphrase This Document
Need a fresh take? Get an instant paraphrase of this document with our AI Paraphraser

TABLE OF CONTENTS
INTRODUCTION...........................................................................................................................1
PART-A...........................................................................................................................................1
PART-B...........................................................................................................................................6
a. calculation of contribution in order to cover fixed cost..........................................................6
b. Computing break -even and MOS in respect of units as well as value in case each of the
wall clock sold at £40..................................................................................................................7
c. Valuing profit in case the company sells 54000 units at £40.................................................8
d. Calculation of the profit through revised sales and fixed cost................................................9
e. Determining and explaining break-even model with its assumptions...................................10
PART-C.........................................................................................................................................11
a. Assessing viability of project using investment appraisal tools and techniques..................11
b. Explaining and assessing benefits and the limitation of capital budgeting tools..................13
Identifying and explaining key benefits as well as drawbacks associated with budgeting
aspects.......................................................................................................................................15
CONCLUSION..............................................................................................................................16
REFERENCES..............................................................................................................................18

INTRODUCTION
Accounting refers to recording of the business transactions with storing, retrieving,
summarizing, sorting and communicating results in several reports for the users so that they
could assess the results and can make suitable decisions accordingly. The present study focuses
on preparation of the income statement and balance sheet of Terroy Plc which reflects its
financial performance and position in an overall industry. Furthermore, the study includes
computation of contribution per unit, break even assessment, profit evaluation and margin of
safety for Koklet Ltd in order to analyse that its operations are generating sufficient profits after
the payment fixed expenses and the variable cost. Moreover, the report highlights computation of
returns that the project will generate through application of various investment appraisal tools. It
also provides for a deeper insights towards different capital budgeting techniques with their
merits and demerits to the company.
PART-A
Income Statement
For the year ended 31 December 2018
Particulars Amount(
£)
Amount(
£)
Revenues:-
Sales(604800+154800) 759600
Other income 0
Total Revenues 759600
Expenses:-
COGS 291600
64800 356400
Depreciation 11000
1
⊘ This is a preview!⊘
Do you want full access?
Subscribe today to unlock all pages.

Trusted by 1+ million students worldwide

Wages 140400
Add Outstanding wages at period end 2610 143010
Electricity Expenses 9270
Van running expenses 40320
Bad debts 1800
Rent paid 135000
Less:- prepaid rent at period end 27000 108000
Total Expenses:- 669800
Net profit before tax 89800
Less:- Tax paid 6930
Net profit after tax 82870
Balance sheet
Particulars Total Amount (£)
Liabilities
Shareholder's Equity 216000
Equity share capital 82870
Reserves and surplus
Current Liabilities
Outstanding Wages 2610
Outstanding Electricity Expenses 2430
Trade Payables 111600
Bank Overdraft 132840
Total Liabilities 548350
Fixed Assets
Delivery Van 61000
2
Paraphrase This Document
Need a fresh take? Get an instant paraphrase of this document with our AI Paraphraser

Current Assets
Prepaid Rent 2700
Closing Inventory 27360
Trade Receivables 77400
Prepaid Tax 1350
Cash 10800
Total Assets 548350
Working Notes
1 Total Sales
credit sales 604800
cash sales 154800
759600
2 Depreciation
Purchase Price of Van 72000
scarp value 6000
life in years 6
Depreciation 11000
3 Tax Computation
Tax up-to 31 march 2018 2880
Add:- Tax from 1 April 2018 to 31 march 2019 5400
3

Less:- prepaid tax of 3 months
(from January 2019 to 31 march 2019) 1350
6930
4 Electricity Expenses:-
Expenses paid 6840
Add:- Outstanding expenses at the end of the year 2430
9270
Working Notes
5 Reserves and surplus
Net profit after tax 82870
6 Trade Payables
Credit Purchases 583200
Less:- Payment to Trade Payables 471600
111600
7 Trade Receivables
Credit Sales 604800
Receipts from Trade Receivables 525600
Closing Trade Receivables 79200
Bad Debts 1800
Net Trade Receivables 77400
4
⊘ This is a preview!⊘
Do you want full access?
Subscribe today to unlock all pages.

Trusted by 1+ million students worldwide

8 Prepaid Rent of 3 Months
Annual Rent 108000
Rent Per month 9000
Rent For 3 months 27000
9 Closing Inventory
Cost of credit sales 291600
Add:- Cost of cash sales 64800
Total Cost of sales 356400
Credit Purchases 583200
Cash Purchases 46800
Total Purchases 630000
Less:- Total Cost of sales 356400
Closing Inventory 273600
10 Closing Bank balance
Issue of Equity 216000
Receipts from Trade Receivables 525600
Total Receipts 741600
Less:- Rent paid 135000
Tax paid(2880+5400) 8280
Delivery van purchased 72000
5
Paraphrase This Document
Need a fresh take? Get an instant paraphrase of this document with our AI Paraphraser

Wages paid 140400
Electricity Expenses 6840
Payment to Trade Payables 471600
Van running expenses paid 40320
Total Payments 874440
Bank balance(cr.) 132840
11 Cash Balance
Cash Sales 154800
Less:- Cash Purchases 46800
Cash at 31 December 2018 108000
12 Closing Balance of Delivery Van
Delivery van purchased 72000
Less:- Depreciation 11000
61000
PART-B
a. calculation of contribution in order to cover fixed cost
Particulars total units produced Per unit Amount (£)
Selling price 78000 40 3120000
Variable cost 30.15 2351700
Contribution per
unit 9.85 768300
Particulars total units produced Per unit Amount (£)
Selling price 78000 40 3120000
6

Variable cost 30.15 2351700
Contribution per
unit 9.85 768300
Less: Fixed cost 319800
Profit 448500
Working note :
Material 15.75
Labour 8.85
Variable overheads 5.55
variable cost 30.15
Production 177000
Selling 142800
Fixed cost 319800
b. Computing break -even and MOS in respect of units as well as value in case each of the wall
clock sold at £40
Particulars Formula Amount (£)
Fixed cost 319800
Contribution per unit 9.85
Break even analysis
(in units) Fixed cost / contribution per unit 32467.01
Fixed cost 319800
7
⊘ This is a preview!⊘
Do you want full access?
Subscribe today to unlock all pages.

Trusted by 1+ million students worldwide

Contribution margin
ratio 24.63%
Break even analysis(in
value)
Fixed cost /contribution margin
ratio 1298680.20
Budgeted sales volume 78000
Break even units 32467.01
Margin of safety(in
units)
Budgeted sales volume-Break
even units 45533.0
Budgeted sales volume 3120000
Break even sales 1298680.20
Margin of safety (in
value)
Budgeted sales volume-Break
even sales 1821319.80
Working note :
Contribution margin 9.85
Selling price 40
Contribution margin ratio 24.63%
c. Valuing profit in case the company sells 54000 units at £40
Particulars Formula Amount (£)
Selling price 54000*40 2160000
Less: Variable cost 54000*30.15 1628100
Contribution per unit 531900.00
Less: Fixed cost 319800
Profit 212100
8
Paraphrase This Document
Need a fresh take? Get an instant paraphrase of this document with our AI Paraphraser

d. Calculation of the profit through revised sales and fixed cost
Particulars Formula Amount (£)
Profit as per revised
selling price and units
Sales 89700*43.2 3875040
Less: Variable cost 89700*30.15 2704455
Contribution 1170585
Less: Fixed cost 454800
Profit 715785
Working note :
Old fixed cost 319800
Add: Advertising expenses 135000
revised fixed cost 454800
Old selling price 40
40*8% 3.2
Revised selling price 43.2
Old selling units 78000
78000*15% 11700
Revised selling units 89700
Interpretation- The above evaluation shows that increase in sales price, units and the
fixed cost seems to be a better option for the company as it is generating higher profits
amounting to £ 715785 as compared to the old selling price and the fixed cost resulted a profit of
£ 448500.
9

e. Determining and explaining break-even model with its assumptions
Break-even model referred as the financial tool that helps in determining the stage where
the new product and the services will counted as profitable (McGee, 2015). It plays a crucial
role in identifying practical applications of the cost functions. It refers to the function that
involves three major factors profit, sales and cost. It aims at categorising dynamic relationship
that is existed between the total cost and the sales volume of an entity. Break-even analysis also
called as the cost volume profit assessment that helps the company in knowing its operational
condition that is when the sales reaches the point equating to all the expenses that are incurred in
achieving the sales level (Hatch and et.al., 2017). The main assumptions lies with the break-even
model are as follows-
Under this model it has been assumed that all the cost could be classified into the variable
and the fixed components.
This model assumes that the cost behaviour is linear which means that there will be the
straight line in case if the cost data are been plotted on the graph (Assumptions of break-
even analysis, 2018).
The sum total of the fixed cost will be remain as constant at every level of the output and
the variable cost seems to fluctuate in respect to direct proportion of the output.
It has been estimated that product's selling price will remain as constant at each level of
sales which indicates that selling price will not change with change in the product supply.
Price paid in respect of the input factors like wages, rent, advertisement and material etc.
will seen as constant.
It is assumed that there will not be resulted any change in the technological methods and
in the efficiency of the machines and men.
In this model, cost and the revenues are been compared on the basis of common activity
that is sales value of products and the total number of the units produced.
Output and the sales volume is been assumed as the relevant factor that is affecting the
cost in at the time of application.
Break-even model helps different businesses in determining selling price that facilitates
desired profits (Morano and Tajani, 2017). It is tended to be the most useful tool for an
organization in fixing the volume of sales for covering the return generated on the capital
10
⊘ This is a preview!⊘
Do you want full access?
Subscribe today to unlock all pages.

Trusted by 1+ million students worldwide
1 out of 21
Related Documents

Your All-in-One AI-Powered Toolkit for Academic Success.
+13062052269
info@desklib.com
Available 24*7 on WhatsApp / Email
Unlock your academic potential
Copyright © 2020–2025 A2Z Services. All Rights Reserved. Developed and managed by ZUCOL.