Analysis and Comparison of Vodafone and BT Group Accounting Report
VerifiedAdded on 2020/02/05
|11
|3952
|154
Report
AI Summary
This report provides an introduction to accounting, focusing on the financial performance of two telecommunications companies: Vodafone and BT Group. It begins with a comparison of the companies, highlighting their market positions, revenue, operating income, and workforce size. The core of the report involves a detailed analysis of financial ratios, including profitability (operating profit, operating ratio, and net profit ratios), liquidity (current, quick, and cash ratios), and efficiency (total asset turnover, inventory turnover, and accounts receivable turnover ratios) for both companies over a three-year period (2013-2015). The analysis of these ratios allows for a deeper understanding of each company's financial health, operational efficiency, and overall market performance, with a conclusion that Vodafone's performance appears stronger. The report aims to provide a comprehensive overview of the companies' financial standings and offers valuable insights into their respective strengths and weaknesses.
Introduction to
Accounting
1
Accounting
1
Paraphrase This Document
Need a fresh take? Get an instant paraphrase of this document with our AI Paraphraser
TABLE OF CONTENTS
Table of Contents.............................................................................................................................2
INTRODUCTION...........................................................................................................................3
ANALYSIS/ COMPARISON OF THE PERFORMANCE OF TWO COMPANIES....................3
CALCULATION OF RATIOS........................................................................................................4
CONCLUSION and RECOMMENDATION..................................................................................8
REFERENCES................................................................................................................................9
2
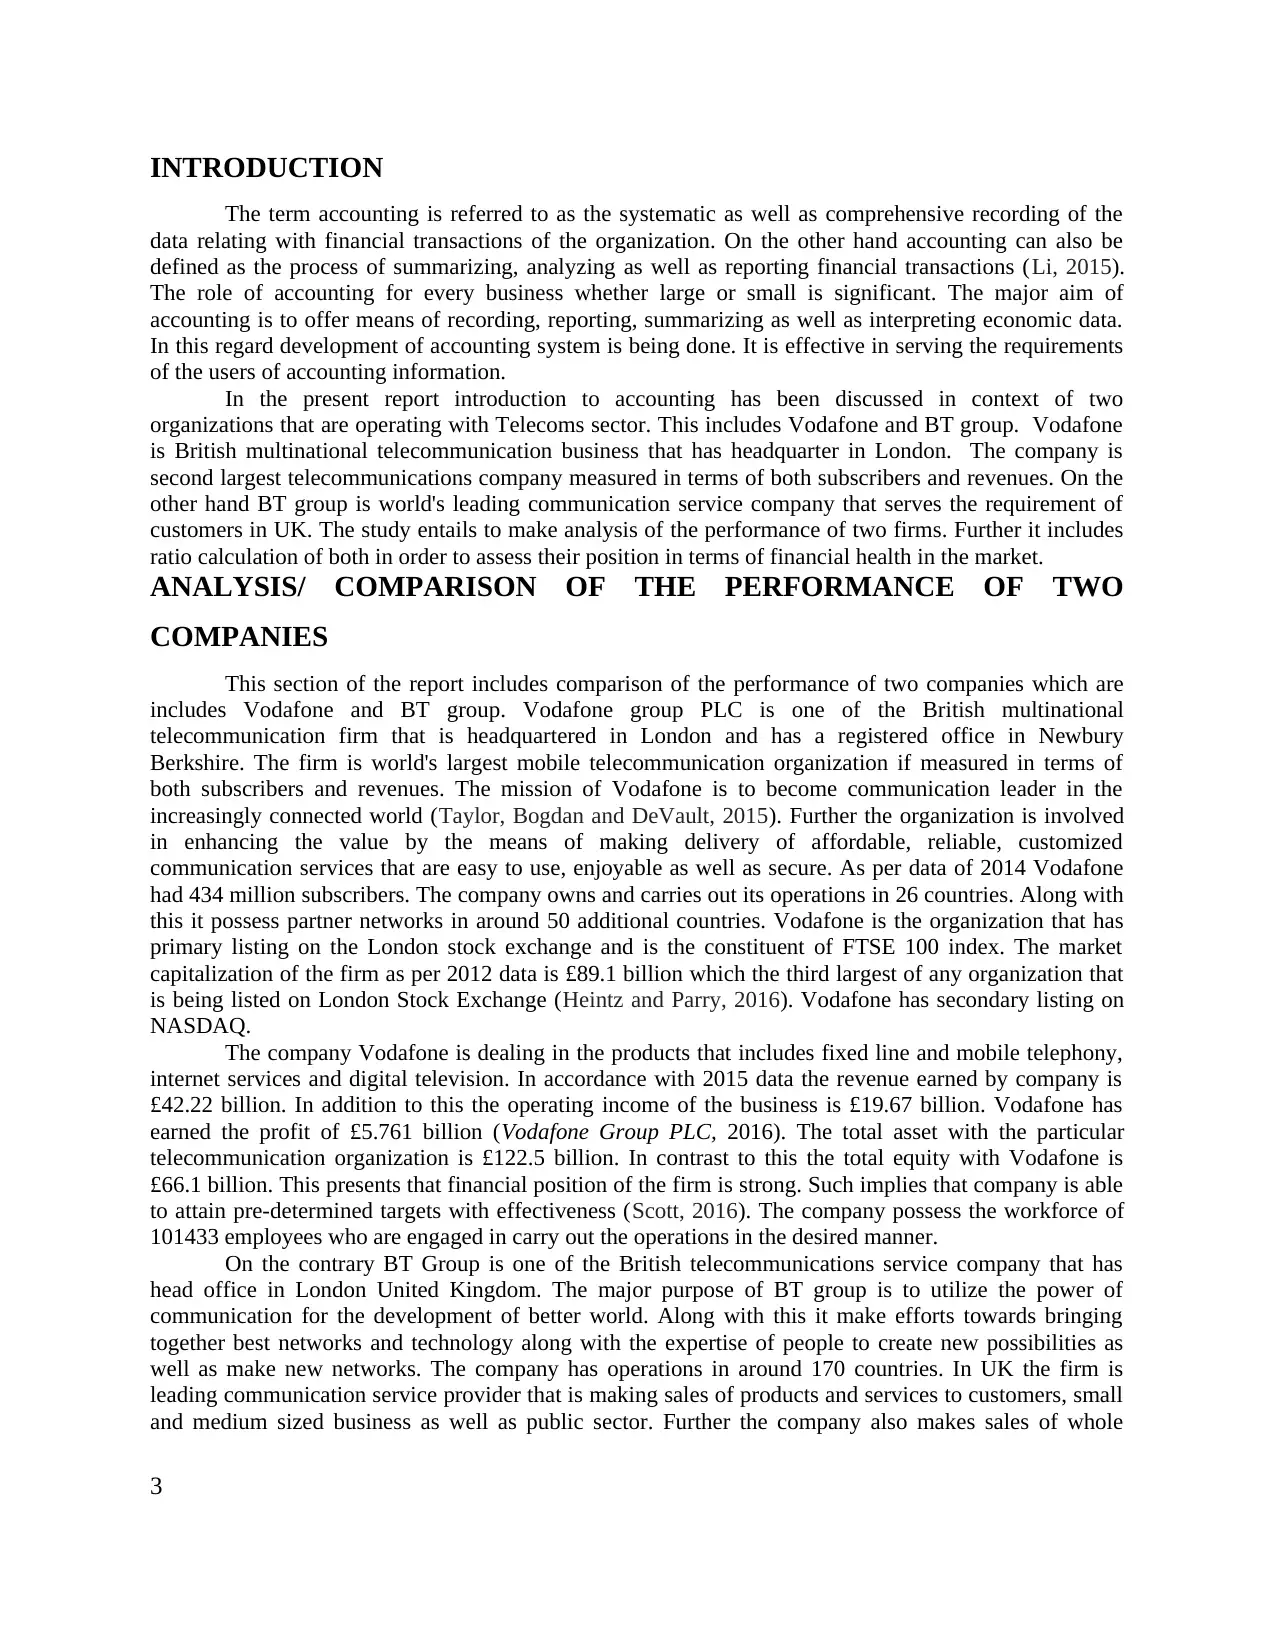
INTRODUCTION
The term accounting is referred to as the systematic as well as comprehensive recording of the
data relating with financial transactions of the organization. On the other hand accounting can also be
defined as the process of summarizing, analyzing as well as reporting financial transactions (Li, 2015).
The role of accounting for every business whether large or small is significant. The major aim of
accounting is to offer means of recording, reporting, summarizing as well as interpreting economic data.
In this regard development of accounting system is being done. It is effective in serving the requirements
of the users of accounting information.
In the present report introduction to accounting has been discussed in context of two
organizations that are operating with Telecoms sector. This includes Vodafone and BT group. Vodafone
is British multinational telecommunication business that has headquarter in London. The company is
second largest telecommunications company measured in terms of both subscribers and revenues. On the
other hand BT group is world's leading communication service company that serves the requirement of
customers in UK. The study entails to make analysis of the performance of two firms. Further it includes
ratio calculation of both in order to assess their position in terms of financial health in the market.
ANALYSIS/ COMPARISON OF THE PERFORMANCE OF TWO
COMPANIES
This section of the report includes comparison of the performance of two companies which are
includes Vodafone and BT group. Vodafone group PLC is one of the British multinational
telecommunication firm that is headquartered in London and has a registered office in Newbury
Berkshire. The firm is world's largest mobile telecommunication organization if measured in terms of
both subscribers and revenues. The mission of Vodafone is to become communication leader in the
increasingly connected world (Taylor, Bogdan and DeVault, 2015). Further the organization is involved
in enhancing the value by the means of making delivery of affordable, reliable, customized
communication services that are easy to use, enjoyable as well as secure. As per data of 2014 Vodafone
had 434 million subscribers. The company owns and carries out its operations in 26 countries. Along with
this it possess partner networks in around 50 additional countries. Vodafone is the organization that has
primary listing on the London stock exchange and is the constituent of FTSE 100 index. The market
capitalization of the firm as per 2012 data is £89.1 billion which the third largest of any organization that
is being listed on London Stock Exchange (Heintz and Parry, 2016). Vodafone has secondary listing on
NASDAQ.
The company Vodafone is dealing in the products that includes fixed line and mobile telephony,
internet services and digital television. In accordance with 2015 data the revenue earned by company is
£42.22 billion. In addition to this the operating income of the business is £19.67 billion. Vodafone has
earned the profit of £5.761 billion (Vodafone Group PLC, 2016). The total asset with the particular
telecommunication organization is £122.5 billion. In contrast to this the total equity with Vodafone is
£66.1 billion. This presents that financial position of the firm is strong. Such implies that company is able
to attain pre-determined targets with effectiveness (Scott, 2016). The company possess the workforce of
101433 employees who are engaged in carry out the operations in the desired manner.
On the contrary BT Group is one of the British telecommunications service company that has
head office in London United Kingdom. The major purpose of BT group is to utilize the power of
communication for the development of better world. Along with this it make efforts towards bringing
together best networks and technology along with the expertise of people to create new possibilities as
well as make new networks. The company has operations in around 170 countries. In UK the firm is
leading communication service provider that is making sales of products and services to customers, small
and medium sized business as well as public sector. Further the company also makes sales of whole
3
⊘ This is a preview!⊘
Do you want full access?
Subscribe today to unlock all pages.
Trusted by 1+ million students worldwide
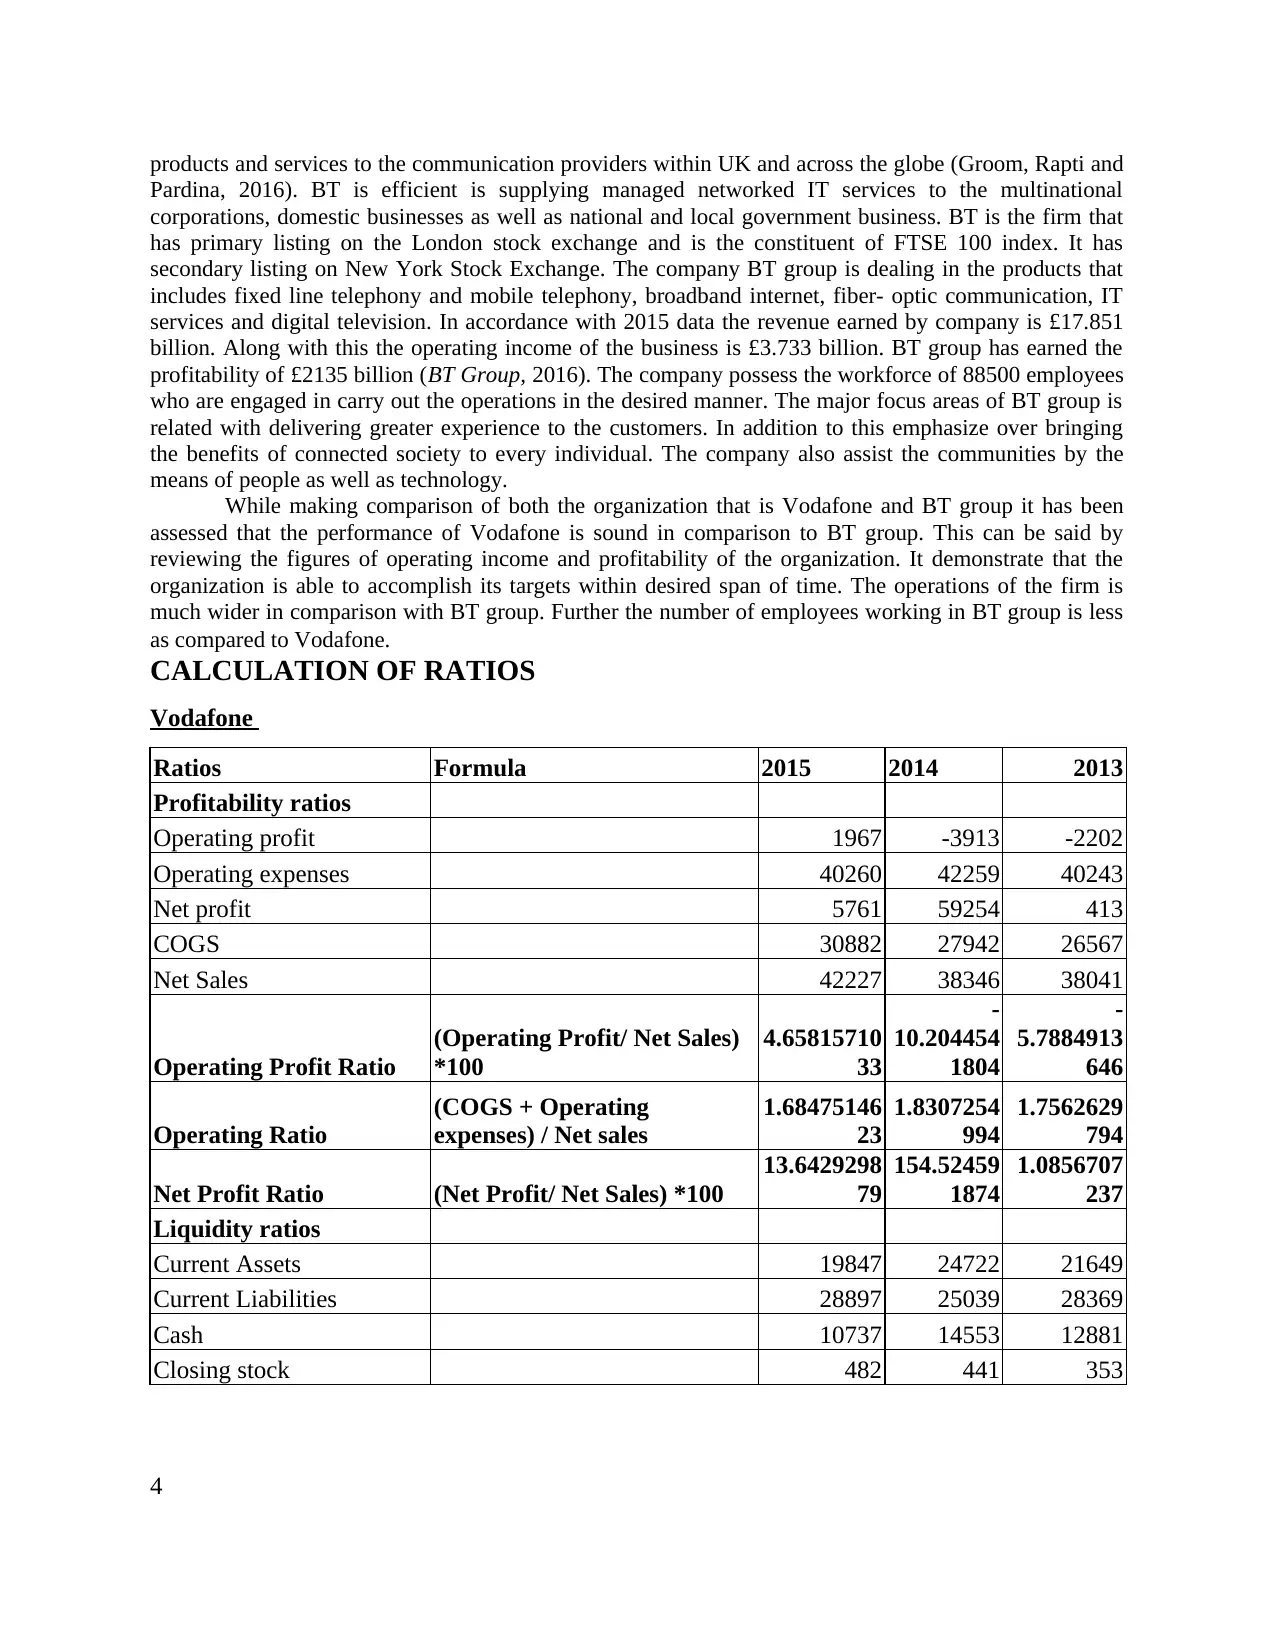
products and services to the communication providers within UK and across the globe (Groom, Rapti and
Pardina, 2016). BT is efficient is supplying managed networked IT services to the multinational
corporations, domestic businesses as well as national and local government business. BT is the firm that
has primary listing on the London stock exchange and is the constituent of FTSE 100 index. It has
secondary listing on New York Stock Exchange. The company BT group is dealing in the products that
includes fixed line telephony and mobile telephony, broadband internet, fiber- optic communication, IT
services and digital television. In accordance with 2015 data the revenue earned by company is £17.851
billion. Along with this the operating income of the business is £3.733 billion. BT group has earned the
profitability of £2135 billion (BT Group, 2016). The company possess the workforce of 88500 employees
who are engaged in carry out the operations in the desired manner. The major focus areas of BT group is
related with delivering greater experience to the customers. In addition to this emphasize over bringing
the benefits of connected society to every individual. The company also assist the communities by the
means of people as well as technology.
While making comparison of both the organization that is Vodafone and BT group it has been
assessed that the performance of Vodafone is sound in comparison to BT group. This can be said by
reviewing the figures of operating income and profitability of the organization. It demonstrate that the
organization is able to accomplish its targets within desired span of time. The operations of the firm is
much wider in comparison with BT group. Further the number of employees working in BT group is less
as compared to Vodafone.
CALCULATION OF RATIOS
Vodafone
Ratios Formula 2015 2014 2013
Profitability ratios
Operating profit 1967 -3913 -2202
Operating expenses 40260 42259 40243
Net profit 5761 59254 413
COGS 30882 27942 26567
Net Sales 42227 38346 38041
Operating Profit Ratio
(Operating Profit/ Net Sales)
*100
4.65815710
33
-
10.204454
1804
-
5.7884913
646
Operating Ratio
(COGS + Operating
expenses) / Net sales
1.68475146
23
1.8307254
994
1.7562629
794
Net Profit Ratio (Net Profit/ Net Sales) *100
13.6429298
79
154.52459
1874
1.0856707
237
Liquidity ratios
Current Assets 19847 24722 21649
Current Liabilities 28897 25039 28369
Cash 10737 14553 12881
Closing stock 482 441 353
4
Paraphrase This Document
Need a fresh take? Get an instant paraphrase of this document with our AI Paraphraser
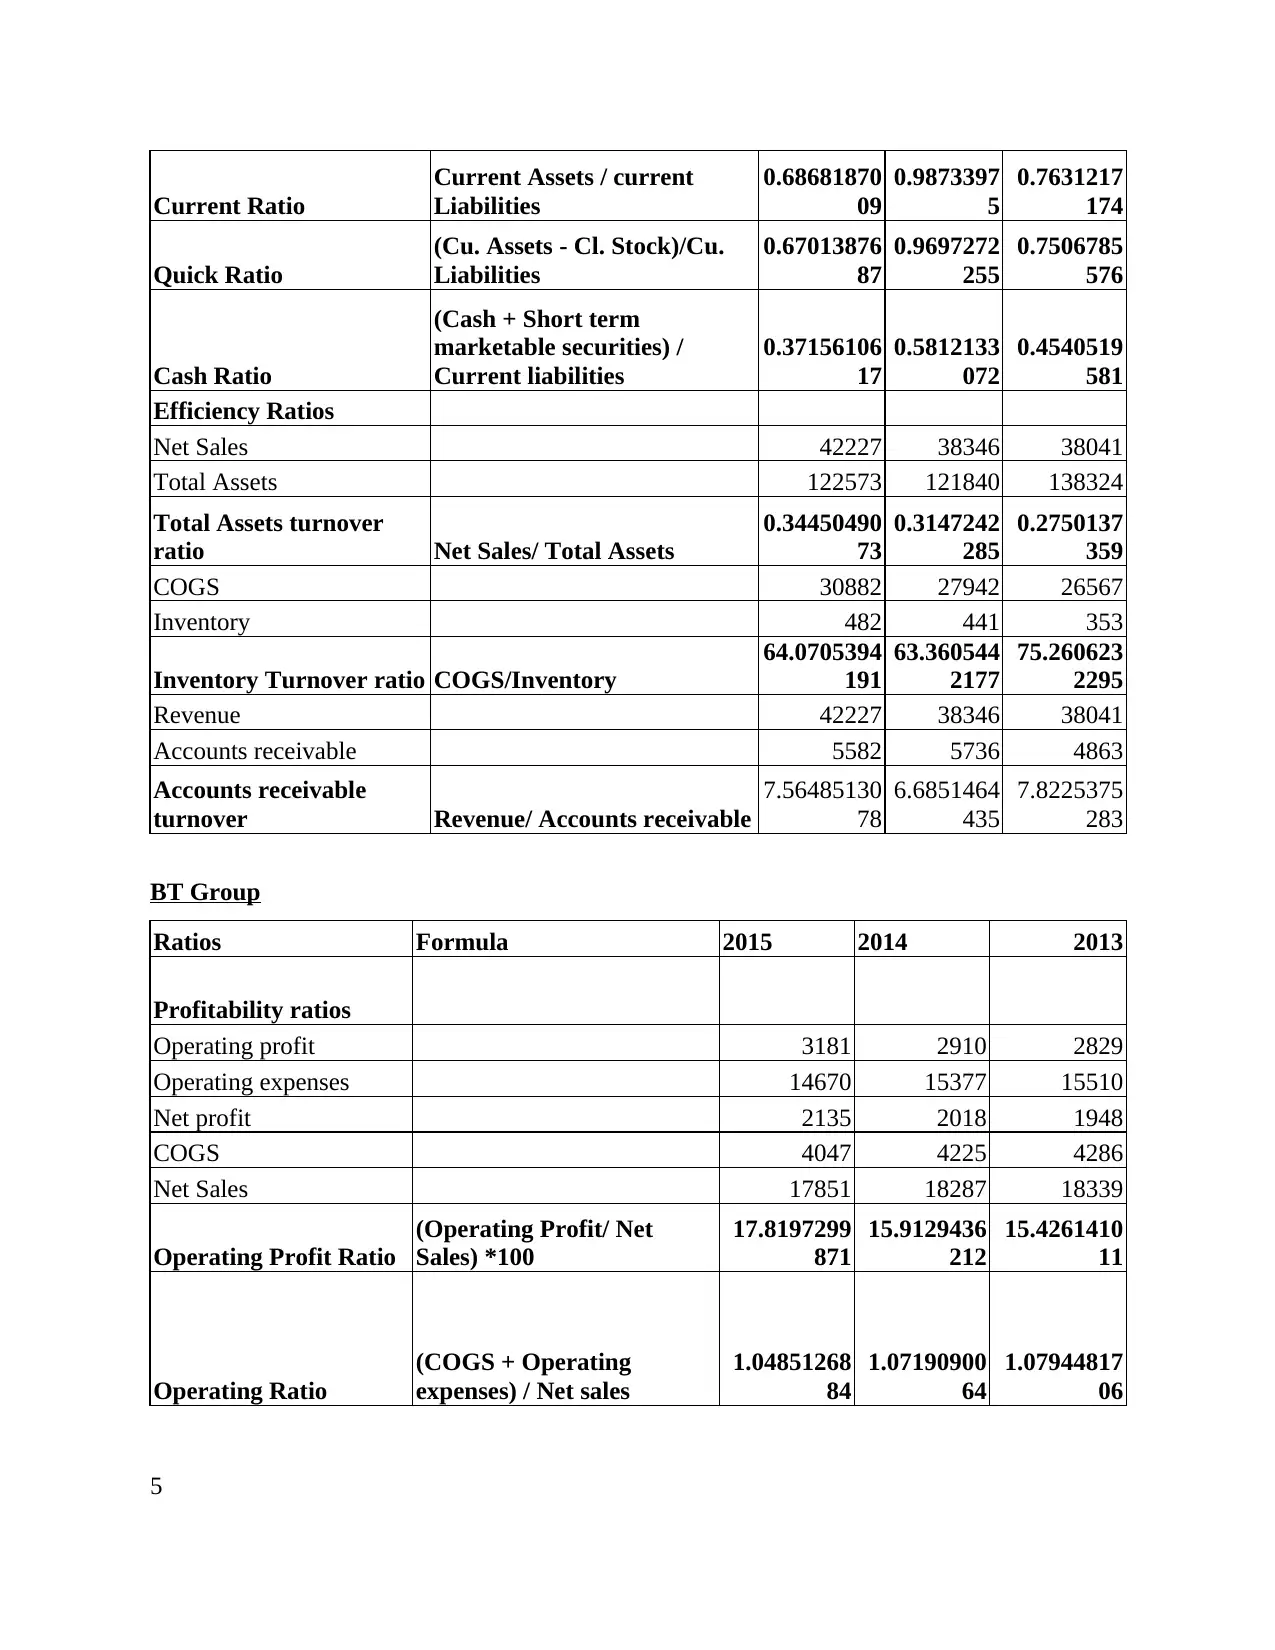
Current Ratio
Current Assets / current
Liabilities
0.68681870
09
0.9873397
5
0.7631217
174
Quick Ratio
(Cu. Assets - Cl. Stock)/Cu.
Liabilities
0.67013876
87
0.9697272
255
0.7506785
576
Cash Ratio
(Cash + Short term
marketable securities) /
Current liabilities
0.37156106
17
0.5812133
072
0.4540519
581
Efficiency Ratios
Net Sales 42227 38346 38041
Total Assets 122573 121840 138324
Total Assets turnover
ratio Net Sales/ Total Assets
0.34450490
73
0.3147242
285
0.2750137
359
COGS 30882 27942 26567
Inventory 482 441 353
Inventory Turnover ratio COGS/Inventory
64.0705394
191
63.360544
2177
75.260623
2295
Revenue 42227 38346 38041
Accounts receivable 5582 5736 4863
Accounts receivable
turnover Revenue/ Accounts receivable
7.56485130
78
6.6851464
435
7.8225375
283
BT Group
Ratios Formula 2015 2014 2013
Profitability ratios
Operating profit 3181 2910 2829
Operating expenses 14670 15377 15510
Net profit 2135 2018 1948
COGS 4047 4225 4286
Net Sales 17851 18287 18339
Operating Profit Ratio
(Operating Profit/ Net
Sales) *100
17.8197299
871
15.9129436
212
15.4261410
11
Operating Ratio
(COGS + Operating
expenses) / Net sales
1.04851268
84
1.07190900
64
1.07944817
06
5
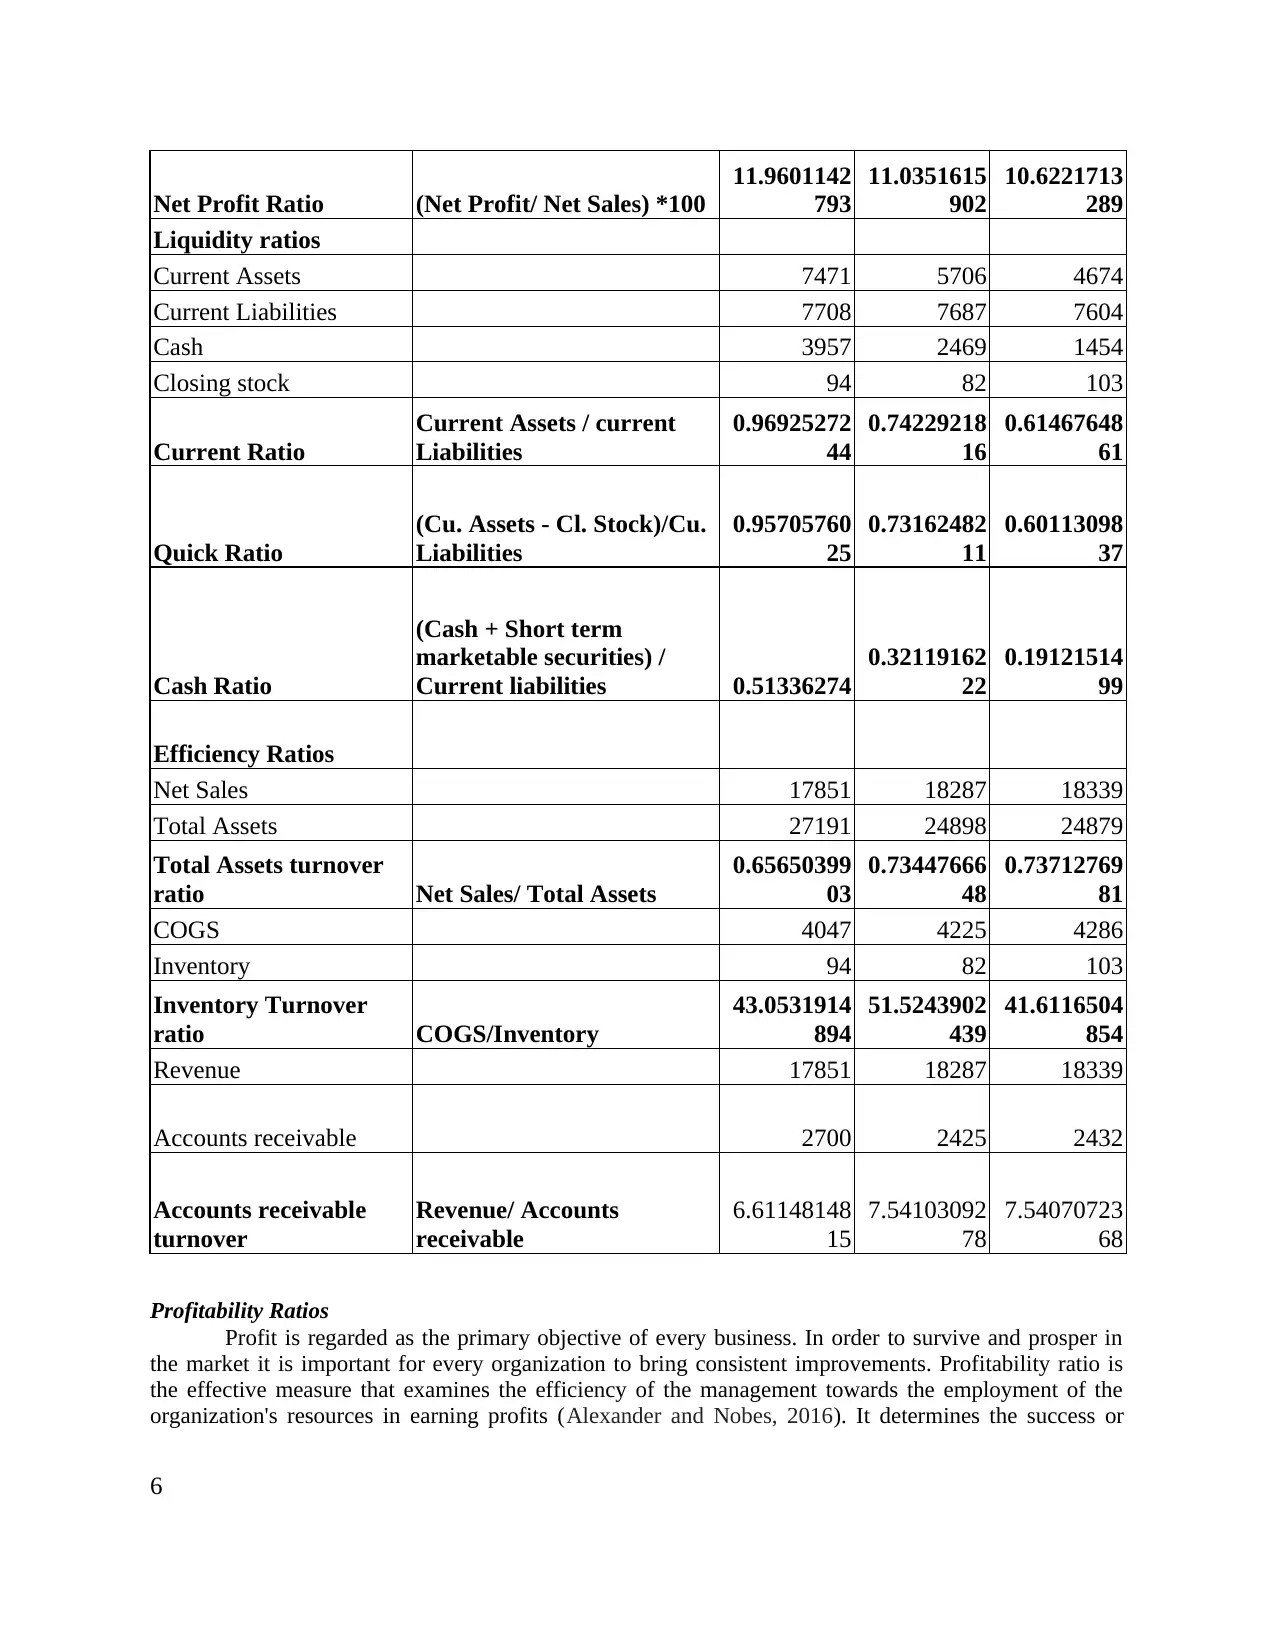
Net Profit Ratio (Net Profit/ Net Sales) *100
11.9601142
793
11.0351615
902
10.6221713
289
Liquidity ratios
Current Assets 7471 5706 4674
Current Liabilities 7708 7687 7604
Cash 3957 2469 1454
Closing stock 94 82 103
Current Ratio
Current Assets / current
Liabilities
0.96925272
44
0.74229218
16
0.61467648
61
Quick Ratio
(Cu. Assets - Cl. Stock)/Cu.
Liabilities
0.95705760
25
0.73162482
11
0.60113098
37
Cash Ratio
(Cash + Short term
marketable securities) /
Current liabilities 0.51336274
0.32119162
22
0.19121514
99
Efficiency Ratios
Net Sales 17851 18287 18339
Total Assets 27191 24898 24879
Total Assets turnover
ratio Net Sales/ Total Assets
0.65650399
03
0.73447666
48
0.73712769
81
COGS 4047 4225 4286
Inventory 94 82 103
Inventory Turnover
ratio COGS/Inventory
43.0531914
894
51.5243902
439
41.6116504
854
Revenue 17851 18287 18339
Accounts receivable 2700 2425 2432
Accounts receivable
turnover
Revenue/ Accounts
receivable
6.61148148
15
7.54103092
78
7.54070723
68
Profitability Ratios
Profit is regarded as the primary objective of every business. In order to survive and prosper in
the market it is important for every organization to bring consistent improvements. Profitability ratio is
the effective measure that examines the efficiency of the management towards the employment of the
organization's resources in earning profits (Alexander and Nobes, 2016). It determines the success or
6
⊘ This is a preview!⊘
Do you want full access?
Subscribe today to unlock all pages.
Trusted by 1+ million students worldwide
failure of concern for specific duration of time. The profitability ratio have been enumerated in the
manner stated as under:
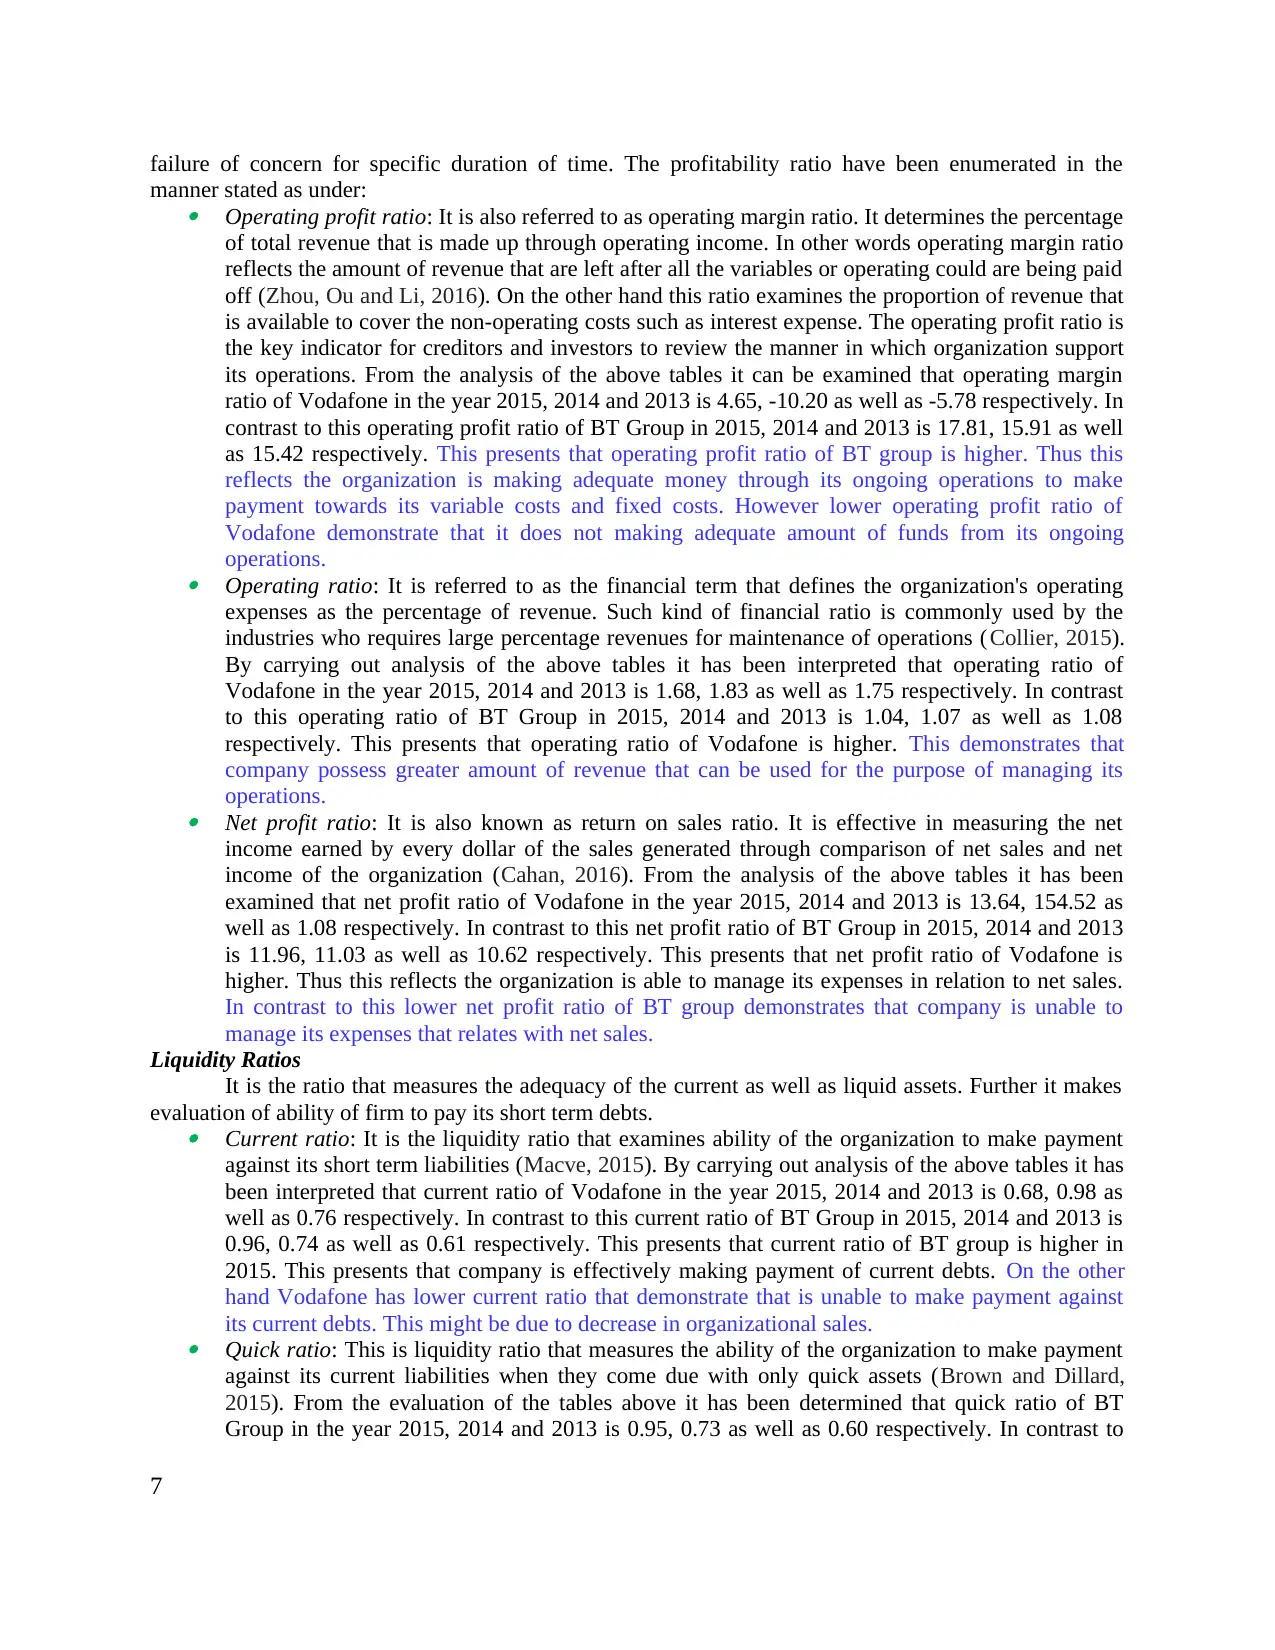
Operating profit ratio: It is also referred to as operating margin ratio. It determines the percentage
of total revenue that is made up through operating income. In other words operating margin ratio
reflects the amount of revenue that are left after all the variables or operating could are being paid
off (Zhou, Ou and Li, 2016). On the other hand this ratio examines the proportion of revenue that
is available to cover the non-operating costs such as interest expense. The operating profit ratio is
the key indicator for creditors and investors to review the manner in which organization support
its operations. From the analysis of the above tables it can be examined that operating margin
ratio of Vodafone in the year 2015, 2014 and 2013 is 4.65, -10.20 as well as -5.78 respectively. In
contrast to this operating profit ratio of BT Group in 2015, 2014 and 2013 is 17.81, 15.91 as well
as 15.42 respectively. This presents that operating profit ratio of BT group is higher. Thus this
reflects the organization is making adequate money through its ongoing operations to make
payment towards its variable costs and fixed costs. However lower operating profit ratio of
Vodafone demonstrate that it does not making adequate amount of funds from its ongoing
operations.
Operating ratio: It is referred to as the financial term that defines the organization's operating
expenses as the percentage of revenue. Such kind of financial ratio is commonly used by the
industries who requires large percentage revenues for maintenance of operations ( Collier, 2015).
By carrying out analysis of the above tables it has been interpreted that operating ratio of
Vodafone in the year 2015, 2014 and 2013 is 1.68, 1.83 as well as 1.75 respectively. In contrast
to this operating ratio of BT Group in 2015, 2014 and 2013 is 1.04, 1.07 as well as 1.08
respectively. This presents that operating ratio of Vodafone is higher. This demonstrates that
company possess greater amount of revenue that can be used for the purpose of managing its
operations.
Net profit ratio: It is also known as return on sales ratio. It is effective in measuring the net
income earned by every dollar of the sales generated through comparison of net sales and net
income of the organization (Cahan, 2016). From the analysis of the above tables it has been
examined that net profit ratio of Vodafone in the year 2015, 2014 and 2013 is 13.64, 154.52 as
well as 1.08 respectively. In contrast to this net profit ratio of BT Group in 2015, 2014 and 2013
is 11.96, 11.03 as well as 10.62 respectively. This presents that net profit ratio of Vodafone is
higher. Thus this reflects the organization is able to manage its expenses in relation to net sales.
In contrast to this lower net profit ratio of BT group demonstrates that company is unable to
manage its expenses that relates with net sales.
Liquidity Ratios
It is the ratio that measures the adequacy of the current as well as liquid assets. Further it makes
evaluation of ability of firm to pay its short term debts.
Current ratio: It is the liquidity ratio that examines ability of the organization to make payment
against its short term liabilities (Macve, 2015). By carrying out analysis of the above tables it has
been interpreted that current ratio of Vodafone in the year 2015, 2014 and 2013 is 0.68, 0.98 as
well as 0.76 respectively. In contrast to this current ratio of BT Group in 2015, 2014 and 2013 is
0.96, 0.74 as well as 0.61 respectively. This presents that current ratio of BT group is higher in
2015. This presents that company is effectively making payment of current debts. On the other
hand Vodafone has lower current ratio that demonstrate that is unable to make payment against
its current debts. This might be due to decrease in organizational sales.
Quick ratio: This is liquidity ratio that measures the ability of the organization to make payment
against its current liabilities when they come due with only quick assets (Brown and Dillard,
2015). From the evaluation of the tables above it has been determined that quick ratio of BT
Group in the year 2015, 2014 and 2013 is 0.95, 0.73 as well as 0.60 respectively. In contrast to
7
manner stated as under:
Operating profit ratio: It is also referred to as operating margin ratio. It determines the percentage
of total revenue that is made up through operating income. In other words operating margin ratio
reflects the amount of revenue that are left after all the variables or operating could are being paid
off (Zhou, Ou and Li, 2016). On the other hand this ratio examines the proportion of revenue that
is available to cover the non-operating costs such as interest expense. The operating profit ratio is
the key indicator for creditors and investors to review the manner in which organization support
its operations. From the analysis of the above tables it can be examined that operating margin
ratio of Vodafone in the year 2015, 2014 and 2013 is 4.65, -10.20 as well as -5.78 respectively. In
contrast to this operating profit ratio of BT Group in 2015, 2014 and 2013 is 17.81, 15.91 as well
as 15.42 respectively. This presents that operating profit ratio of BT group is higher. Thus this
reflects the organization is making adequate money through its ongoing operations to make
payment towards its variable costs and fixed costs. However lower operating profit ratio of
Vodafone demonstrate that it does not making adequate amount of funds from its ongoing
operations.
Operating ratio: It is referred to as the financial term that defines the organization's operating
expenses as the percentage of revenue. Such kind of financial ratio is commonly used by the
industries who requires large percentage revenues for maintenance of operations ( Collier, 2015).
By carrying out analysis of the above tables it has been interpreted that operating ratio of
Vodafone in the year 2015, 2014 and 2013 is 1.68, 1.83 as well as 1.75 respectively. In contrast
to this operating ratio of BT Group in 2015, 2014 and 2013 is 1.04, 1.07 as well as 1.08
respectively. This presents that operating ratio of Vodafone is higher. This demonstrates that
company possess greater amount of revenue that can be used for the purpose of managing its
operations.
Net profit ratio: It is also known as return on sales ratio. It is effective in measuring the net
income earned by every dollar of the sales generated through comparison of net sales and net
income of the organization (Cahan, 2016). From the analysis of the above tables it has been
examined that net profit ratio of Vodafone in the year 2015, 2014 and 2013 is 13.64, 154.52 as
well as 1.08 respectively. In contrast to this net profit ratio of BT Group in 2015, 2014 and 2013
is 11.96, 11.03 as well as 10.62 respectively. This presents that net profit ratio of Vodafone is
higher. Thus this reflects the organization is able to manage its expenses in relation to net sales.
In contrast to this lower net profit ratio of BT group demonstrates that company is unable to
manage its expenses that relates with net sales.
Liquidity Ratios
It is the ratio that measures the adequacy of the current as well as liquid assets. Further it makes
evaluation of ability of firm to pay its short term debts.
Current ratio: It is the liquidity ratio that examines ability of the organization to make payment
against its short term liabilities (Macve, 2015). By carrying out analysis of the above tables it has
been interpreted that current ratio of Vodafone in the year 2015, 2014 and 2013 is 0.68, 0.98 as
well as 0.76 respectively. In contrast to this current ratio of BT Group in 2015, 2014 and 2013 is
0.96, 0.74 as well as 0.61 respectively. This presents that current ratio of BT group is higher in
2015. This presents that company is effectively making payment of current debts. On the other
hand Vodafone has lower current ratio that demonstrate that is unable to make payment against
its current debts. This might be due to decrease in organizational sales.
Quick ratio: This is liquidity ratio that measures the ability of the organization to make payment
against its current liabilities when they come due with only quick assets (Brown and Dillard,
2015). From the evaluation of the tables above it has been determined that quick ratio of BT
Group in the year 2015, 2014 and 2013 is 0.95, 0.73 as well as 0.60 respectively. In contrast to
7
Paraphrase This Document
Need a fresh take? Get an instant paraphrase of this document with our AI Paraphraser
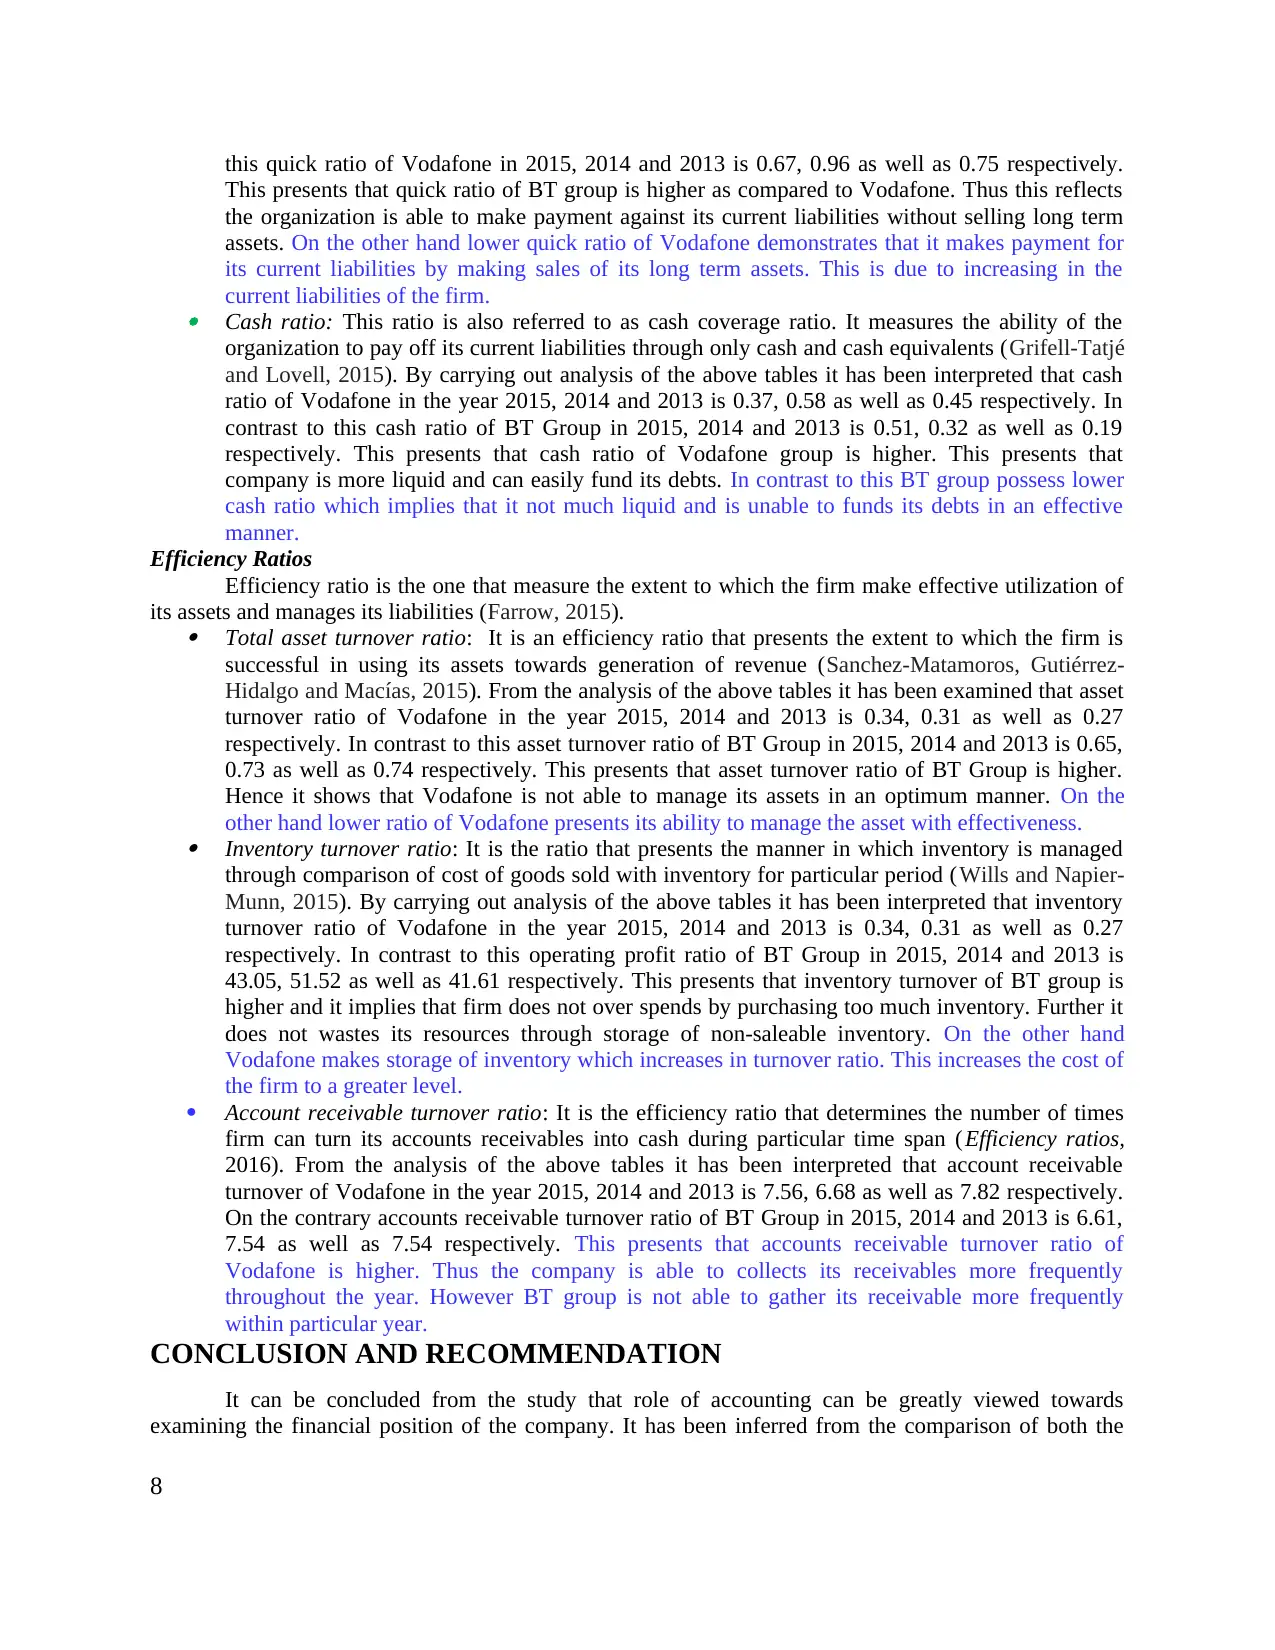
this quick ratio of Vodafone in 2015, 2014 and 2013 is 0.67, 0.96 as well as 0.75 respectively.
This presents that quick ratio of BT group is higher as compared to Vodafone. Thus this reflects
the organization is able to make payment against its current liabilities without selling long term
assets. On the other hand lower quick ratio of Vodafone demonstrates that it makes payment for
its current liabilities by making sales of its long term assets. This is due to increasing in the
current liabilities of the firm.
Cash ratio: This ratio is also referred to as cash coverage ratio. It measures the ability of the
organization to pay off its current liabilities through only cash and cash equivalents (Grifell-Tatjé
and Lovell, 2015). By carrying out analysis of the above tables it has been interpreted that cash
ratio of Vodafone in the year 2015, 2014 and 2013 is 0.37, 0.58 as well as 0.45 respectively. In
contrast to this cash ratio of BT Group in 2015, 2014 and 2013 is 0.51, 0.32 as well as 0.19
respectively. This presents that cash ratio of Vodafone group is higher. This presents that
company is more liquid and can easily fund its debts. In contrast to this BT group possess lower
cash ratio which implies that it not much liquid and is unable to funds its debts in an effective
manner.
Efficiency Ratios
Efficiency ratio is the one that measure the extent to which the firm make effective utilization of
its assets and manages its liabilities (Farrow, 2015).
Total asset turnover ratio: It is an efficiency ratio that presents the extent to which the firm is
successful in using its assets towards generation of revenue (Sanchez-Matamoros, Gutiérrez-
Hidalgo and Macías, 2015). From the analysis of the above tables it has been examined that asset
turnover ratio of Vodafone in the year 2015, 2014 and 2013 is 0.34, 0.31 as well as 0.27
respectively. In contrast to this asset turnover ratio of BT Group in 2015, 2014 and 2013 is 0.65,
0.73 as well as 0.74 respectively. This presents that asset turnover ratio of BT Group is higher.
Hence it shows that Vodafone is not able to manage its assets in an optimum manner. On the
other hand lower ratio of Vodafone presents its ability to manage the asset with effectiveness.
Inventory turnover ratio: It is the ratio that presents the manner in which inventory is managed
through comparison of cost of goods sold with inventory for particular period (Wills and Napier-
Munn, 2015). By carrying out analysis of the above tables it has been interpreted that inventory
turnover ratio of Vodafone in the year 2015, 2014 and 2013 is 0.34, 0.31 as well as 0.27
respectively. In contrast to this operating profit ratio of BT Group in 2015, 2014 and 2013 is
43.05, 51.52 as well as 41.61 respectively. This presents that inventory turnover of BT group is
higher and it implies that firm does not over spends by purchasing too much inventory. Further it
does not wastes its resources through storage of non-saleable inventory. On the other hand
Vodafone makes storage of inventory which increases in turnover ratio. This increases the cost of
the firm to a greater level.
Account receivable turnover ratio: It is the efficiency ratio that determines the number of times
firm can turn its accounts receivables into cash during particular time span ( Efficiency ratios,
2016). From the analysis of the above tables it has been interpreted that account receivable
turnover of Vodafone in the year 2015, 2014 and 2013 is 7.56, 6.68 as well as 7.82 respectively.
On the contrary accounts receivable turnover ratio of BT Group in 2015, 2014 and 2013 is 6.61,
7.54 as well as 7.54 respectively. This presents that accounts receivable turnover ratio of
Vodafone is higher. Thus the company is able to collects its receivables more frequently
throughout the year. However BT group is not able to gather its receivable more frequently
within particular year.
CONCLUSION AND RECOMMENDATION
It can be concluded from the study that role of accounting can be greatly viewed towards
examining the financial position of the company. It has been inferred from the comparison of both the
8
telecommunication companies that position of Vodafone is much sound in comparison with BT group.
Along with this, ratio analysis provides that financial health of Vodafone is good. This presents that firm
has kept control over its expenses and is able to make payment against its debts in an effective manner. It
can also be concluded from the present report that liquidity position of BT group is more stable which
implies that firm is capable of to paying its short term obligations.
It is recommended to BT group to enhance its control over the expenses so that it can increase its
profitability to a greater extent. Along with this efficiency of the firm can be increased when it effectively
makes utilization of its assets for the purpose of attaining its pre-determined targets (Hilmola and Gupta,
2015).
9
⊘ This is a preview!⊘
Do you want full access?
Subscribe today to unlock all pages.
Trusted by 1+ million students worldwide
REFERENCES
Journals and Books
Alexander, D. and Nobes, C., 2016. Financial Accounting 6th Edition. Pearson Higher Ed.
Brown, J. and Dillard, J., 2015. Opening Accounting to Critical Scrutiny: Towards Dialogic
Accounting for Policy Analysis and Democracy. Journal of Comparative Policy Analysis:
Research and Practice. 17(3). pp.247-268.
Cahan, S., 2016. Consequences of IFRS for capital markets, managers, auditors and standard‐
setters: an introduction. Accounting & Finance. 56(1). pp.5-8.
Collier, P. M., 2015. Accounting for managers: Interpreting accounting information for decision
making. John Wiley & Sons.
Farrow, S., 2015. Residual Risk Accounting: A Pilot Study. Review of Income and Wealth.
Grifell-Tatjé, E. and Lovell, C. K., 2015. Productivity Accounting. Cambridge University Press.
Groom, E., Rapti, R. S. and Pardina, M. R., 2016. Accounting for infrastructure regulation: an
introduction.
Heintz, J. and Parry, R., 2016. College Accounting Chapters 1-27. Cengage Learning.
Hilmola, O. P. and Gupta, M., 2015. Throughput accounting and performance of a
manufacturing company under stochastic demand and scrap rates.Expert Systems with
Applications. 42(22). pp.8423-8431.
Li, X., 2015. Accounting conservatism and the cost of capital: An international analysis. Journal
of Business Finance & Accounting. 42(5-6). pp.555-582.
Macve, R., 2015. A Conceptual Framework for Financial Accounting and Reporting: Vision,
Tool, Or Threat?. Routledge.
Sanchez-Matamoros, J. B., Gutiérrez-Hidalgo, F. and Macías, M., 2015. Innovation in
accounting thought and practice–an introduction. Accounting History. 20(3). pp.247-249.
Scott, P., 2016. Accounting for Business. Oxford University Press.
Taylor, S. J., Bogdan, R. and DeVault, M., 2015. Introduction to qualitative research methods:
A guidebook and resource. John Wiley & Sons.
Wills, B. A. and Napier-Munn, T., 2015. Wills' mineral processing technology: an introduction
to the practical aspects of ore treatment and mineral recovery. Butterworth-Heinemann.
10
Paraphrase This Document
Need a fresh take? Get an instant paraphrase of this document with our AI Paraphraser
Zhou, Z., Ou, J. and Li, S., 2016. Ecological Accounting: A Research Review and Conceptual
Framework. Journal of Environmental Protection. 7(05). p.643.
Online
BT Group. 2016. [Online]. Available through:
<http://markets.ft.com/research/Markets/Tearsheets/Financials?
s=BT.A:LSE&subview=BalanceSheet>. [Accessed on 18th April 2016].
Efficiency ratios. 2016. [Online]. Available through:
<http://news.morningstar.com/classroom2/course.asp?docId=145093&page=3>. [Accessed on
18th April 2016].
Vodafone Group PLC. 2016. [Online]. Available through:
<http://markets.ft.com/research/Markets/Tearsheets/Financials?
s=VOD:LSE&subview=BalanceSheet>. [Accessed on 18th April 2016].
11
1 out of 11
Related Documents


Your All-in-One AI-Powered Toolkit for Academic Success.
+13062052269
info@desklib.com
Available 24*7 on WhatsApp / Email
![[object Object]](/_next/static/media/star-bottom.7253800d.svg)
Unlock your academic potential
Copyright © 2020–2026 A2Z Services. All Rights Reserved. Developed and managed by ZUCOL.