Solutions to Problems: Advance Financial Accounting - Inventory Ratios

Verified

Added on  2023/04/23

|9
|1958
|415
Homework Assignment
AI Summary
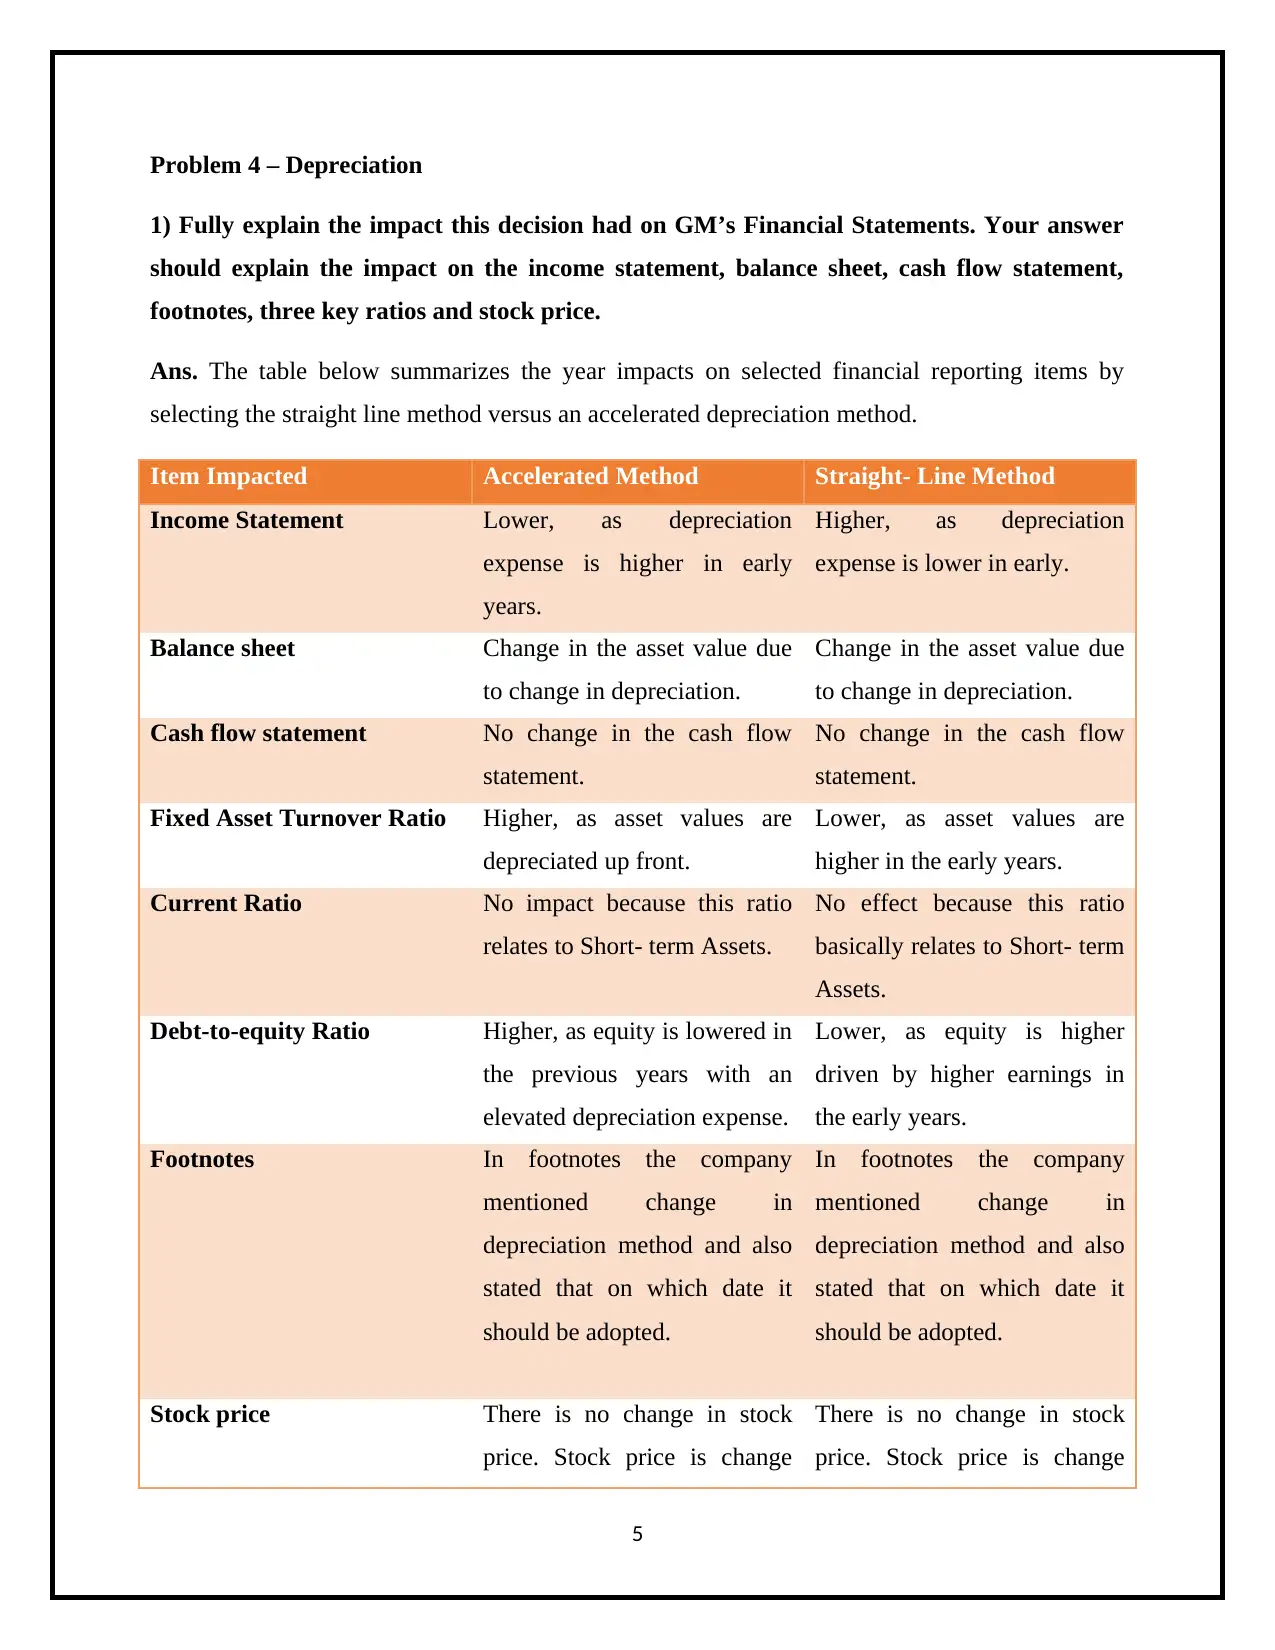
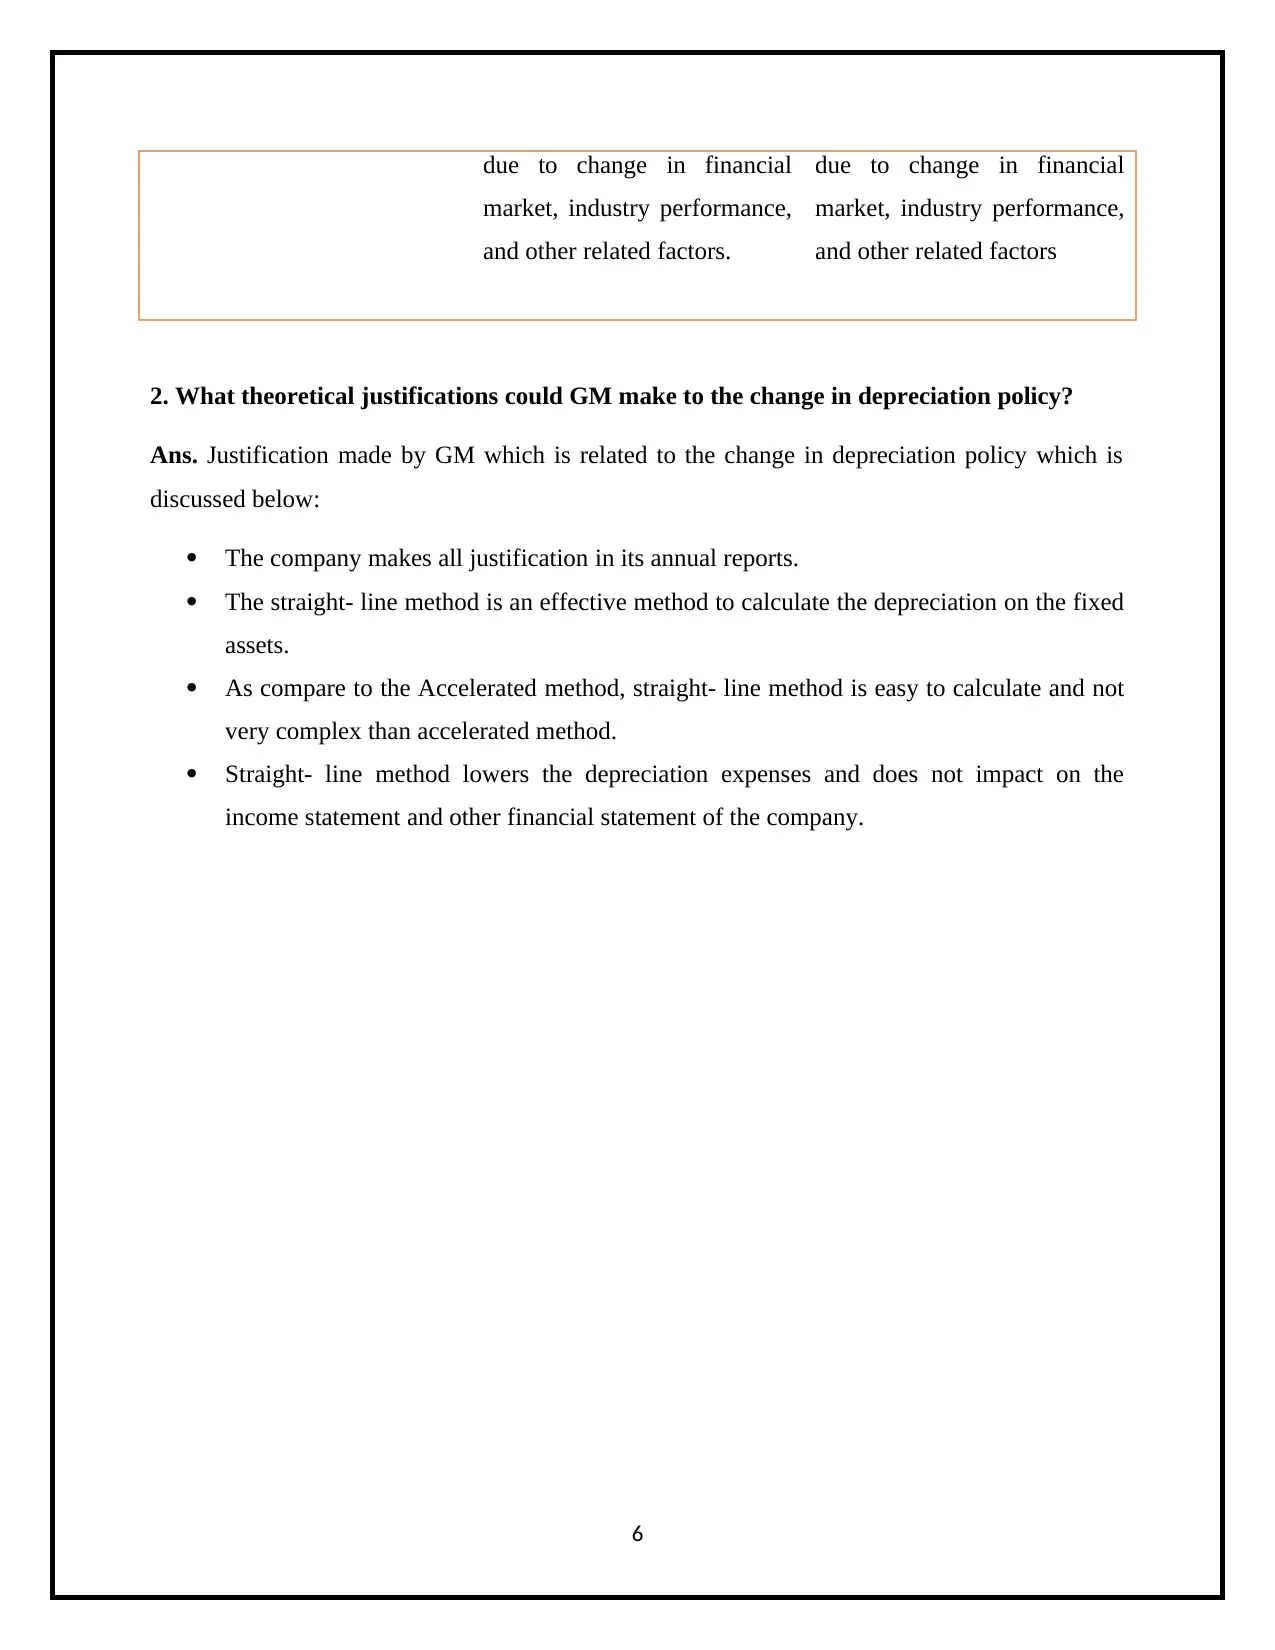
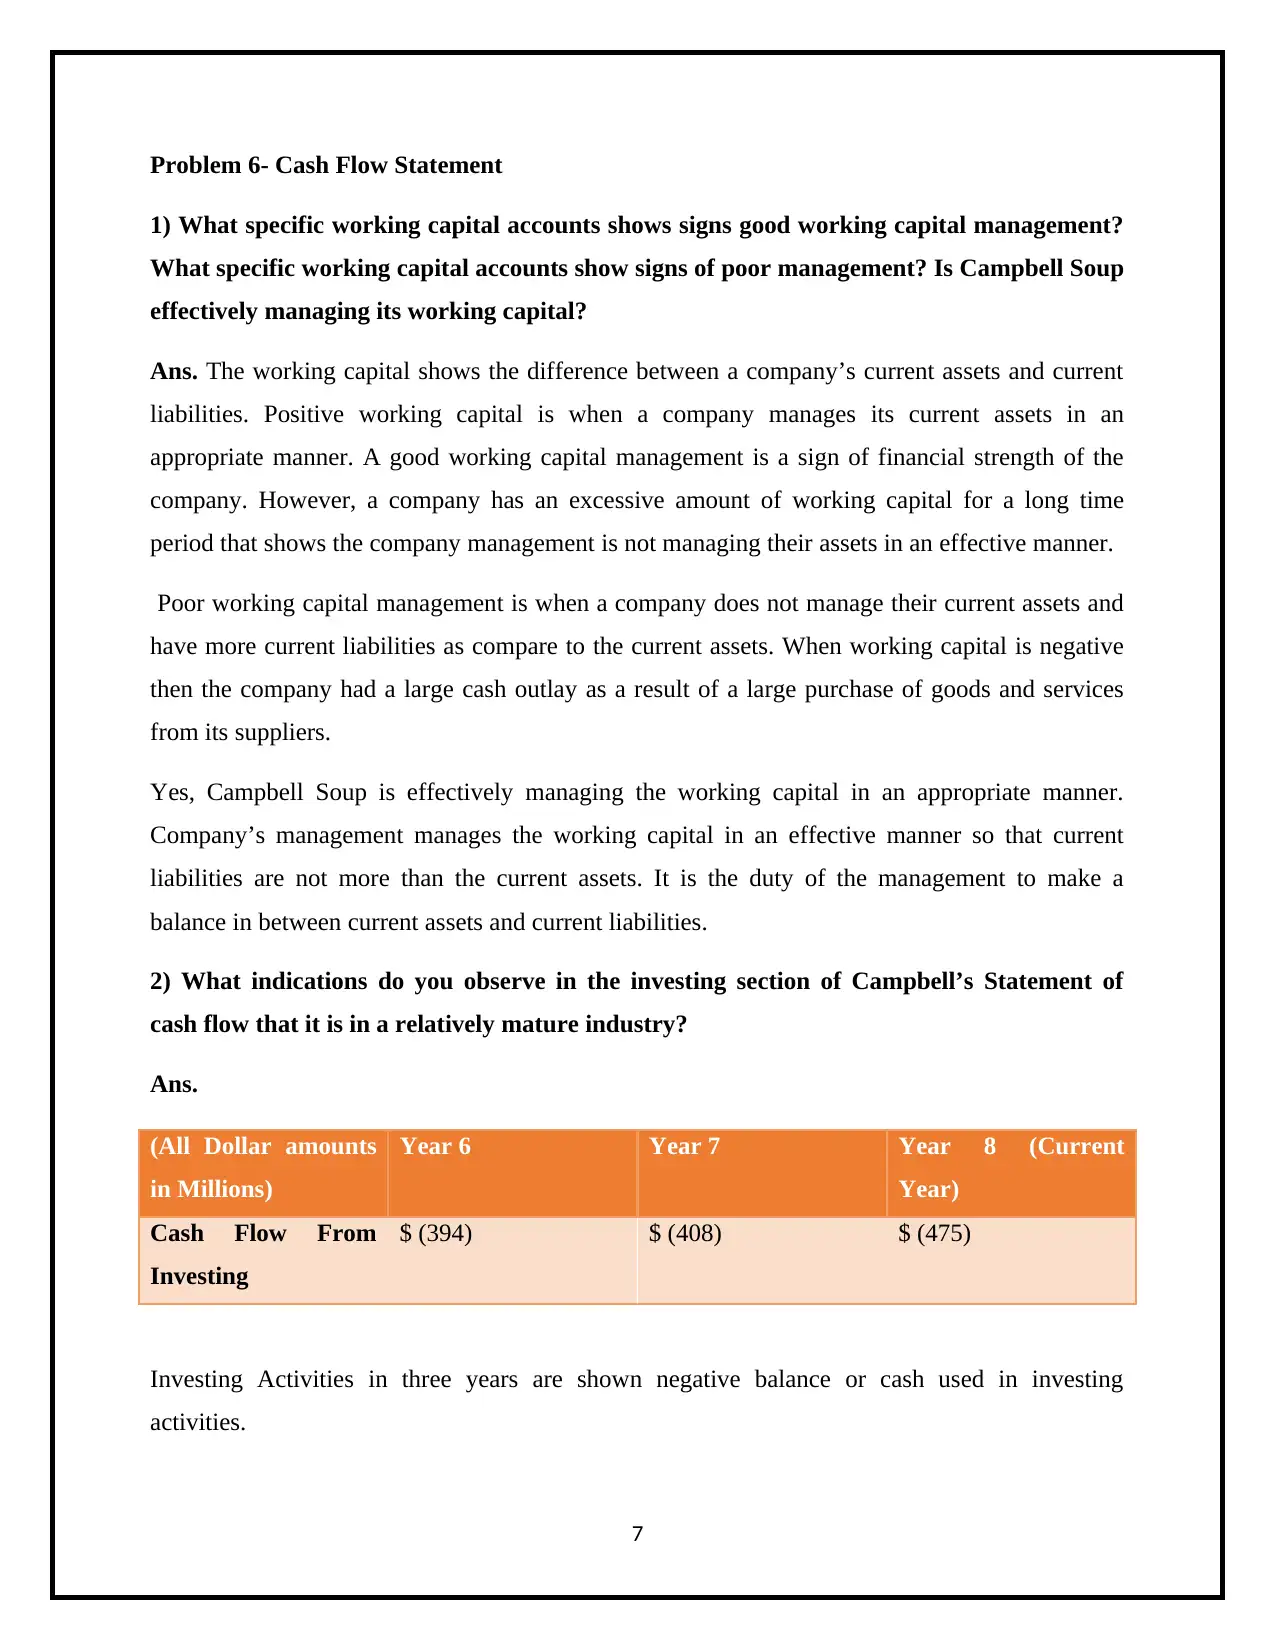
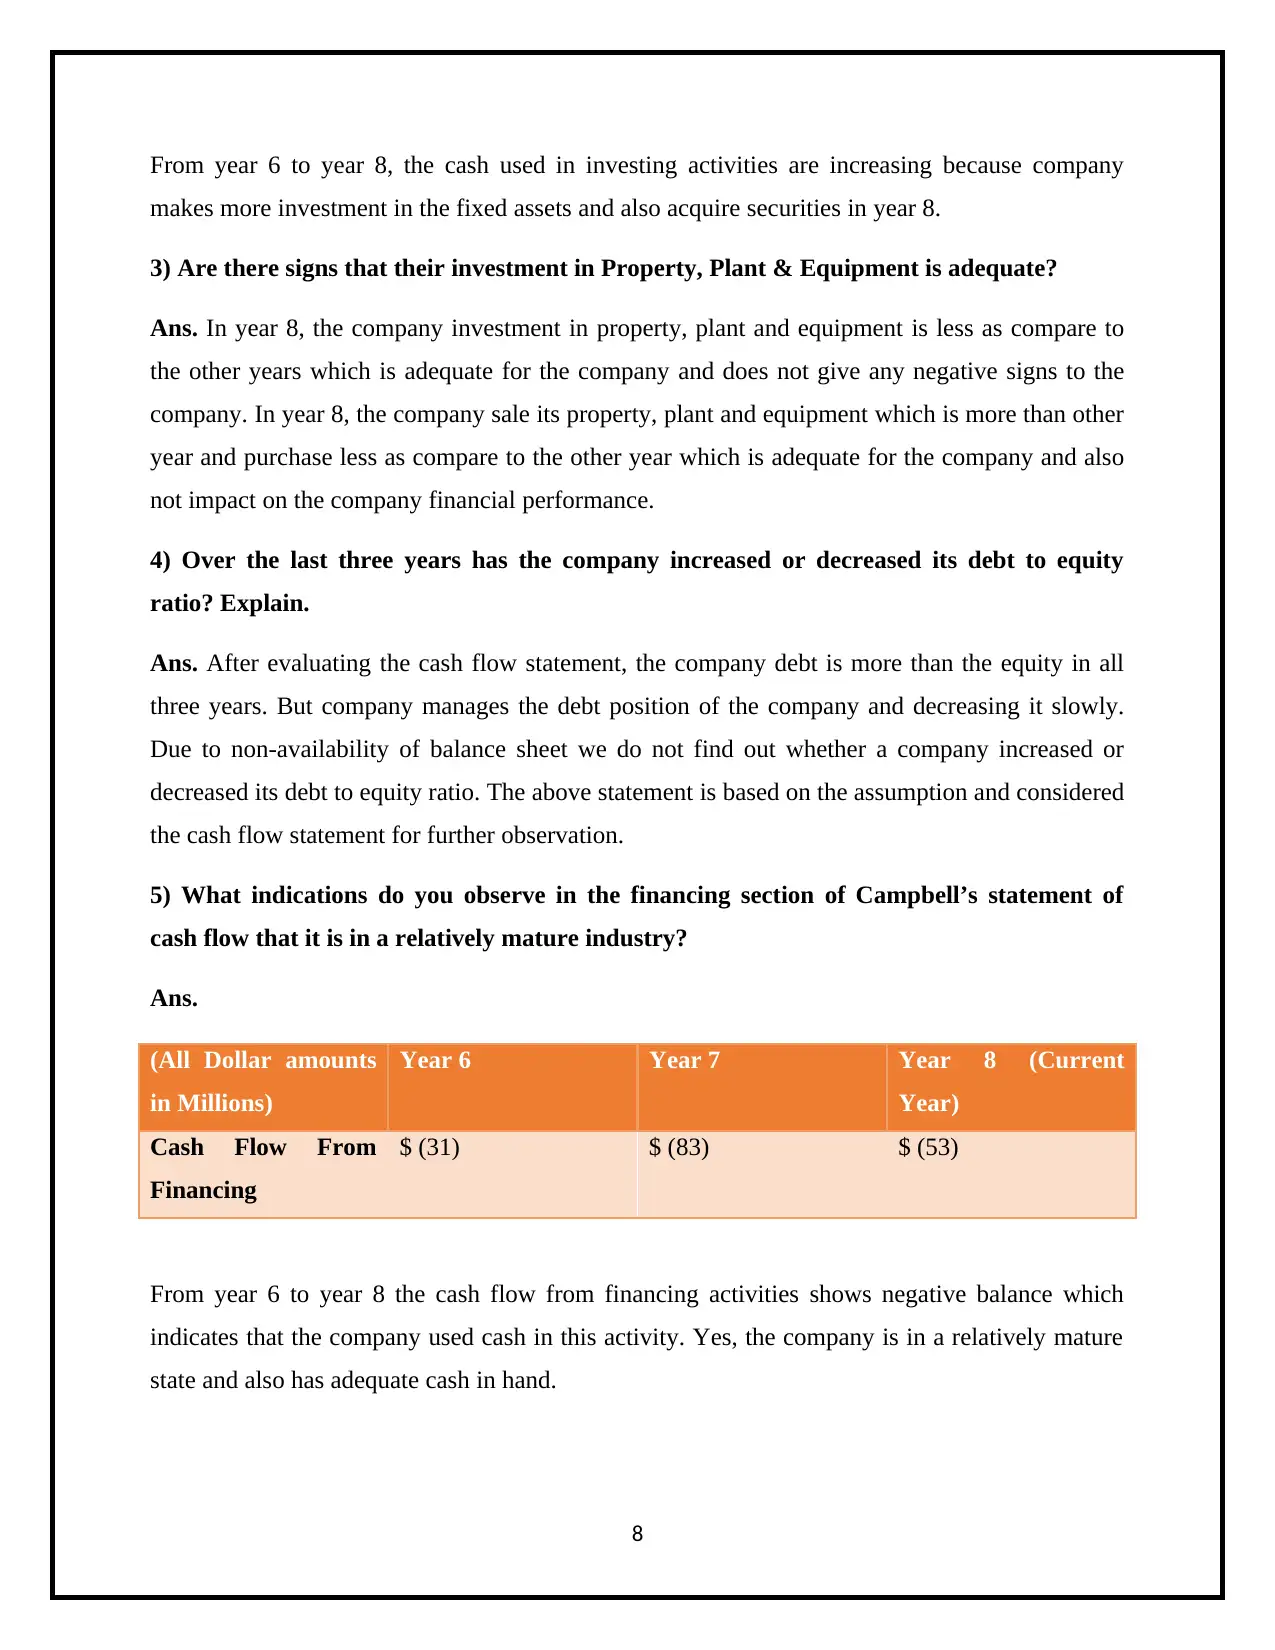
This assignment provides solutions to several problems in advanced financial accounting. The first problem compares the impact of LIFO and FIFO inventory costing methods on key financial ratios. The second problem analyzes HP's accounts receivable, including the allowance for doubtful accounts and bad debt expense, across multiple years. The fourth problem discusses the impact of changing depreciation methods on GM's financial statements and the justifications for such a change. Finally, the sixth problem examines Campbell Soup's cash flow statement, focusing on working capital management, investment activities, and financing activities, to assess the company's financial health and maturity. Desklib is a platform where students can find similar solved assignments and past papers.
Document Page
Advance Financial Accounting
1
tabler-icon-diamond-filled.svg

Secure Best Marks with AI Grader

Need help grading? Try our AI Grader for instant feedback on your assignments.
Document Page
Problem 1- Depreciation/Inventory/Ratios
Ratios Gamma Company (LIFO) Zeta Company (FIFO)
A. Acid- test ratio No impact on this ratio. No impact on this ratio
because inventory is not used
to calculate.
B. Current ratio Usually lower in rising price
because it is reported
inventories which are based on
lower cost purchases and
higher cost of goods sold.
Usually higher in a rising
price environment because
reported inventories are more
valuable and cost of goods
sold is lower.
C. Accounts Receivable
Turnover ratio
In this ratio lower in rising
price.
Higher in rising price.
D. Inventory Turnover ratio The inventory ratio will be
higher when LIFO is used
during periods of increasing
costs.
The inventory ratio will be
lower when FIFO method is
used because the cost of goods
sold will be higher and the
inventory costs will be lower
under LIFO than under FIFO.
E. Asset Turnover ratio Higher in a rising price. Lower in a rising price.
F. Debt ratio Generally lower in rising price
because net income is lower.
Generally higher in a rising
price because net income is
higher.
2
Document Page
Problem 2 – Accounts Receivable
a. What is the gross amount of accounts receivables for HP in fiscal 2015 and 2014? That is,
what is the maximum they could collect if every customer paid in full?
Ans. Gross Amount of Accounts Receivables = Net Amount of Accounts Receivables +
Allowance for Doubtful accounts
For HP in fiscal year 2015 = $8538 + $109 = $8647 (in millions)
For HP in fiscal year 2014 = $8423 + $126 = $8549 (in millions)
The maximum in 2015 the company collect $8647 from every customer in full.
b. What is the percentage of the allowance for doubtful accounts to gross accounts
receivable for 2015 and 2014? Why is this a valuable percentage to calculate? What can it
tell you? What is the impact on the financial statements if it is too low?
Ans. Percentage of the allowance for doubtful accounts to gross accounts receivable
In 2015 (%) = 109/8647*100 = 1.26%
In 2014 (%) = 126/8549*100 = 1.47%
This valuable percentage is to be calculate to find out how much percentage of the allowance for
doubtful accounts to gross accounts receivable of the company in a particular fiscal year. At the
end of fiscal year, companies estimate the amount of uncollectible accounts.
Company management uses a great deal of judgment and discretion to determine the allowance
for doubtful accounts. It tells the company’s management a percentage increased or decreased in
allowance for doubtful accounts by doing a proper comparison in between past and current
financial year.
This percentage has positive or negative impact on the company’s financial statement. If the
percentage is low as compare to other financial year then it shows the allowance for doubtful
debts is decreasing as compare to the year and customer paid timely to the company.
In the above calculation it is decreasing. In 2014 the percentage was 1.47% and in 2015 it was
decreasing by 1.26%. that is good for company.
3
Document Page
c. What amount of bad debts expense did HP report each year 2013 through 2015? How
does bad debts expense compare with the amounts of its accounts receivable actually
written off?
Ans.
(in millions) 2015 2014 2013
Bad debt expense 27 50 43
Amounts actually
written off
(44) (74) (157)
Basically, HP has underestimated its accruals, which has inflated profit by the under-accrual of
bad- debts.
d. How does the allowance for doubtful accounts change from 2013 through 2015? What
are some possible explanations for this change? Does it appear that HP increased or
decreased its allowance for doubtful accounts in any particular year beyond what seems
reasonable?
Ans.
The allowance for doubtful accounts change from 2013 through 2015
(in millions) 2015 2014 2013
Balance at end of
year
$109 $126` $150
The above table shows that the allowance for doubtful accounts decreasing from 2013 to 2015.
The reason behind for this change is that the company’s management changes its credit policy
and customer also paid to the company on a time to make good relations. However, changes in
the allowance for doubtful accounts can be an indicator of other trends within a company.
In 2015, allowance for doubtful accounts is decreasing and it is reasonable for the company.
4
tabler-icon-diamond-filled.svg

Secure Best Marks with AI Grader

Need help grading? Try our AI Grader for instant feedback on your assignments.
Document Page
Problem 4 – Depreciation
1) Fully explain the impact this decision had on GM’s Financial Statements. Your answer
should explain the impact on the income statement, balance sheet, cash flow statement,
footnotes, three key ratios and stock price.
Ans. The table below summarizes the year impacts on selected financial reporting items by
selecting the straight line method versus an accelerated depreciation method.
Item Impacted Accelerated Method Straight- Line Method
Income Statement Lower, as depreciation
expense is higher in early
years.
Higher, as depreciation
expense is lower in early.
Balance sheet Change in the asset value due
to change in depreciation.
Change in the asset value due
to change in depreciation.
Cash flow statement No change in the cash flow
statement.
No change in the cash flow
statement.
Fixed Asset Turnover Ratio Higher, as asset values are
depreciated up front.
Lower, as asset values are
higher in the early years.
Current Ratio No impact because this ratio
relates to Short- term Assets.
No effect because this ratio
basically relates to Short- term
Assets.
Debt-to-equity Ratio Higher, as equity is lowered in
the previous years with an
elevated depreciation expense.
Lower, as equity is higher
driven by higher earnings in
the early years.
Footnotes In footnotes the company
mentioned change in
depreciation method and also
stated that on which date it
should be adopted.
In footnotes the company
mentioned change in
depreciation method and also
stated that on which date it
should be adopted.
Stock price There is no change in stock
price. Stock price is change
There is no change in stock
price. Stock price is change
5
Document Page
due to change in financial
market, industry performance,
and other related factors.
due to change in financial
market, industry performance,
and other related factors
2. What theoretical justifications could GM make to the change in depreciation policy?
Ans. Justification made by GM which is related to the change in depreciation policy which is
discussed below:
The company makes all justification in its annual reports.
The straight- line method is an effective method to calculate the depreciation on the fixed
assets.
As compare to the Accelerated method, straight- line method is easy to calculate and not
very complex than accelerated method.
Straight- line method lowers the depreciation expenses and does not impact on the
income statement and other financial statement of the company.
6
Document Page
Problem 6- Cash Flow Statement
1) What specific working capital accounts shows signs good working capital management?
What specific working capital accounts show signs of poor management? Is Campbell Soup
effectively managing its working capital?
Ans. The working capital shows the difference between a company’s current assets and current
liabilities. Positive working capital is when a company manages its current assets in an
appropriate manner. A good working capital management is a sign of financial strength of the
company. However, a company has an excessive amount of working capital for a long time
period that shows the company management is not managing their assets in an effective manner.
Poor working capital management is when a company does not manage their current assets and
have more current liabilities as compare to the current assets. When working capital is negative
then the company had a large cash outlay as a result of a large purchase of goods and services
from its suppliers.
Yes, Campbell Soup is effectively managing the working capital in an appropriate manner.
Company’s management manages the working capital in an effective manner so that current
liabilities are not more than the current assets. It is the duty of the management to make a
balance in between current assets and current liabilities.
2) What indications do you observe in the investing section of Campbell’s Statement of
cash flow that it is in a relatively mature industry?
Ans.
(All Dollar amounts
in Millions)
Year 6 Year 7 Year 8 (Current
Year)
Cash Flow From
Investing
$ (394) $ (408) $ (475)
Investing Activities in three years are shown negative balance or cash used in investing
activities.
7
tabler-icon-diamond-filled.svg

Paraphrase This Document

Need a fresh take? Get an instant paraphrase of this document with our AI Paraphraser
Document Page
From year 6 to year 8, the cash used in investing activities are increasing because company
makes more investment in the fixed assets and also acquire securities in year 8.
3) Are there signs that their investment in Property, Plant & Equipment is adequate?
Ans. In year 8, the company investment in property, plant and equipment is less as compare to
the other years which is adequate for the company and does not give any negative signs to the
company. In year 8, the company sale its property, plant and equipment which is more than other
year and purchase less as compare to the other year which is adequate for the company and also
not impact on the company financial performance.
4) Over the last three years has the company increased or decreased its debt to equity
ratio? Explain.
Ans. After evaluating the cash flow statement, the company debt is more than the equity in all
three years. But company manages the debt position of the company and decreasing it slowly.
Due to non-availability of balance sheet we do not find out whether a company increased or
decreased its debt to equity ratio. The above statement is based on the assumption and considered
the cash flow statement for further observation.
5) What indications do you observe in the financing section of Campbell’s statement of
cash flow that it is in a relatively mature industry?
Ans.
(All Dollar amounts
in Millions)
Year 6 Year 7 Year 8 (Current
Year)
Cash Flow From
Financing
$ (31) $ (83) $ (53)
From year 6 to year 8 the cash flow from financing activities shows negative balance which
indicates that the company used cash in this activity. Yes, the company is in a relatively mature
state and also has adequate cash in hand.
8
Document Page
6) What has happened to Campbell’s dividend per share from year 6 to year 8?
Ans. From year 6 to year 8, the dividend paid by the company has been increased and dividend
per share is also increased.
9
chevron_up_icon
1 out of 9
circle_padding
hide_on_mobile
zoom_out_icon
logo.png

Your All-in-One AI-Powered Toolkit for Academic Success.

Available 24*7 on WhatsApp / Email

[object Object]