ACCT1009 Financial Reporting Analysis: RFG vs FFGL Investment Report
VerifiedAdded on 2023/06/03
|9
|1867
|291
Report
AI Summary
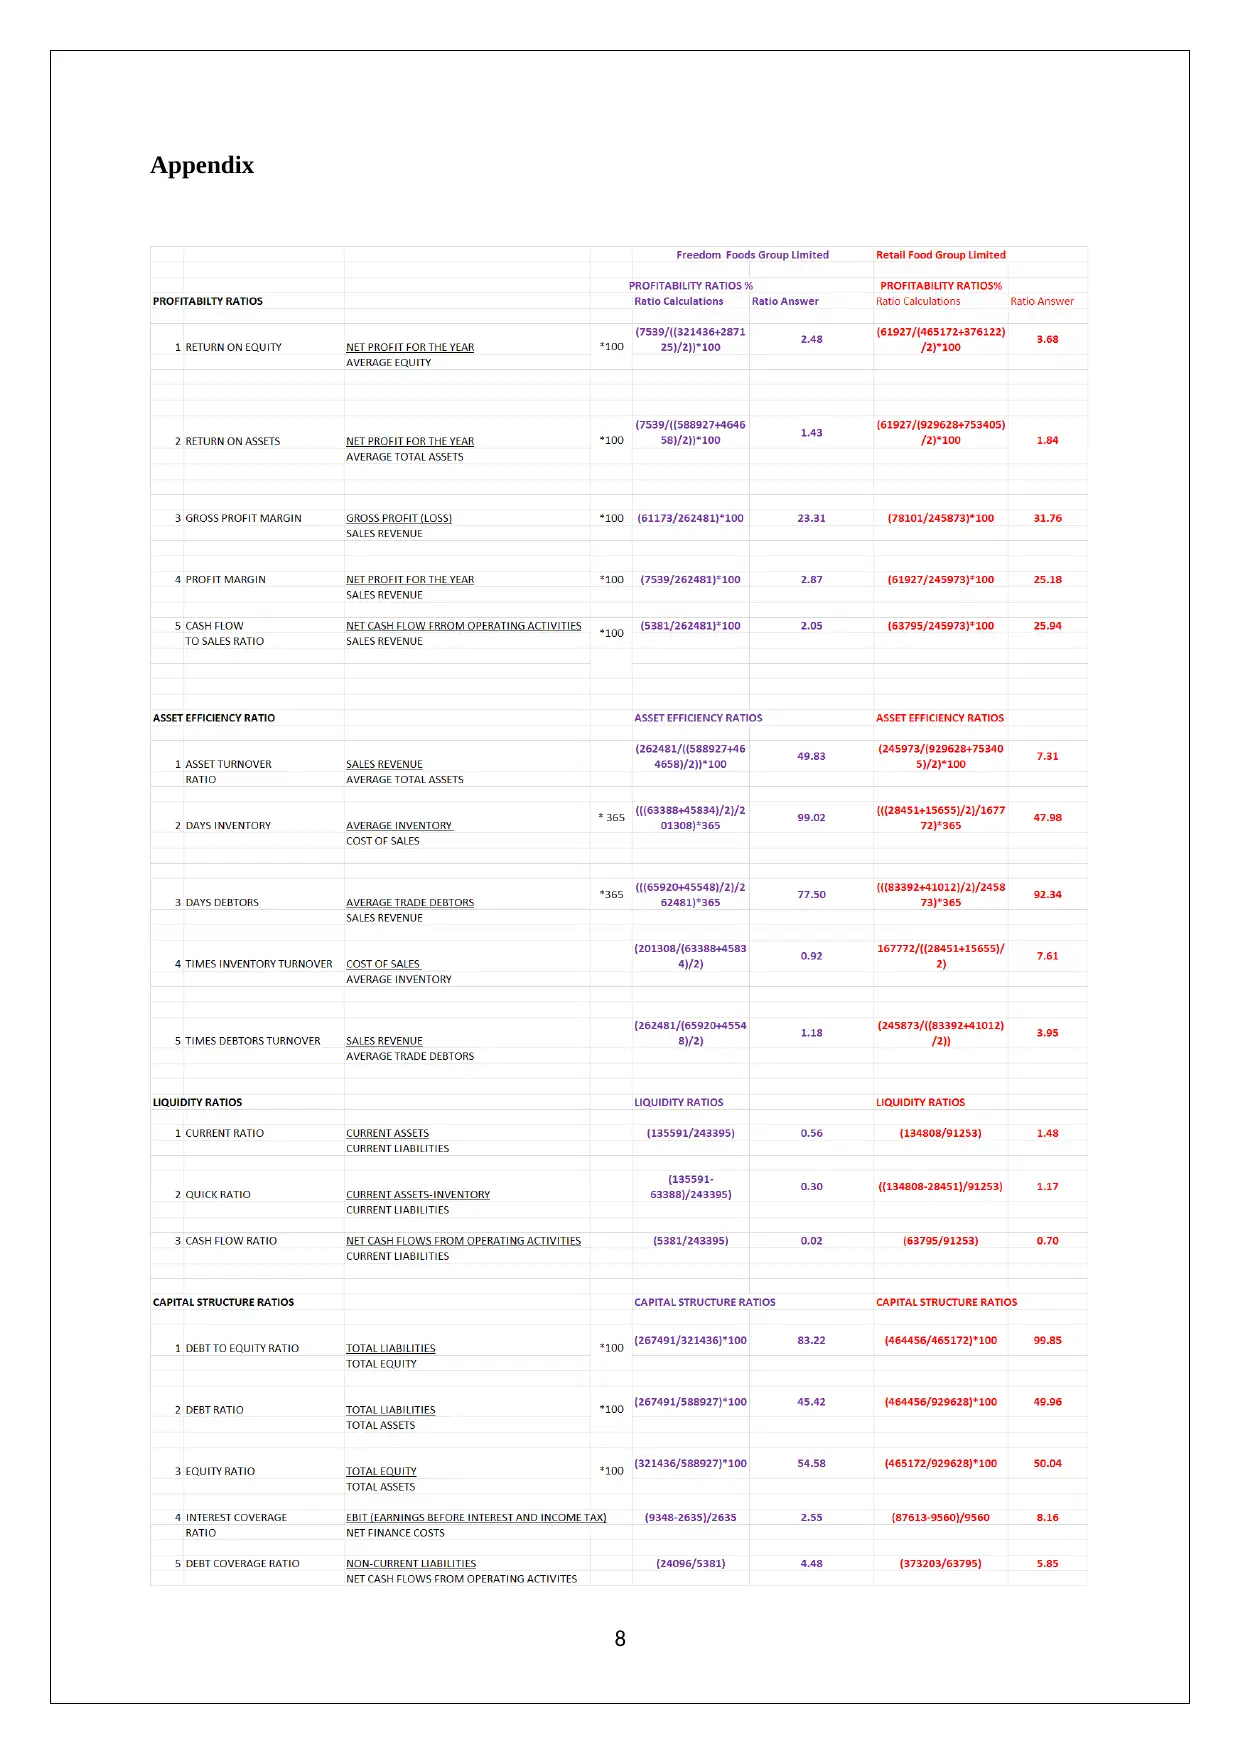
This report provides a comparative financial analysis of Retail Food Group (RFG) and Freedom Foods Group Limited (FFGL) based on their FY2017 annual reports, aiming to determine the superior investment option. The analysis employs trend analysis and ratio analysis, evaluating profitability, asset efficiency, liquidity, and capital structure. The report highlights RFG's stronger performance across most key financial ratios, particularly in profitability and liquidity. However, the analysis acknowledges limitations, such as the reliance on past data and the exclusion of social and environmental factors, which are also key considerations. The report concludes that while RFG appears to be the better investment based on financial metrics, a comprehensive investment decision should also consider non-financial aspects and the limitations of ratio analysis.

ACCOUNTING PRINCIPLES FOR BUSINESS DECISION
INVESTMENT REPORT
STUDENT ID:
[Pick the date]
INVESTMENT REPORT
STUDENT ID:
[Pick the date]
Paraphrase This Document
Need a fresh take? Get an instant paraphrase of this document with our AI Paraphraser

Executive Summary
The given report conducts trend analysis and ratio analysis for two companies namely RFG
and FFGL which both belong to the same sector with the objective of choosing the better
company from the investment perspective. Based on financial performance and stability
parameters based on FY2017, RFG has emerged as the better option. However, the analysis
fails to consider the social and environmental aspects of the activities of the two companies
besides ignoring the limitations of ratio analysis which essentially relies on past data. As a
result, social and environmental performance also needs to be included in this analysis.
1

Table of Contents
Executive Summary...................................................................................................................1
Table of Contents.......................................................................................................................2
Introduction................................................................................................................................2
Financial ratio analysis and interpretation.................................................................................3
Superior Investment Bet.............................................................................................................4
Limitations of financial ratio analysis and non-financial information of an entity....................5
Conclusion..................................................................................................................................6
Reference List............................................................................................................................6
Appendix....................................................................................................................................7
2
⊘ This is a preview!⊘
Do you want full access?
Subscribe today to unlock all pages.

Trusted by 1+ million students worldwide

Introduction
In order to make an investment choice, often the financial performance and stability are
compared. In this backdrop, the objective of this report is to draw a comparison of the
financial performance of two companies i.e. Retail Food Group (RFG) and Freedom Foods
Group Limited (FFGL) considering FY2017 annual report. The key tools used for financial
analysis are trend analysis and ratio analysis. However, the shortcomings of relying only on
financial performance have also been indicated in reference to focus on the social and
environmental performance of the two companies.
Financial ratio analysis and interpretation
The objective of the given task is to carry out a comparison of the ratio analysis of the two
companies based on the financial statements highlighted in FY2017 annual report.
a) Profitability Comparison
With regards to profitability returns and ratios, RFG is the superior choice as compared to
FFGL. This is because for each of the five profit ratios RFG has a superior value. One of the
key reasons for the same is on account of franchisee fee contributing a significant chunk of
the revenue for RFG. Considering that this is fee based income, the underlying cost for the
same is quite less and hence a boost to the profit margins is provided (RFG, 2017). On the
other hand, FFGL does not have any significant franchise based fee and hence the profits
earned on account of the food products that are manufactured and marketing. It is noteworthy
that the above is only one of the reasons since RFG has a higher gross margin when
compared to FFGL which may be the result of difference in product mix since the former is
in QSR and fast foods segment while the latter is in health and wellness products (EEGL,
2017).
b) Asset Efficiency Comparison
With regards to asset efficiency, RFG is the superior choice as compared to FFGL. This is
captured in all the ratios except one i.e. asset turnover. The asset turnover is higher for FFGL
since for RFG the business model is more asset intensive since there is requirement of
company owned stores. Also, for RFG, the franchise fee related income is not included in the
revenue which also subdues the same. With regards to inventory turnover and debtors
turnover, a higher ratio is exhibited by RFG which indicates the ability of the company to
3
Paraphrase This Document
Need a fresh take? Get an instant paraphrase of this document with our AI Paraphraser

turn inventory into sale faster and also recover the business receivables (Parrino and Kidwell,
2014). This also may be attributed to the nature of business of RFG since inventory is readily
converted into sales and also the franchisees do not need to stock inventory. This is unlike the
case in FFGL where the cash cycle is longer because of the longer time to convert inventory
into sales and higher credit period to sales partners (Damodarsn, 2015).
c) Liquidity Comparison
With regards to liquidity ratios, RFG is the superior choice as compared to FFGL. This is
because for each of the three liquidity ratios RFG has a superior value. Liquidity ratios tend
to act as indicators of the short term liquidity and potential cash crunch in the near term
(Brealey, Myers and Allen, 2014). For FFGL, it is apparent that the liquidity ratios are quite
unhealthy. This is apparent from the fact that current ratio is only 0.56 which represents that
only 56% of the current liabilities are covered by corresponding current assets. For RFG, the
corresponding ratio is 1.48. If the quick ratio is considered, then the situation for FFGL is
even more dismal as the ratio drops to 0.30 which indicates high presence of inventory in the
current assets. The corresponding value for RFG is 1.17. The cash ratio is even dismal for
FFGL at 0.02 which presents that cash on the books as on June 30, 2017 is just 2% of the
outstanding current liabilities. Going forward, it may be possible that FFGL may face some
liquidity crisis (Damodaran, 2015).
d) Capital Structure Comparison
With regards to capital structure, the results are mixed with some of the ratios being superior
for RFG while the other superior for FFGL. With regards to interest coverage and debt
coverage ratio, the superior value tends to exist for RFG considering the fact that EBIT and
operating cash flows are significantly higher for RFG aided by the income from the
franchisees. However, with regards to other ratios such as debt equity ratio, debt ratio and
equity ratio, FFGL has superior performance in comparison with RFG. This to an extent may
be related to more asset intensive model of RFG owing to ownership of certain company
stores which is not the case for FFGL. However, the capital structure ratios do not indicate
any issues going forward for RFG as the ratios are quite healthy. FFGL needs to improve the
profits so as to better serve the debt related obligations (Parrino and Kidwell, 2014).
4

Superior Investment Bet
The above financial analysis was conducted with the objective of identifying the better
company for investment on the basis of financial performance and stability. The key
takeaway from the ratio interpretation and comparison is that RFG has the upper hand in
majority of the key financial ratios. Further, even in certain ratios that FFGL does have
superiority, the lower numbers for RFG does not pose any concern from an investment
perspective. Further, considering the inferior liquidity ratios of FFGL as on June 30, 2017,
there does arise valid concerns related to short term liquidity crunch which may be faced by
the company because of facing issues regarding serving short term liabilities. Also, owing to
the issues regarding lower profits being generated in FY2017, FFGL also has potential issues
going forward in relation with servicing the debt owing to low interest coverage and debt
coverage ratios (Damodaran, 2015).
On the other hand, RFG offers a very stable bet which tends to have superior profitability
margins along with comfort with regards to liquidity and solvency. As a result, based on the
financial statements, there does not seem that any short term or long term concerns are posed
for RFG. Also, the asset efficiency ratios tends to be superior for RFG owing to which there
is a shorter cash cycle and hence the working capital usage would be lower, leading to higher
profitability (Brealey, Myers and Allen, 2014).
Limitations of financial ratio analysis and non-financial information of an entity
The above decision to invest in RFG is based solely on the financial statement analysis which
has certain shortcomings. One of the shortcomings is that the past performance may not be a
reliable indicator of future performance of the company and hence it would not be wise to
extrapolate the past performance into the future. Also, in the given case, the analysis has been
conducted for only one year and based on that the conclusion is being derived (Damodaran,
2015). The year FY2017 was particularly bad for FFGL and hence relying on comparison of
just one year is clearly not correct. Additionally, it is imperative to consider the difference in
business models of the two companies even if they belong to the same sector as the ratio
differences at time is attributed to this aspect which gets if focus is solely on financial
performance (Parrino and Kidwell, 2014).
Further, it is imperative to consider the social and environmental aspects of the activities. In
this regards, the underlying product offering does matter. RFG focuses on products which to
5
⊘ This is a preview!⊘
Do you want full access?
Subscribe today to unlock all pages.

Trusted by 1+ million students worldwide

an extent are related to the burgeoning social menace of obesity and can lead to lowering of
health outcomes in the long run. In contrast, the focus of FFGL is on wellness and health
products which are aimed at improving the health of the people and thereby have a positive
externality associated with the same. Also, consideration also needs to be given on the
underlying carbon footprint of the business activities of the two companies
Conclusion
Based on the above, it can be concluded that based on financial performance for FY2017,
RFG appears to the superior option from investment perspective and stability. However, a
key shortcoming is that the future performance of the respective companies might not be the
same as past performance. Also, the above analysis tends to ignore the social and
environment aspects related to the two companies which is pivotal. In this regards, the social
impact of RFG products is inferior in comparison to that of FFGL which is significant.
Similarly, the environmental performance also needs to be considered.
6
Paraphrase This Document
Need a fresh take? Get an instant paraphrase of this document with our AI Paraphraser

Reference List
Brealey, R. A., Myers, S. C. and Allen, F. (2014) Principles of corporate finance, 6th ed. New
York: McGraw-Hill Publications
Damodaran, A. (2015). Applied corporate finance: A user’s manual 3rd ed. New York: Wiley,
John & Sons.
FFGL (2017) Annual Report FY2017, {online] Available at
http://ffgl.com.au/wp-content/uploads/2017/10/Annual-Report-2017.pdf [Assessed October
07, 2018]
Parrino, R. and Kidwell, D. (2014) Fundamentals of Corporate Finance, 3rd ed. London:
Wiley Publications
RFG (2017) Annual Report FY2017, {online] Available at http://www.rfg.com.au/wp-
content/uploads/2018/02/RFGLAnnualReport2017.pdf [Assessed October 07, 2018]
7

Appendix
8
8
⊘ This is a preview!⊘
Do you want full access?
Subscribe today to unlock all pages.

Trusted by 1+ million students worldwide
1 out of 9
Related Documents
Your All-in-One AI-Powered Toolkit for Academic Success.
+13062052269
info@desklib.com
Available 24*7 on WhatsApp / Email
Unlock your academic potential
Copyright © 2020–2026 A2Z Services. All Rights Reserved. Developed and managed by ZUCOL.


