Detailed Financial Management Report: Med Advisor Company
VerifiedAdded on 2020/05/11
|20
|2742
|32
Report
AI Summary
This report provides a detailed financial analysis of Med Advisor, focusing on its financial management practices. The analysis begins with an examination of debt valuation, revealing that the company currently operates without any debt, which positively impacts its solvency and liquidity. The report then delves into share valuation, calculating the cost of equity using the Capital Asset Pricing Model (CAPM), and analyzes the company's reported earnings, noting a decline in revenue but an increase in service revenue. The report explores valuation methods, including the comparable approach and dividend growth model, concluding that the price-earnings (PE) ratio is most suitable for valuing the company. It also covers the calculation of the Weighted Average Cost of Capital (WACC), highlighting the significance of the cost of equity due to the absence of debt. The report further examines capital structure, market analysis, and provides a comparative analysis of Med Advisor's financial performance within its industry. The report also includes a literature search on the company and concludes with an assessment of the company's financial health, potential for growth, and investment risks.

Running head: ACCOUNTING
Accounting
Name of the Student:
Name of the University:
Authors Note:
Accounting
Name of the Student:
Name of the University:
Authors Note:
Paraphrase This Document
Need a fresh take? Get an instant paraphrase of this document with our AI Paraphraser
1
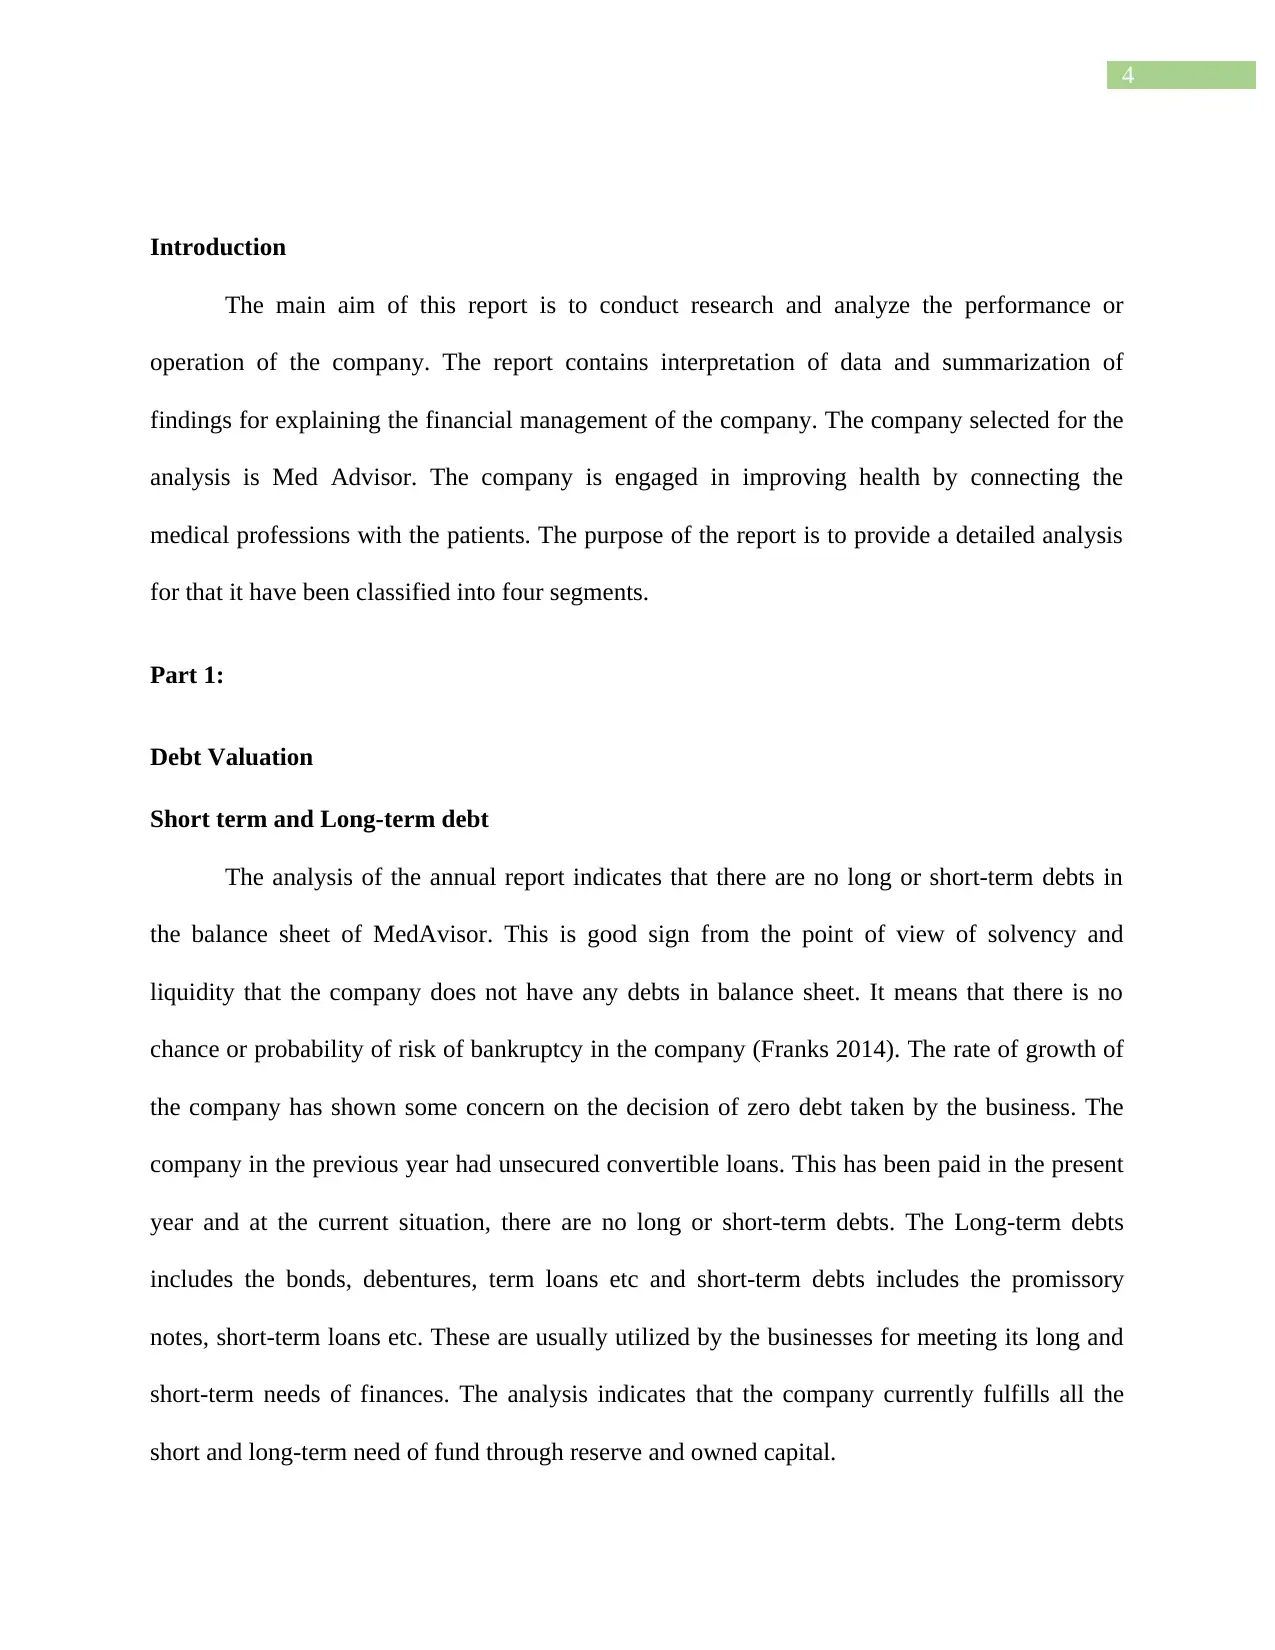
Executive Summary
The report discusses the financial management of the company Med Advisor. The report
indicates that the company does not have any debt. The cost of equity is the cost of capital of the
company. The cost of capital of the company is calculated using the capital assets pricing model.
The analysis further indicates the company is performing only relatively well than its major
competitors.
2
Table of Contents
Introduction......................................................................................................................................4
Part 1:...............................................................................................................................................4
Debt Valuation.................................................................................................................................4
Short term and Long-term debt....................................................................................................4
Comparing debt structure............................................................................................................5
Influence of industry in the debt of the company........................................................................5
Cost of debt..................................................................................................................................5
Share Valuation...............................................................................................................................5
Cost of Equity..............................................................................................................................5
Analysis of the companies reported earnings..............................................................................6
Valuation of companies stock using comparable approach.........................................................8
Reasonable Approach based on the current market price............................................................8
Additional data and information required to value Companies stock.........................................8
Cost of Capital.................................................................................................................................8
Calculation of Weighted Average Cost of capital (calculation)..................................................8
Company’s tax rate in the WACC calculation............................................................................8
Difference between Cost of debt and Cost of Equity..................................................................9
Current Liability in cost of capital calculation............................................................................9
⊘ This is a preview!⊘
Do you want full access?
Subscribe today to unlock all pages.
Trusted by 1+ million students worldwide
3
The major value in Med Advisor for WACC calculation is cost of equity, as there is no
existence of any amount of debt. The investors will consider the business as good enough for
creation of its decisions relating to investments..........................................................................9
Example of use of WACC in Investment decision-making.........................................................9
Capital Structure........................................................................................................................10
Optimum Capital Structure........................................................................................................10
Market Analysis.........................................................................................................................10
Comparative Analysis of financial performance of company and industry..............................10
Literature search on company....................................................................................................11
Other items that are relevant to the company............................................................................13
Conclusion.....................................................................................................................................13
Reference.......................................................................................................................................14
Paraphrase This Document
Need a fresh take? Get an instant paraphrase of this document with our AI Paraphraser
4
Introduction
The main aim of this report is to conduct research and analyze the performance or
operation of the company. The report contains interpretation of data and summarization of
findings for explaining the financial management of the company. The company selected for the
analysis is Med Advisor. The company is engaged in improving health by connecting the
medical professions with the patients. The purpose of the report is to provide a detailed analysis
for that it have been classified into four segments.
Part 1:
Debt Valuation
Short term and Long-term debt
The analysis of the annual report indicates that there are no long or short-term debts in
the balance sheet of MedAvisor. This is good sign from the point of view of solvency and
liquidity that the company does not have any debts in balance sheet. It means that there is no
chance or probability of risk of bankruptcy in the company (Franks 2014). The rate of growth of
the company has shown some concern on the decision of zero debt taken by the business. The
company in the previous year had unsecured convertible loans. This has been paid in the present
year and at the current situation, there are no long or short-term debts. The Long-term debts
includes the bonds, debentures, term loans etc and short-term debts includes the promissory
notes, short-term loans etc. These are usually utilized by the businesses for meeting its long and
short-term needs of finances. The analysis indicates that the company currently fulfills all the
short and long-term need of fund through reserve and owned capital.
5
Comparing debt structure
The capital structure is defined as the source of funds that the business uses in conducting
its operation and supporting. The analysis of the company indicates that the capital structure of
the company does not have debt. On the other, hand the industry and the competitors of the
company uses debt in their capital structure (Beaumont 2015).
Influence of industry in the debt of the company
The company Med Advisor belongs to a technology and innovation industry. The
company is engaged in developing software that is useful to an individual for administration of
medication in Australia. This admirable app helps in ordering regular supplies of medicines and
administering them in proper manner (Loughran and McDonald 2016). This influences the
software and pharmacy industry in the market. The present rate of growth that the business is
rapidly flourishing and attracting the potential investors towards the company as result, it has
reduced the need for the debts in the recent years.
Cost of debt
The cost of debt for Med Advisor is zero in the end of the financial year as per financial
report because there are no long or short-term debts in the company.
Share Valuation
Cost of Equity
The cost of Equity is termed as the rate of return that a business pays to investors. The
Capital Assets Pricing Model is commonly used for calculating the cost of equity. In this model,
the expected return on equity or cost of equity is calculated by adding the risk free rate of return
⊘ This is a preview!⊘
Do you want full access?
Subscribe today to unlock all pages.
Trusted by 1+ million students worldwide
6
with the expected premium for the risk (Benson et al. 2014). The calculation of the cost of equity
is provided below:
Statement Showing calculation of Cost of Equity
Particulars Amount
Risk Free rate of return 2.76%
Market Rate of return 5.50%
Beta -0.01
Cost of Equity 3%
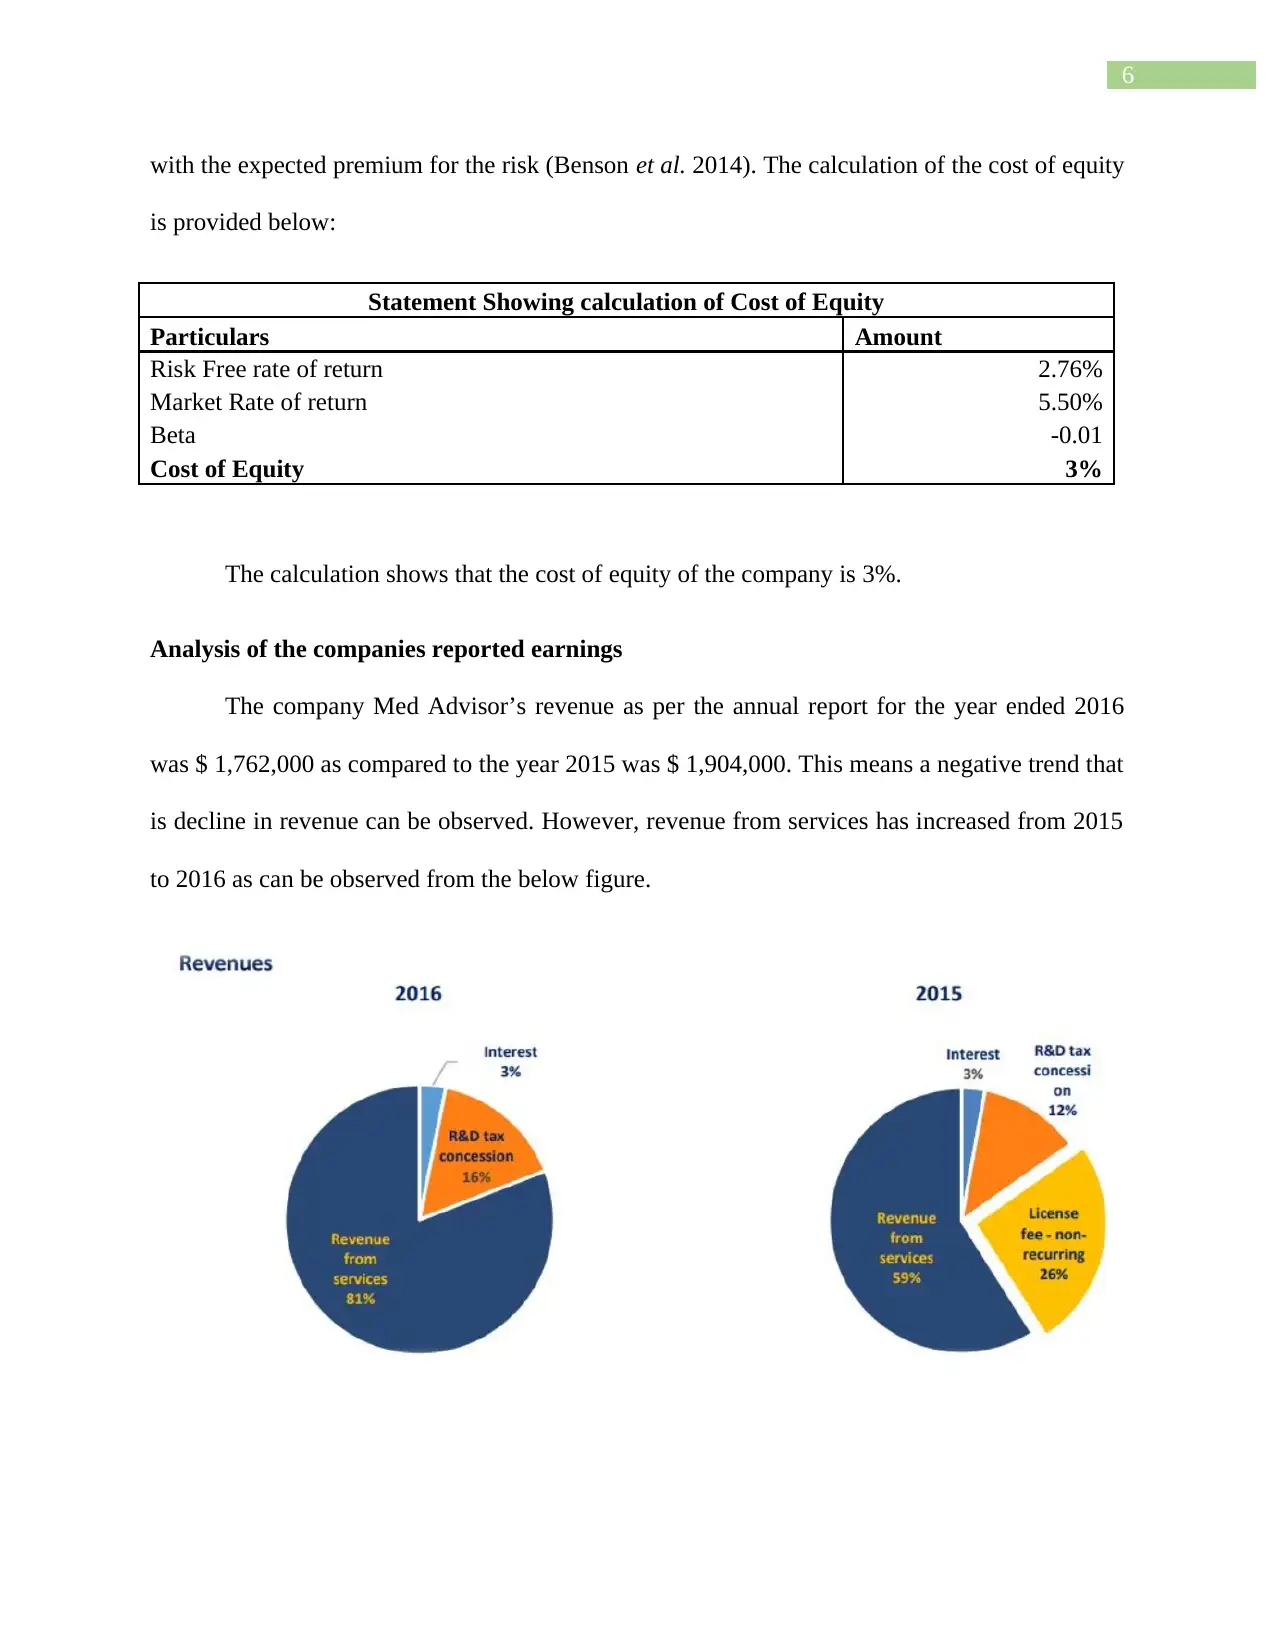
The calculation shows that the cost of equity of the company is 3%.
Analysis of the companies reported earnings
The company Med Advisor’s revenue as per the annual report for the year ended 2016
was $ 1,762,000 as compared to the year 2015 was $ 1,904,000. This means a negative trend that
is decline in revenue can be observed. However, revenue from services has increased from 2015
to 2016 as can be observed from the below figure.
with the expected premium for the risk (Benson et al. 2014). The calculation of the cost of equity
is provided below:
Statement Showing calculation of Cost of Equity
Particulars Amount
Risk Free rate of return 2.76%
Market Rate of return 5.50%
Beta -0.01
Cost of Equity 3%
The calculation shows that the cost of equity of the company is 3%.
Analysis of the companies reported earnings
The company Med Advisor’s revenue as per the annual report for the year ended 2016
was $ 1,762,000 as compared to the year 2015 was $ 1,904,000. This means a negative trend that
is decline in revenue can be observed. However, revenue from services has increased from 2015
to 2016 as can be observed from the below figure.
Paraphrase This Document
Need a fresh take? Get an instant paraphrase of this document with our AI Paraphraser
7
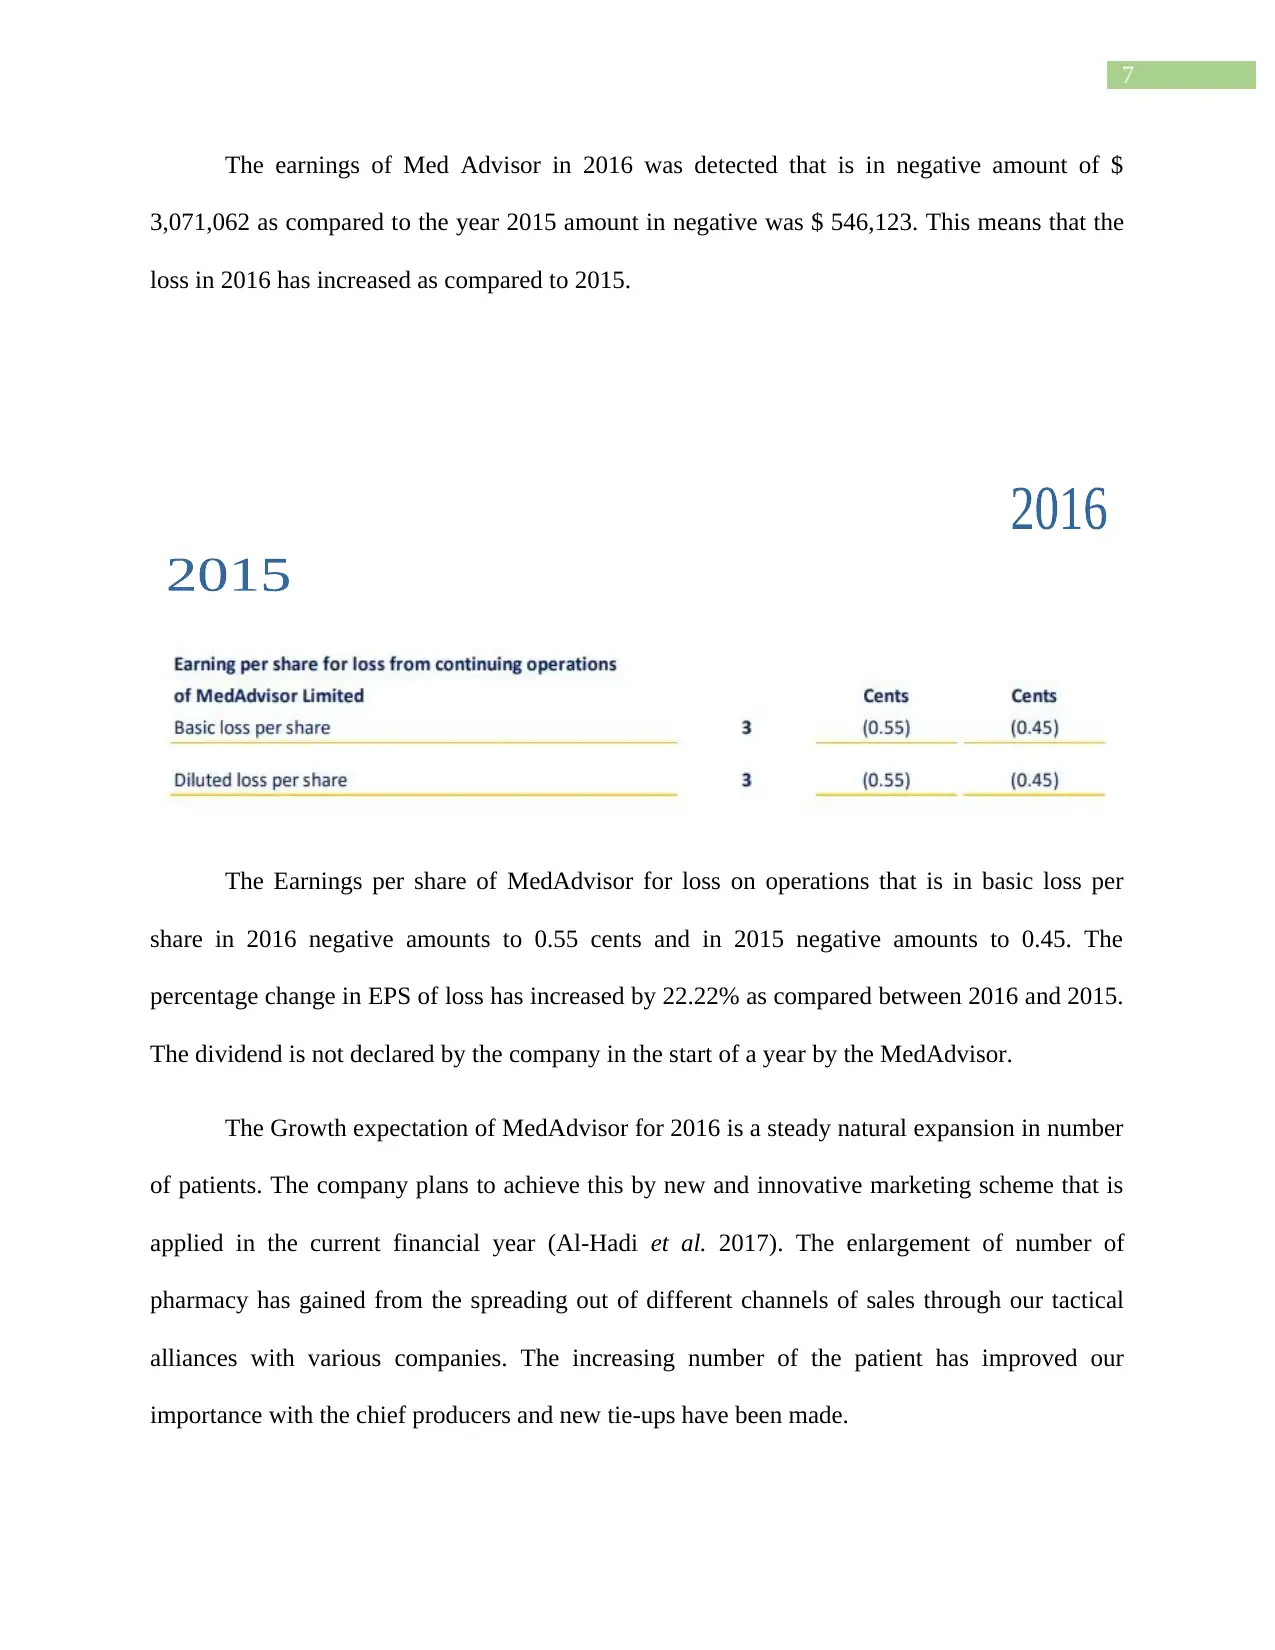
The earnings of Med Advisor in 2016 was detected that is in negative amount of $
3,071,062 as compared to the year 2015 amount in negative was $ 546,123. This means that the
loss in 2016 has increased as compared to 2015.
The Earnings per share of MedAdvisor for loss on operations that is in basic loss per
share in 2016 negative amounts to 0.55 cents and in 2015 negative amounts to 0.45. The
percentage change in EPS of loss has increased by 22.22% as compared between 2016 and 2015.
The dividend is not declared by the company in the start of a year by the MedAdvisor.
The Growth expectation of MedAdvisor for 2016 is a steady natural expansion in number
of patients. The company plans to achieve this by new and innovative marketing scheme that is
applied in the current financial year (Al‐Hadi et al. 2017). The enlargement of number of
pharmacy has gained from the spreading out of different channels of sales through our tactical
alliances with various companies. The increasing number of the patient has improved our
importance with the chief producers and new tie-ups have been made.
8
Valuation of companies stock using comparable approach
The PE ratio is a popular indicator for valuation of investments. The PE ratio can be used
to determine the value of the company. In the current case, the company does not have earning
but has incurred losses (McLaney and Atrill 2014). Therefore, PE ratio cannot be applied for
calculating the PE ratio.
Reasonable Approach based on the current market price
The company can value its company by using the dividend growth model and the PE
ratio. In the current case, the company has not declared dividend so the dividend growth model
cannot be applied in valuing the company (Brief and Peasnell 2013). Therefore, it can be said
that for this company PE ratio is appropriate for valuing the company.
Additional data and information required to value Companies stock
The additional data that may be used for evaluation of the stocks of a business are the
dividend per share, net profit after tax, market capital and the change of earning per share of the
business to its peers (Gippel et al. 2015).
Cost of Capital
Calculation of Weighted Average Cost of capital (calculation)
The Med Advisor does not have any debt in its capital structure so the cost of equity of
the company is Weighted Average Cost of Capital (WACC) of the company.
Company’s tax rate in the WACC calculation
The rate of tax for the company computation of Weighted Average Cost Calculation is
30.3%. The tax rate is applied for calculating for cost of debt and interest bearing securities.
⊘ This is a preview!⊘
Do you want full access?
Subscribe today to unlock all pages.
Trusted by 1+ million students worldwide
9
Difference between Cost of debt and Cost of Equity
The difference between the cost of debt and cost equity are due to the following reasons:
The cost of equity is the expected return of the shareholders. On the other hand, the cost
of equity is the expected return of the bondholders or loan providers.
The cost of equity is not tax deductible whereas the cost of debt is tax deductible.
Current Liability in cost of capital calculation
The current liabilities can be included while computing the cost of the capital. The main
pros of including the current liability in the cost of capital are deductible to tax. On the other
hand, the major cons of involving the current liabilities that will increases the dangers in cost of
the capital (Christensen and Kent 2016).
Major value of WACC computation:
The major value in Med Advisor for WACC calculation is cost of equity, as there is no
existence of any amount of debt. The investors will consider the business as good enough for
creation of its decisions relating to investments.
Example of use of WACC in Investment decision-making
The company has utilized the WACC in deciding upon investments in office furniture,
leasehold improvement and office equipments.
Paraphrase This Document
Need a fresh take? Get an instant paraphrase of this document with our AI Paraphraser
10
Capital Structure
The Capital structure is a way the business manages its finance in the whole operations
and expansion by utilizing the financing sources. In the company Med Advisor, it has equity
capital but does have any debt (Wood 2016).
Optimum Capital Structure
The optimal capital structure is given as the finest ratio of debt to equity at that the
business can make the most of its worth. If the capital structure involves more and more portions
of debt it will construct a business more loaded for compensating the interests and exposes this to
greater risk that will build the business more loaded situations. This may make the conditions in
the economy of a business harsher.
Market Analysis
Comparative Analysis of financial performance of company and industry
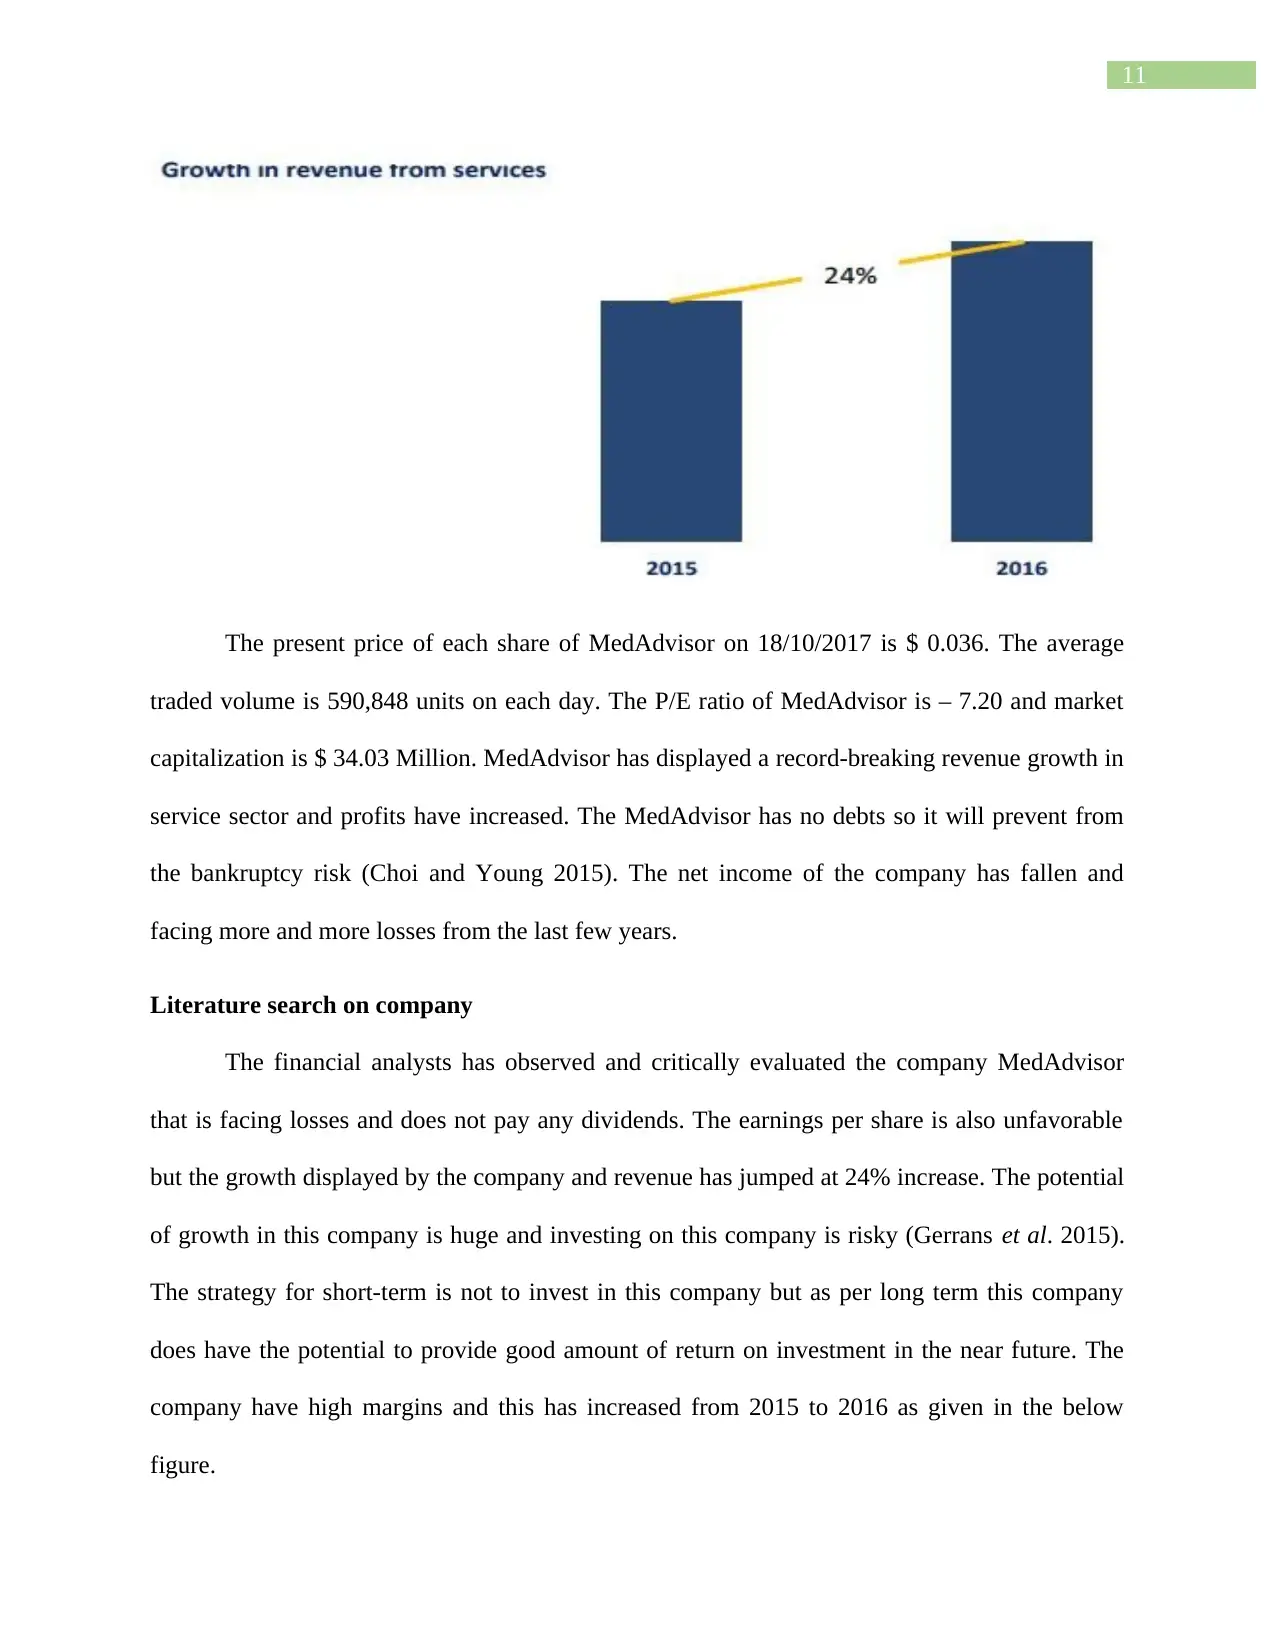
The financial performance of MedAdvisor is being evaluated as per the earning per share
of the company is in negative amount of $ 0.55 Cents. The diluted earnings per share are a
negative amount of $ 0.55 Cents. The growth from services in respect to revenues has increased
by 24% from the year 2015 to 2016.
Capital Structure
The Capital structure is a way the business manages its finance in the whole operations
and expansion by utilizing the financing sources. In the company Med Advisor, it has equity
capital but does have any debt (Wood 2016).
Optimum Capital Structure
The optimal capital structure is given as the finest ratio of debt to equity at that the
business can make the most of its worth. If the capital structure involves more and more portions
of debt it will construct a business more loaded for compensating the interests and exposes this to
greater risk that will build the business more loaded situations. This may make the conditions in
the economy of a business harsher.
Market Analysis
Comparative Analysis of financial performance of company and industry
The financial performance of MedAdvisor is being evaluated as per the earning per share
of the company is in negative amount of $ 0.55 Cents. The diluted earnings per share are a
negative amount of $ 0.55 Cents. The growth from services in respect to revenues has increased
by 24% from the year 2015 to 2016.
11
The present price of each share of MedAdvisor on 18/10/2017 is $ 0.036. The average
traded volume is 590,848 units on each day. The P/E ratio of MedAdvisor is – 7.20 and market
capitalization is $ 34.03 Million. MedAdvisor has displayed a record-breaking revenue growth in
service sector and profits have increased. The MedAdvisor has no debts so it will prevent from
the bankruptcy risk (Choi and Young 2015). The net income of the company has fallen and
facing more and more losses from the last few years.
Literature search on company
The financial analysts has observed and critically evaluated the company MedAdvisor
that is facing losses and does not pay any dividends. The earnings per share is also unfavorable
but the growth displayed by the company and revenue has jumped at 24% increase. The potential
of growth in this company is huge and investing on this company is risky (Gerrans et al. 2015).
The strategy for short-term is not to invest in this company but as per long term this company
does have the potential to provide good amount of return on investment in the near future. The
company have high margins and this has increased from 2015 to 2016 as given in the below
figure.
⊘ This is a preview!⊘
Do you want full access?
Subscribe today to unlock all pages.
Trusted by 1+ million students worldwide
1 out of 20
Related Documents


Your All-in-One AI-Powered Toolkit for Academic Success.
+13062052269
info@desklib.com
Available 24*7 on WhatsApp / Email
![[object Object]](/_next/static/media/star-bottom.7253800d.svg)
Unlock your academic potential
Copyright © 2020–2026 A2Z Services. All Rights Reserved. Developed and managed by ZUCOL.