Accounting Skills Report: Financial Analysis and Recommendations
VerifiedAdded on 2020/10/22
|17
|3811
|287
Report
AI Summary
This report delves into various aspects of accounting, commencing with the preparation of income statements and balance sheets. It meticulously differentiates between financial and management accounting, offering insights into cost-volume analysis through make-or-buy decisions. The report extends to financial ratio calculations, interpreting their significance for loan recommendations to Gulf Banks PLC and investment advice. A cash budget is prepared, accompanied by a discussion of its benefits and limitations. Furthermore, the report includes a detailed variance analysis, assessing variances to provide a comprehensive understanding of the company's financial standing. The document provides a thorough analysis of financial data and offers actionable recommendations for financial decision-making.

ACCOUNTING SKILLS
Paraphrase This Document
Need a fresh take? Get an instant paraphrase of this document with our AI Paraphraser
TABLE OF CONTENTS
INTRODUCTION...........................................................................................................................4
QUESTION 1 ..................................................................................................................................4
Prepare the income statement and balance sheet of the following..............................................4
B) Differentiate between financial and management accounting...............................................5
QUESTION 2(a)..............................................................................................................................6
Calculate the following ..............................................................................................................6
(B)Calculate the following with the help of make or buy decision process...............................7
(2) make or buy decision.............................................................................................................8
Interpretation...................................................................................................................................8
Above calculation provides the analysis of unit cost of production. It shows the firm can go for
the new product. The organization has produced 15000 units of 3741 products. Moreover, firm is
able to recover contribution of 15000 units by producing different commodities in a feasible
manner. This criticizes that organization can decrease the direct expenses in effective way. There
is nearly 74.36% of cost that will be incurred if an organization will go for different
commodities. Therefore, it will be profitable for thunder company if it will do the production in
place of Buying. ..............................................................................................................................8
QUESTION 3 ..................................................................................................................................8
A) Calculate and interpret the financial ratios for 2016 corresponding to the industry norms
provided as follows: ...................................................................................................................8
Presenting report to Gulf Banks PLC regarding recommendation for loan sanction...............10
C) Interpretation of ratio regarding the investment in the company and recommendation to
investors....................................................................................................................................11
QUESTION 4 ................................................................................................................................11
A) Preparing cash budget of ABACUS Inc..............................................................................11
Benefits and limitation of budgeting ........................................................................................12
QUESTION 5.................................................................................................................................13
1. A) Calculation of various variances......................................................................................13
B) Calculation of variable overhead spending variance...........................................................14
C) Computation of variable overhead efficiency variance.......................................................15
Definition of Variance Analysis ...............................................................................................15

CONCLUSION..............................................................................................................................16
REFERENCES..............................................................................................................................17
REFERENCES..............................................................................................................................17
⊘ This is a preview!⊘
Do you want full access?
Subscribe today to unlock all pages.
Trusted by 1+ million students worldwide
INTRODUCTION
Accounting is the major part of an organization. It plays an important role to assess the
financial position of any company. Present report will provide an income statement and a
balance sheet which are relevant with various accounting issues. The report will critically
emphasize on the differences between financial and management accounting.
The report deals with problems of cost volume analysis. This assignment provides deeper
insight of make or buy decision analysis. Report is also consisted of recommendations about
sanction of bank loan and investment for company. It will present cash budget and analysis
benefits and limitation of budgeting. At last, report has come up with variance analysis which
shows position of company by estimating differences between standard and actual targets.
QUESTION 1
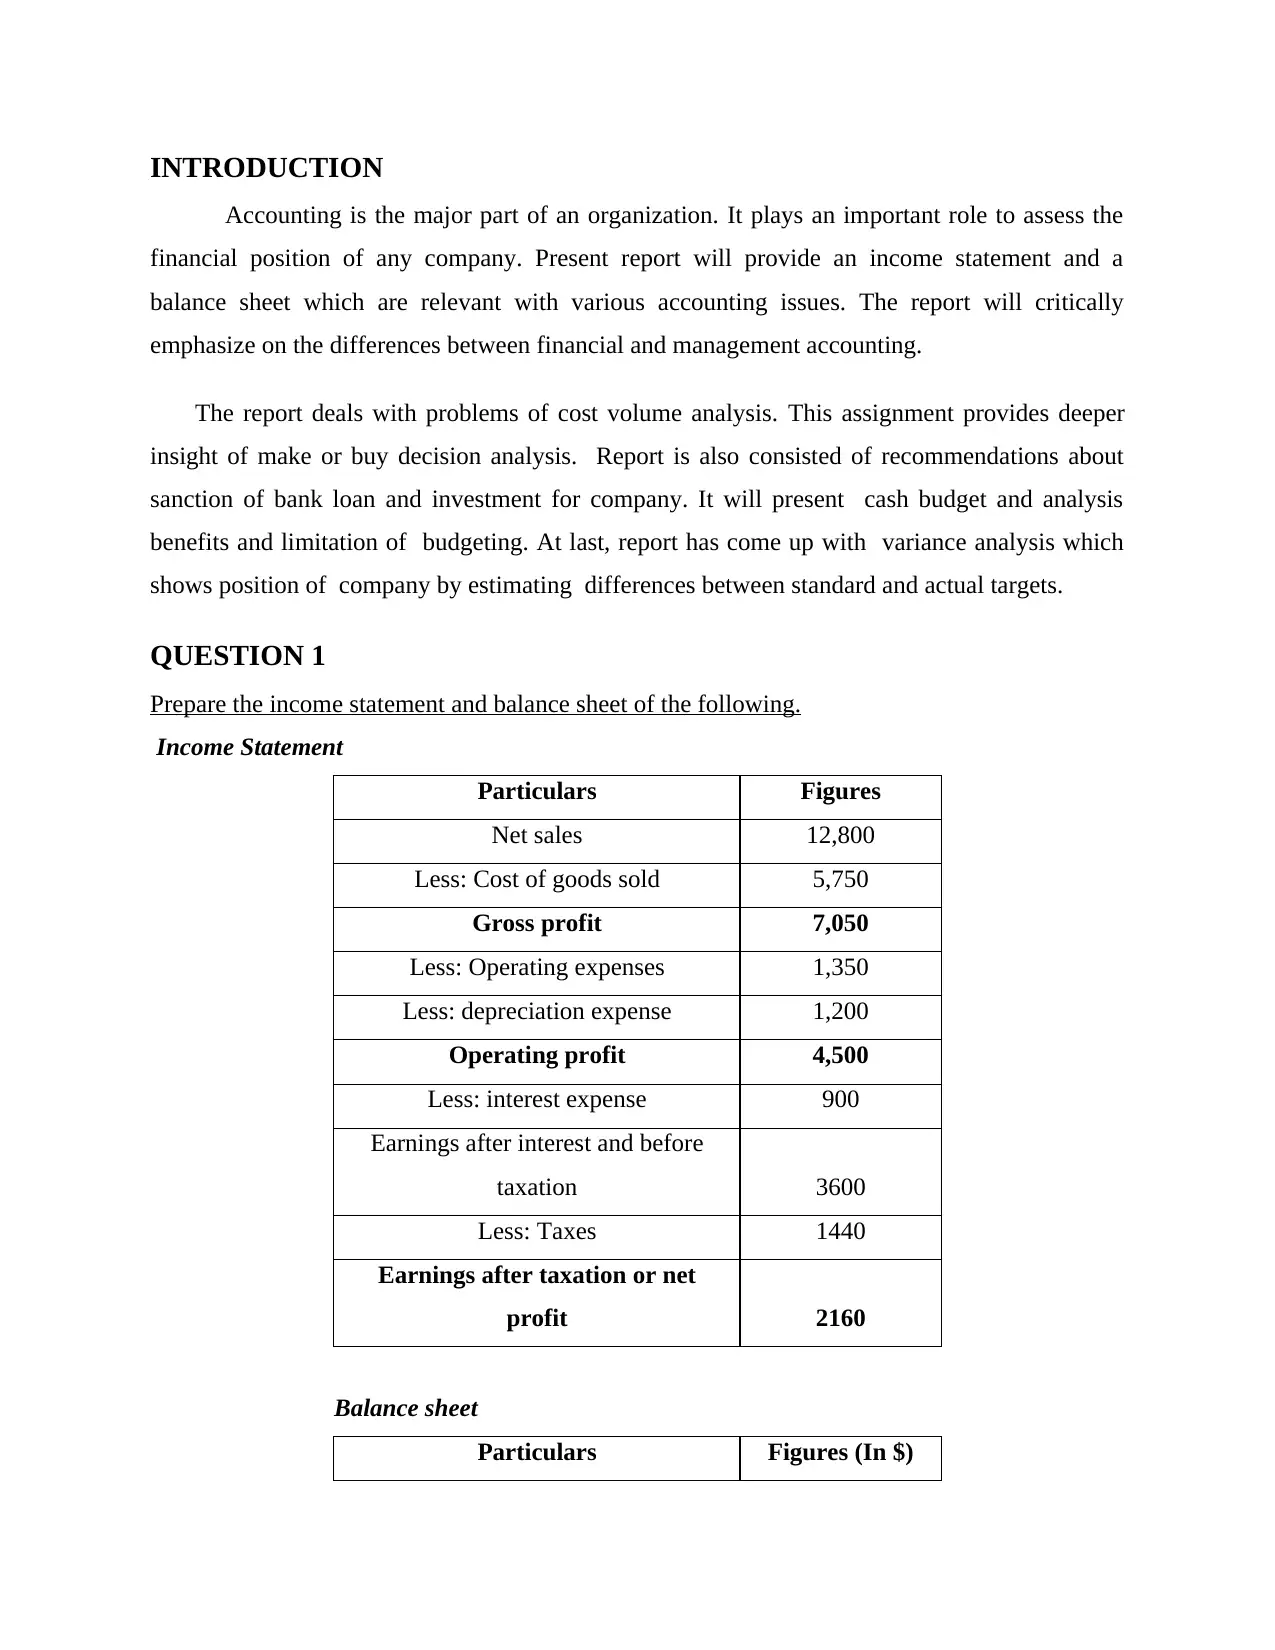
Prepare the income statement and balance sheet of the following.
Income Statement
Particulars Figures
Net sales 12,800
Less: Cost of goods sold 5,750
Gross profit 7,050
Less: Operating expenses 1,350
Less: depreciation expense 1,200
Operating profit 4,500
Less: interest expense 900
Earnings after interest and before
taxation 3600
Less: Taxes 1440
Earnings after taxation or net
profit 2160
Balance sheet
Particulars Figures (In $)
Accounting is the major part of an organization. It plays an important role to assess the
financial position of any company. Present report will provide an income statement and a
balance sheet which are relevant with various accounting issues. The report will critically
emphasize on the differences between financial and management accounting.
The report deals with problems of cost volume analysis. This assignment provides deeper
insight of make or buy decision analysis. Report is also consisted of recommendations about
sanction of bank loan and investment for company. It will present cash budget and analysis
benefits and limitation of budgeting. At last, report has come up with variance analysis which
shows position of company by estimating differences between standard and actual targets.
QUESTION 1
Prepare the income statement and balance sheet of the following.
Income Statement
Particulars Figures
Net sales 12,800
Less: Cost of goods sold 5,750
Gross profit 7,050
Less: Operating expenses 1,350
Less: depreciation expense 1,200
Operating profit 4,500
Less: interest expense 900
Earnings after interest and before
taxation 3600
Less: Taxes 1440
Earnings after taxation or net
profit 2160
Balance sheet
Particulars Figures (In $)
Paraphrase This Document
Need a fresh take? Get an instant paraphrase of this document with our AI Paraphraser
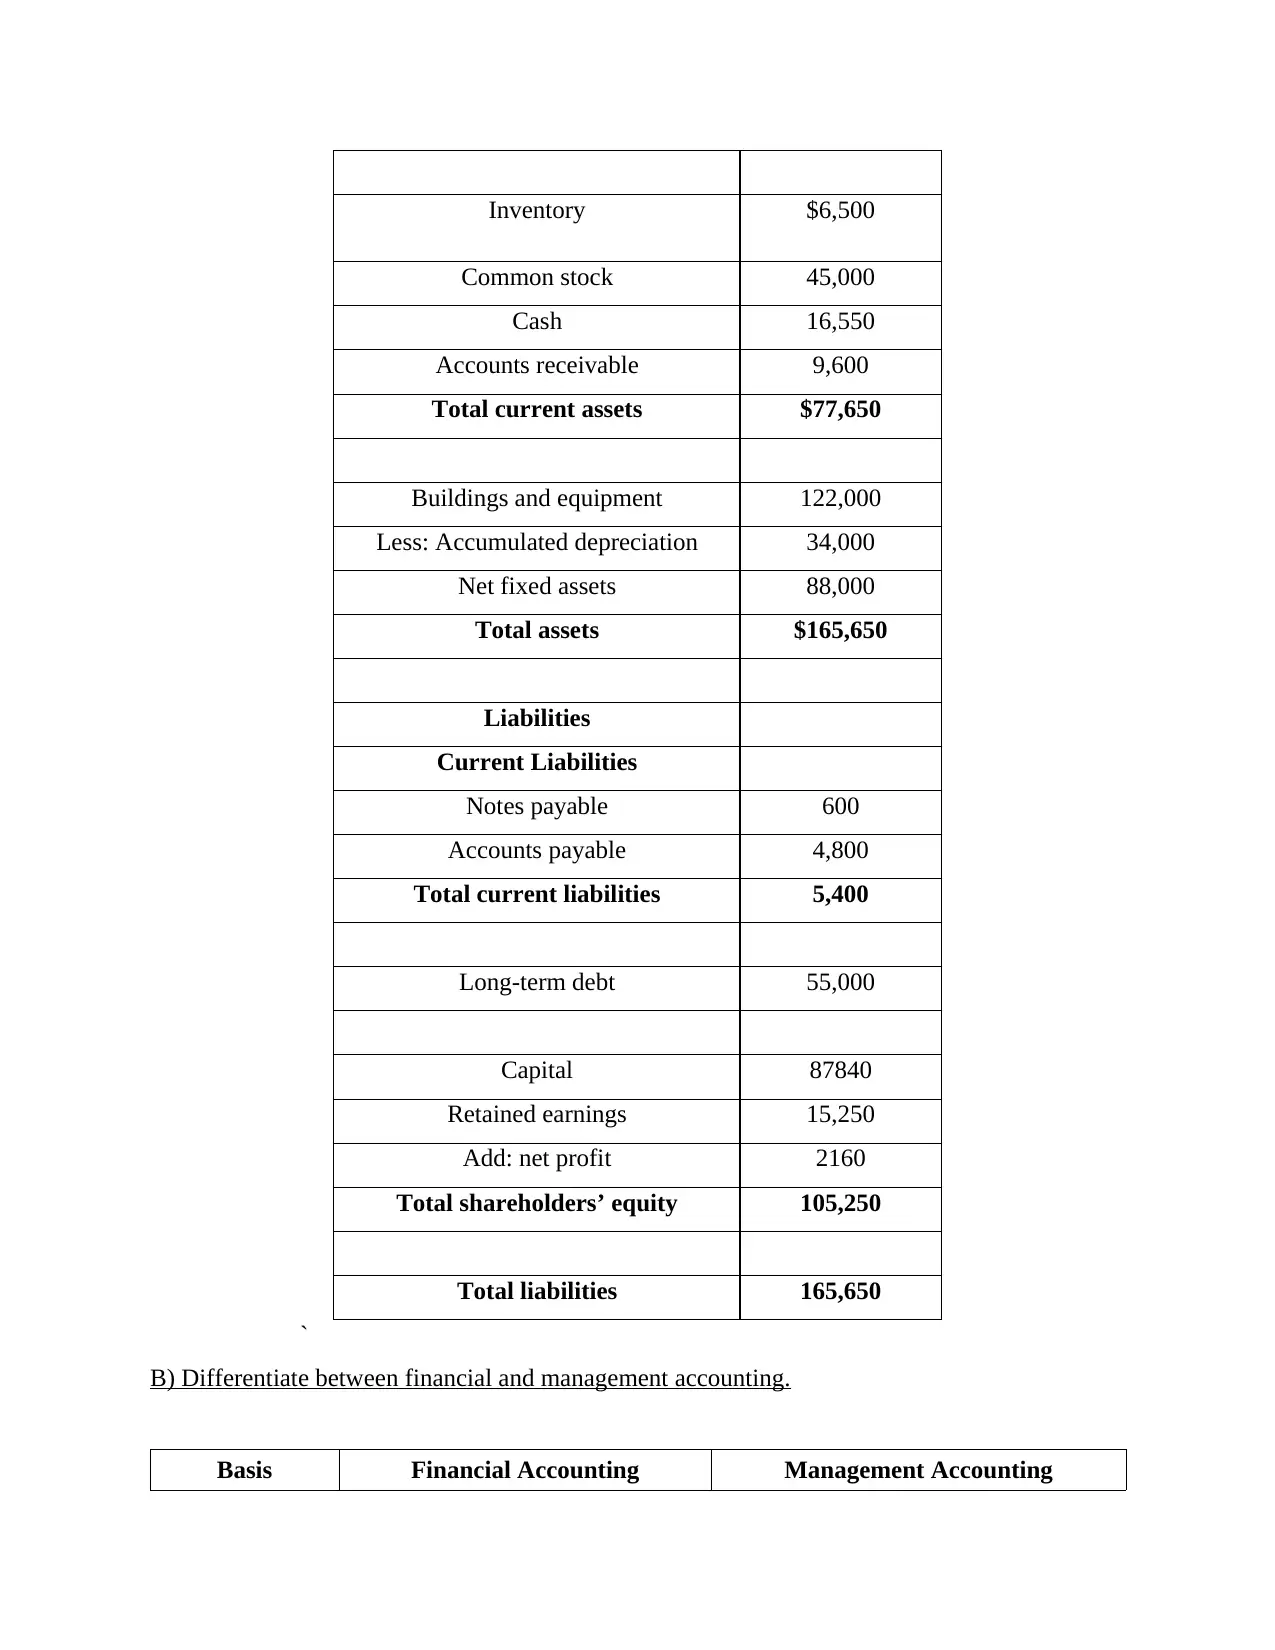
Inventory $6,500
Common stock 45,000
Cash 16,550
Accounts receivable 9,600
Total current assets $77,650
Buildings and equipment 122,000
Less: Accumulated depreciation 34,000
Net fixed assets 88,000
Total assets $165,650
Liabilities
Current Liabilities
Notes payable 600
Accounts payable 4,800
Total current liabilities 5,400
Long-term debt 55,000
Capital 87840
Retained earnings 15,250
Add: net profit 2160
Total shareholders’ equity 105,250
Total liabilities 165,650
`
B) Differentiate between financial and management accounting.
Basis Financial Accounting Management Accounting
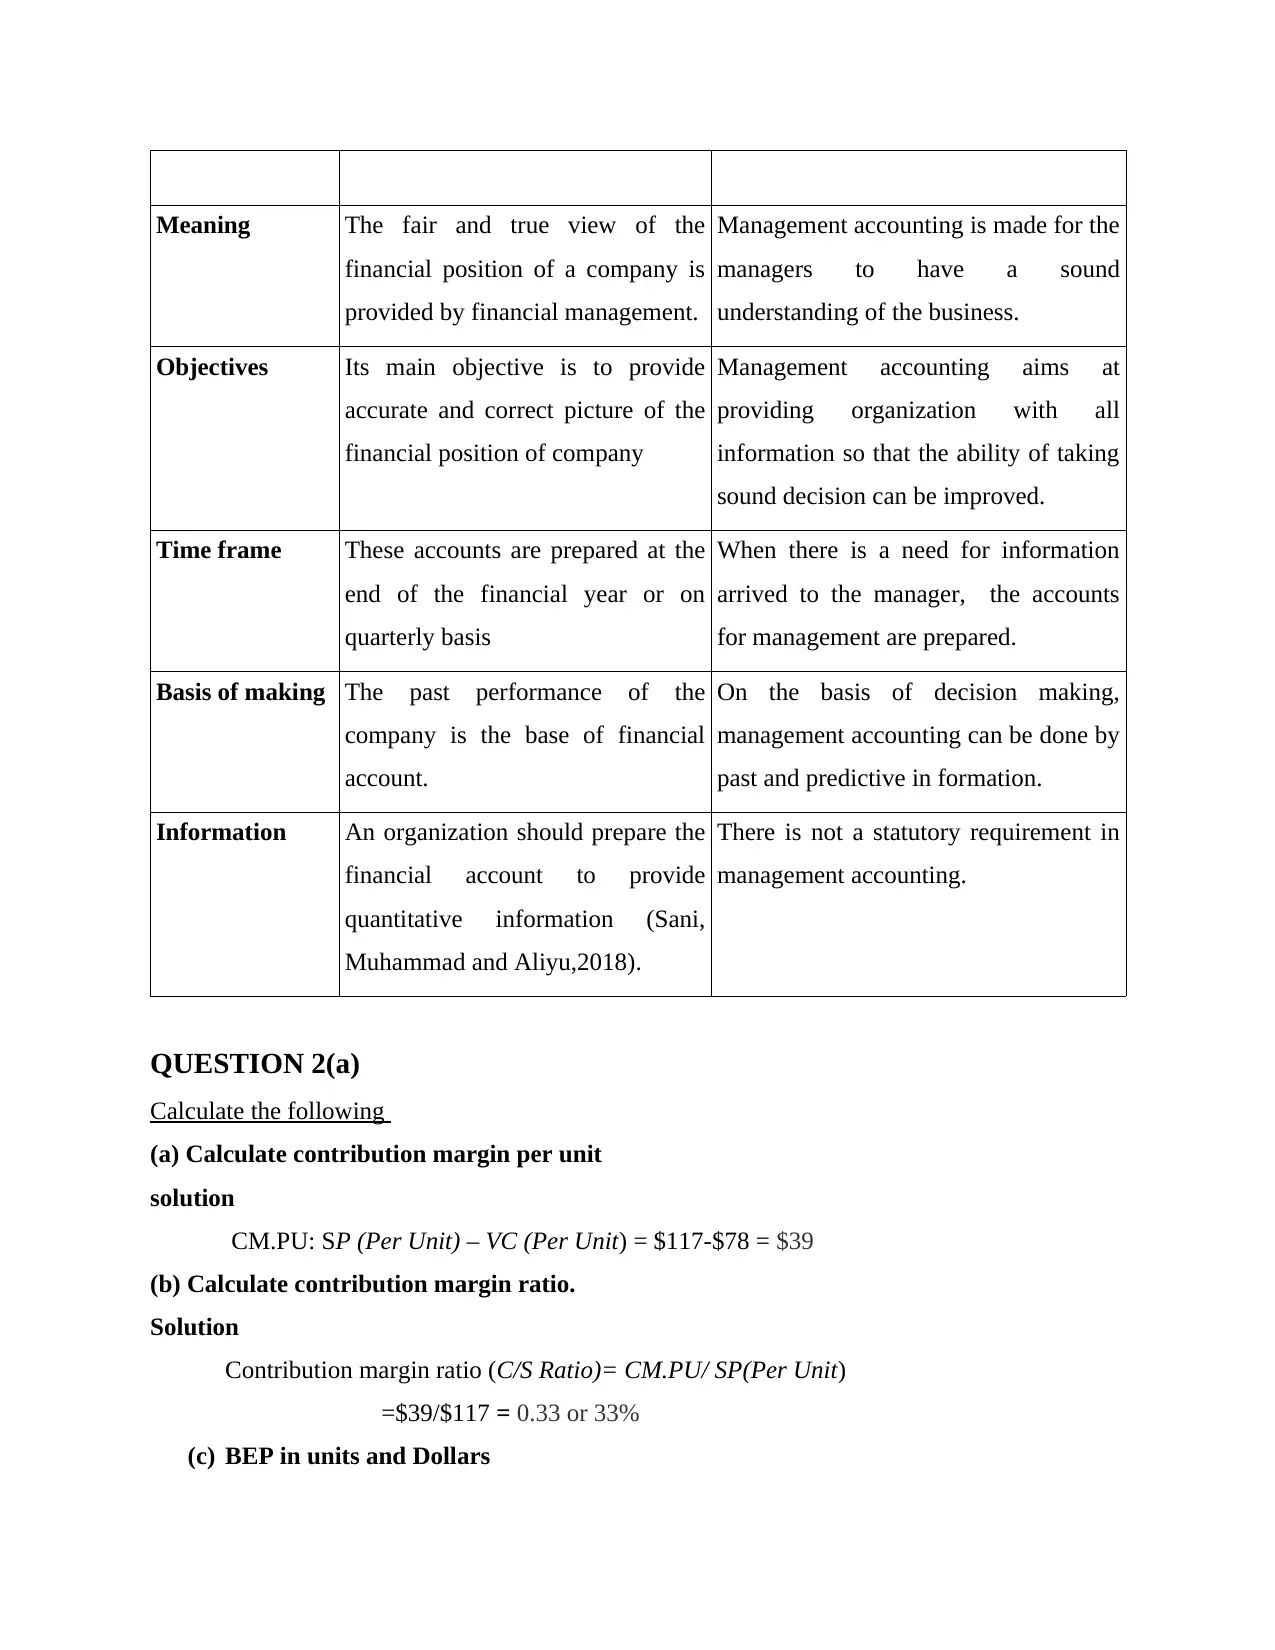
Meaning The fair and true view of the
financial position of a company is
provided by financial management.
Management accounting is made for the
managers to have a sound
understanding of the business.
Objectives Its main objective is to provide
accurate and correct picture of the
financial position of company
Management accounting aims at
providing organization with all
information so that the ability of taking
sound decision can be improved.
Time frame These accounts are prepared at the
end of the financial year or on
quarterly basis
When there is a need for information
arrived to the manager, the accounts
for management are prepared.
Basis of making The past performance of the
company is the base of financial
account.
On the basis of decision making,
management accounting can be done by
past and predictive in formation.
Information An organization should prepare the
financial account to provide
quantitative information (Sani,
Muhammad and Aliyu,2018).
There is not a statutory requirement in
management accounting.
QUESTION 2(a)
Calculate the following
(a) Calculate contribution margin per unit
solution
CM.PU: SP (Per Unit) – VC (Per Unit) = $117-$78 = $39
(b) Calculate contribution margin ratio.
Solution
Contribution margin ratio (C/S Ratio)= CM.PU/ SP(Per Unit)
=$39/$117 = 0.33 or 33%
(c) BEP in units and Dollars
⊘ This is a preview!⊘
Do you want full access?
Subscribe today to unlock all pages.
Trusted by 1+ million students worldwide
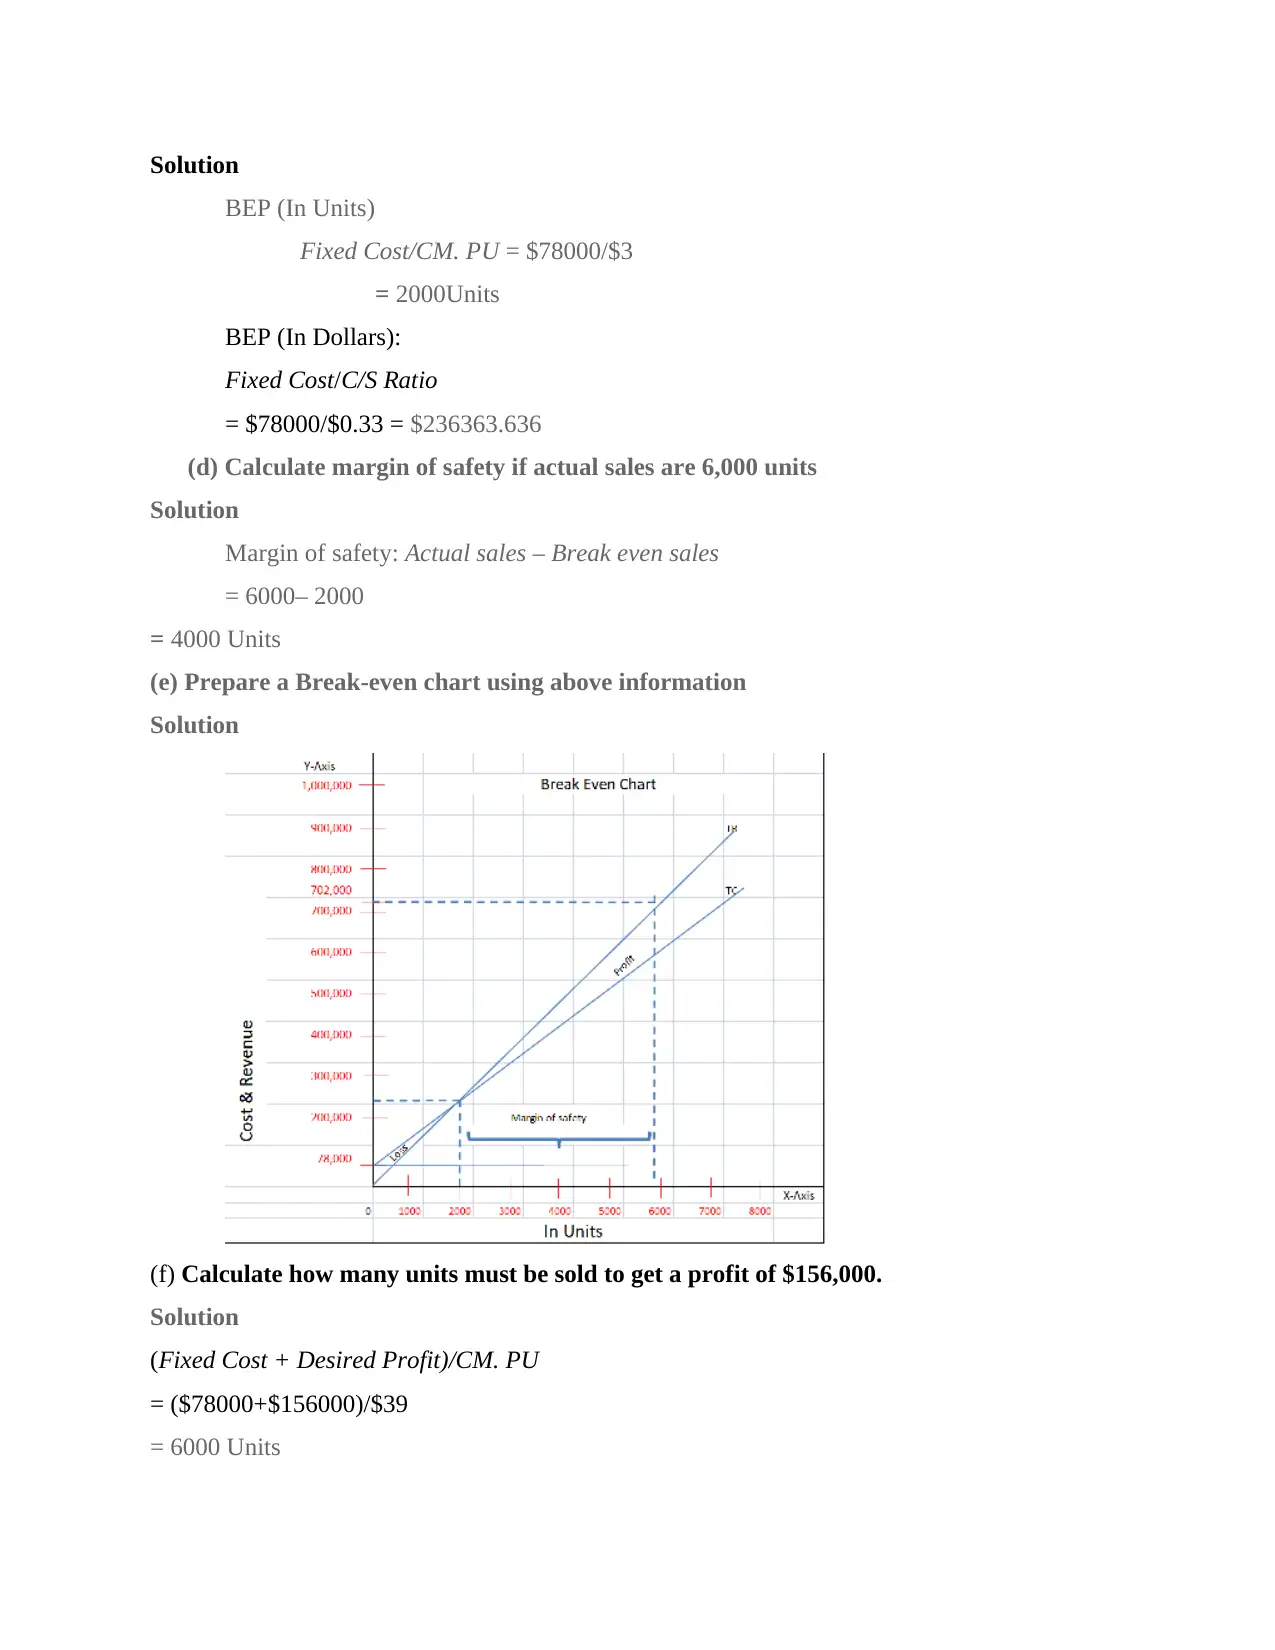
Solution
BEP (In Units)
Fixed Cost/CM. PU = $78000/$3
= 2000Units
BEP (In Dollars):
Fixed Cost/C/S Ratio
= $78000/$0.33 = $236363.636
(d) Calculate margin of safety if actual sales are 6,000 units
Solution
Margin of safety: Actual sales – Break even sales
= 6000– 2000
= 4000 Units
(e) Prepare a Break-even chart using above information
Solution
(f) Calculate how many units must be sold to get a profit of $156,000.
Solution
(Fixed Cost + Desired Profit)/CM. PU
= ($78000+$156000)/$39
= 6000 Units
Paraphrase This Document
Need a fresh take? Get an instant paraphrase of this document with our AI Paraphraser
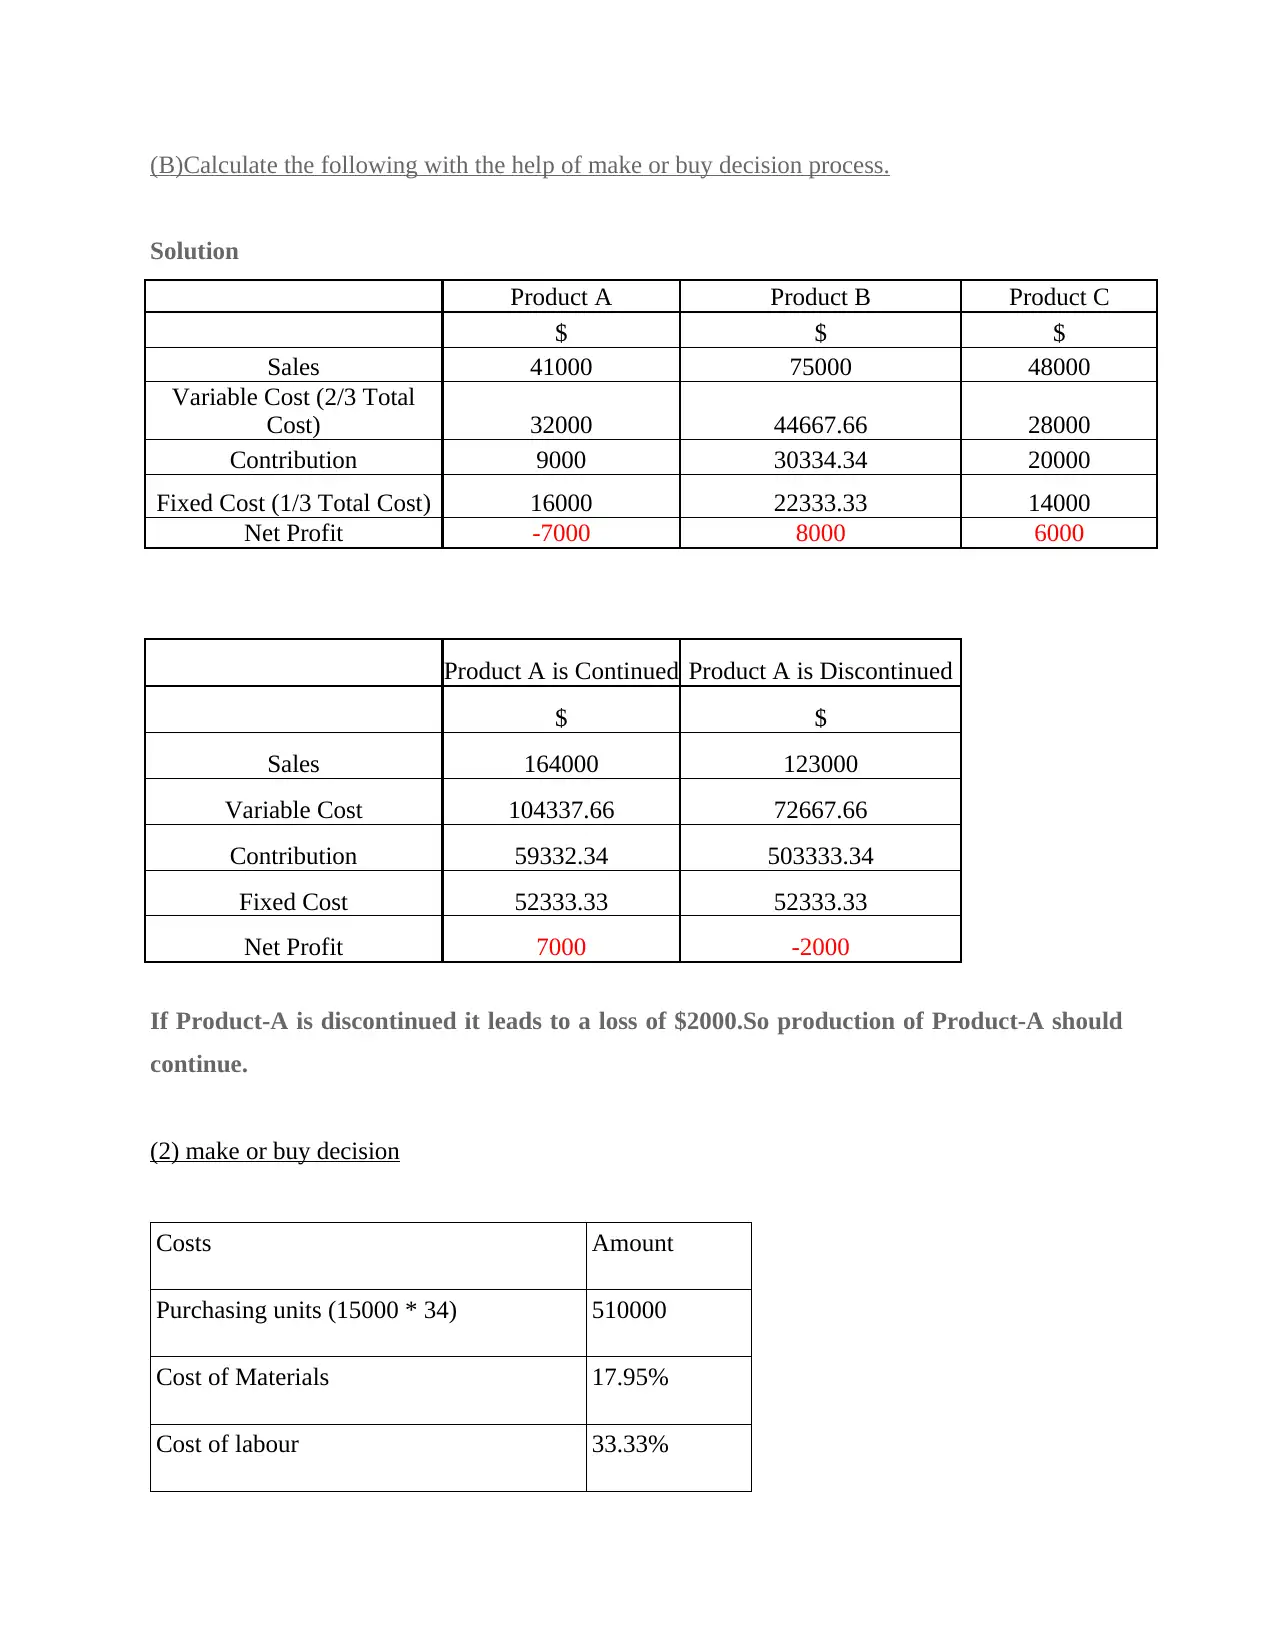
(B)Calculate the following with the help of make or buy decision process.
Solution
Product A Product B Product C
$ $ $
Sales 41000 75000 48000
Variable Cost (2/3 Total
Cost) 32000 44667.66 28000
Contribution 9000 30334.34 20000
Fixed Cost (1/3 Total Cost) 16000 22333.33 14000
Net Profit -7000 8000 6000
Product A is Continued Product A is Discontinued
$ $
Sales 164000 123000
Variable Cost 104337.66 72667.66
Contribution 59332.34 503333.34
Fixed Cost 52333.33 52333.33
Net Profit 7000 -2000
If Product-A is discontinued it leads to a loss of $2000.So production of Product-A should
continue.
(2) make or buy decision
Costs Amount
Purchasing units (15000 * 34) 510000
Cost of Materials 17.95%
Cost of labour 33.33%
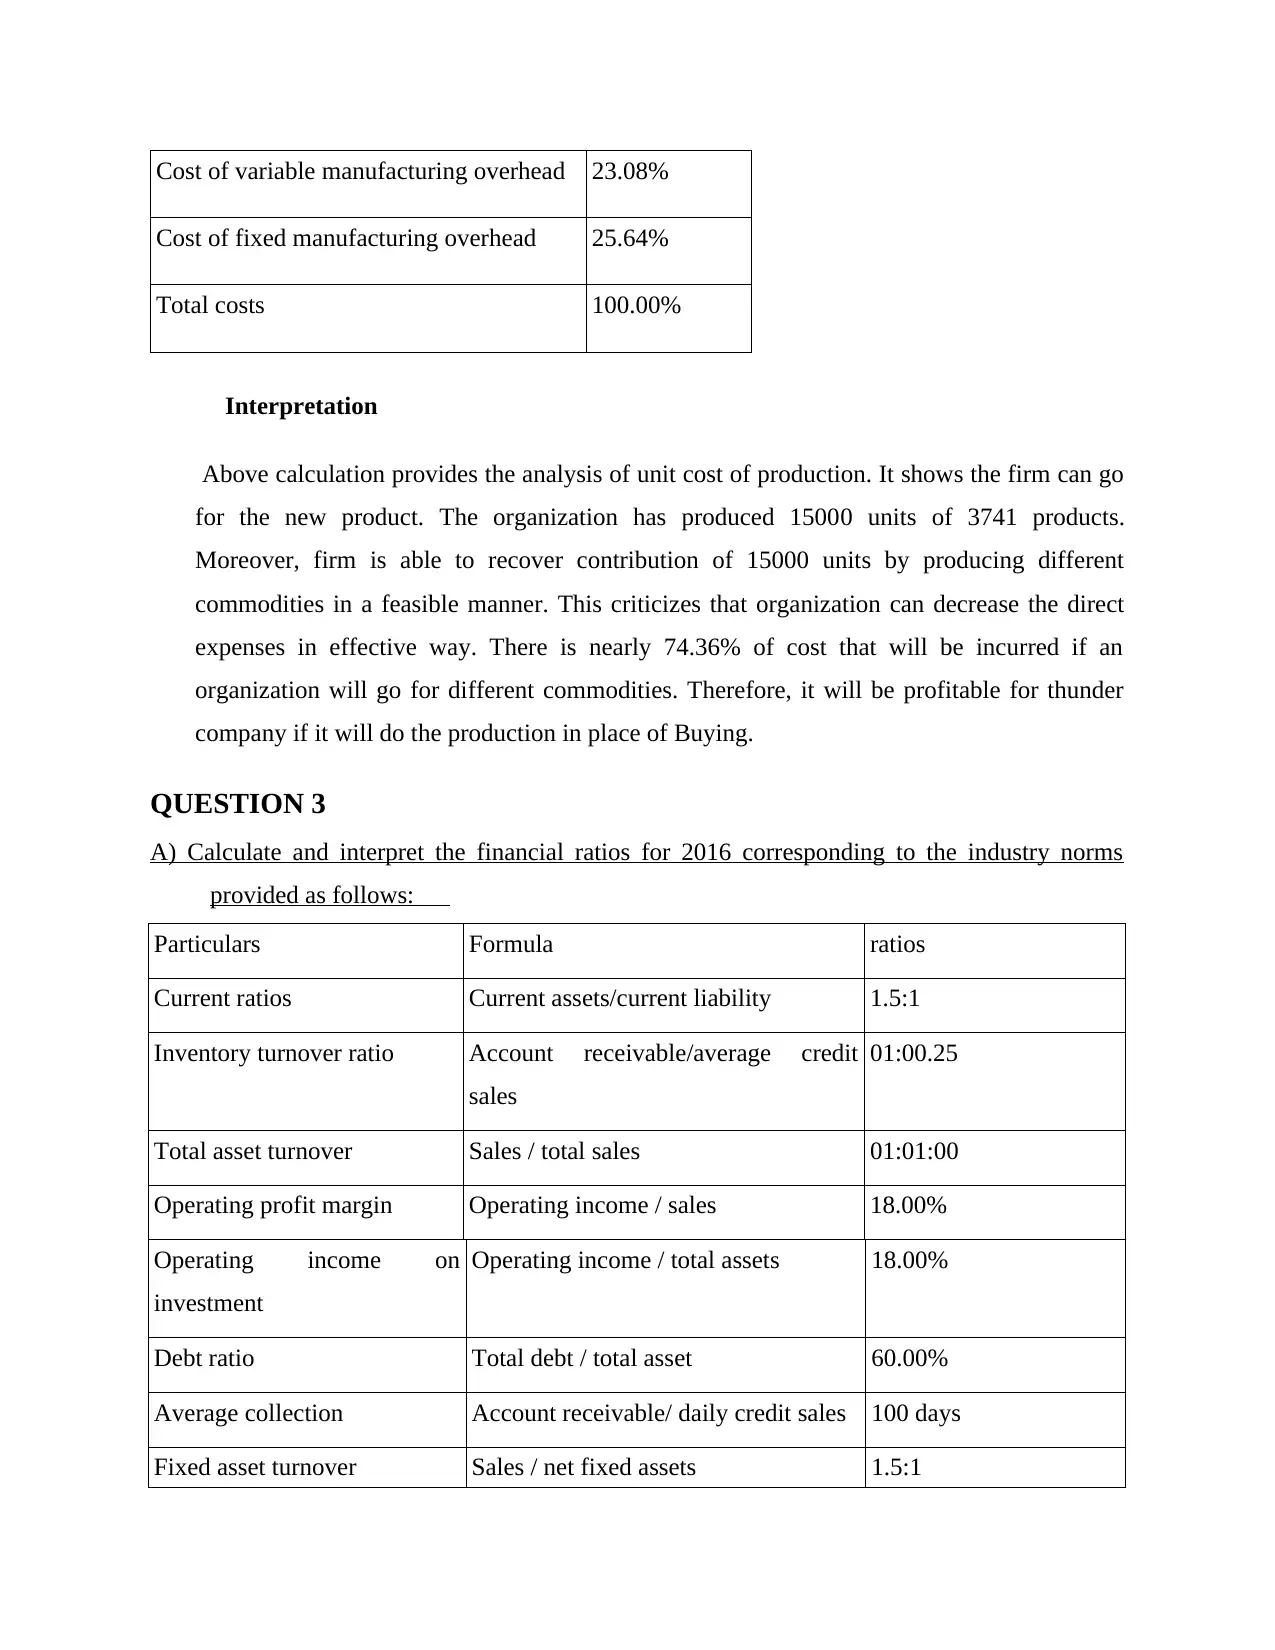
Cost of variable manufacturing overhead 23.08%
Cost of fixed manufacturing overhead 25.64%
Total costs 100.00%
Interpretation
Above calculation provides the analysis of unit cost of production. It shows the firm can go
for the new product. The organization has produced 15000 units of 3741 products.
Moreover, firm is able to recover contribution of 15000 units by producing different
commodities in a feasible manner. This criticizes that organization can decrease the direct
expenses in effective way. There is nearly 74.36% of cost that will be incurred if an
organization will go for different commodities. Therefore, it will be profitable for thunder
company if it will do the production in place of Buying.
QUESTION 3
A) Calculate and interpret the financial ratios for 2016 corresponding to the industry norms
provided as follows:
Particulars Formula ratios
Current ratios Current assets/current liability 1.5:1
Inventory turnover ratio Account receivable/average credit
sales
01:00.25
Total asset turnover Sales / total sales 01:01:00
Operating profit margin Operating income / sales 18.00%
Operating income on
investment
Operating income / total assets 18.00%
Debt ratio Total debt / total asset 60.00%
Average collection Account receivable/ daily credit sales 100 days
Fixed asset turnover Sales / net fixed assets 1.5:1
⊘ This is a preview!⊘
Do you want full access?
Subscribe today to unlock all pages.
Trusted by 1+ million students worldwide
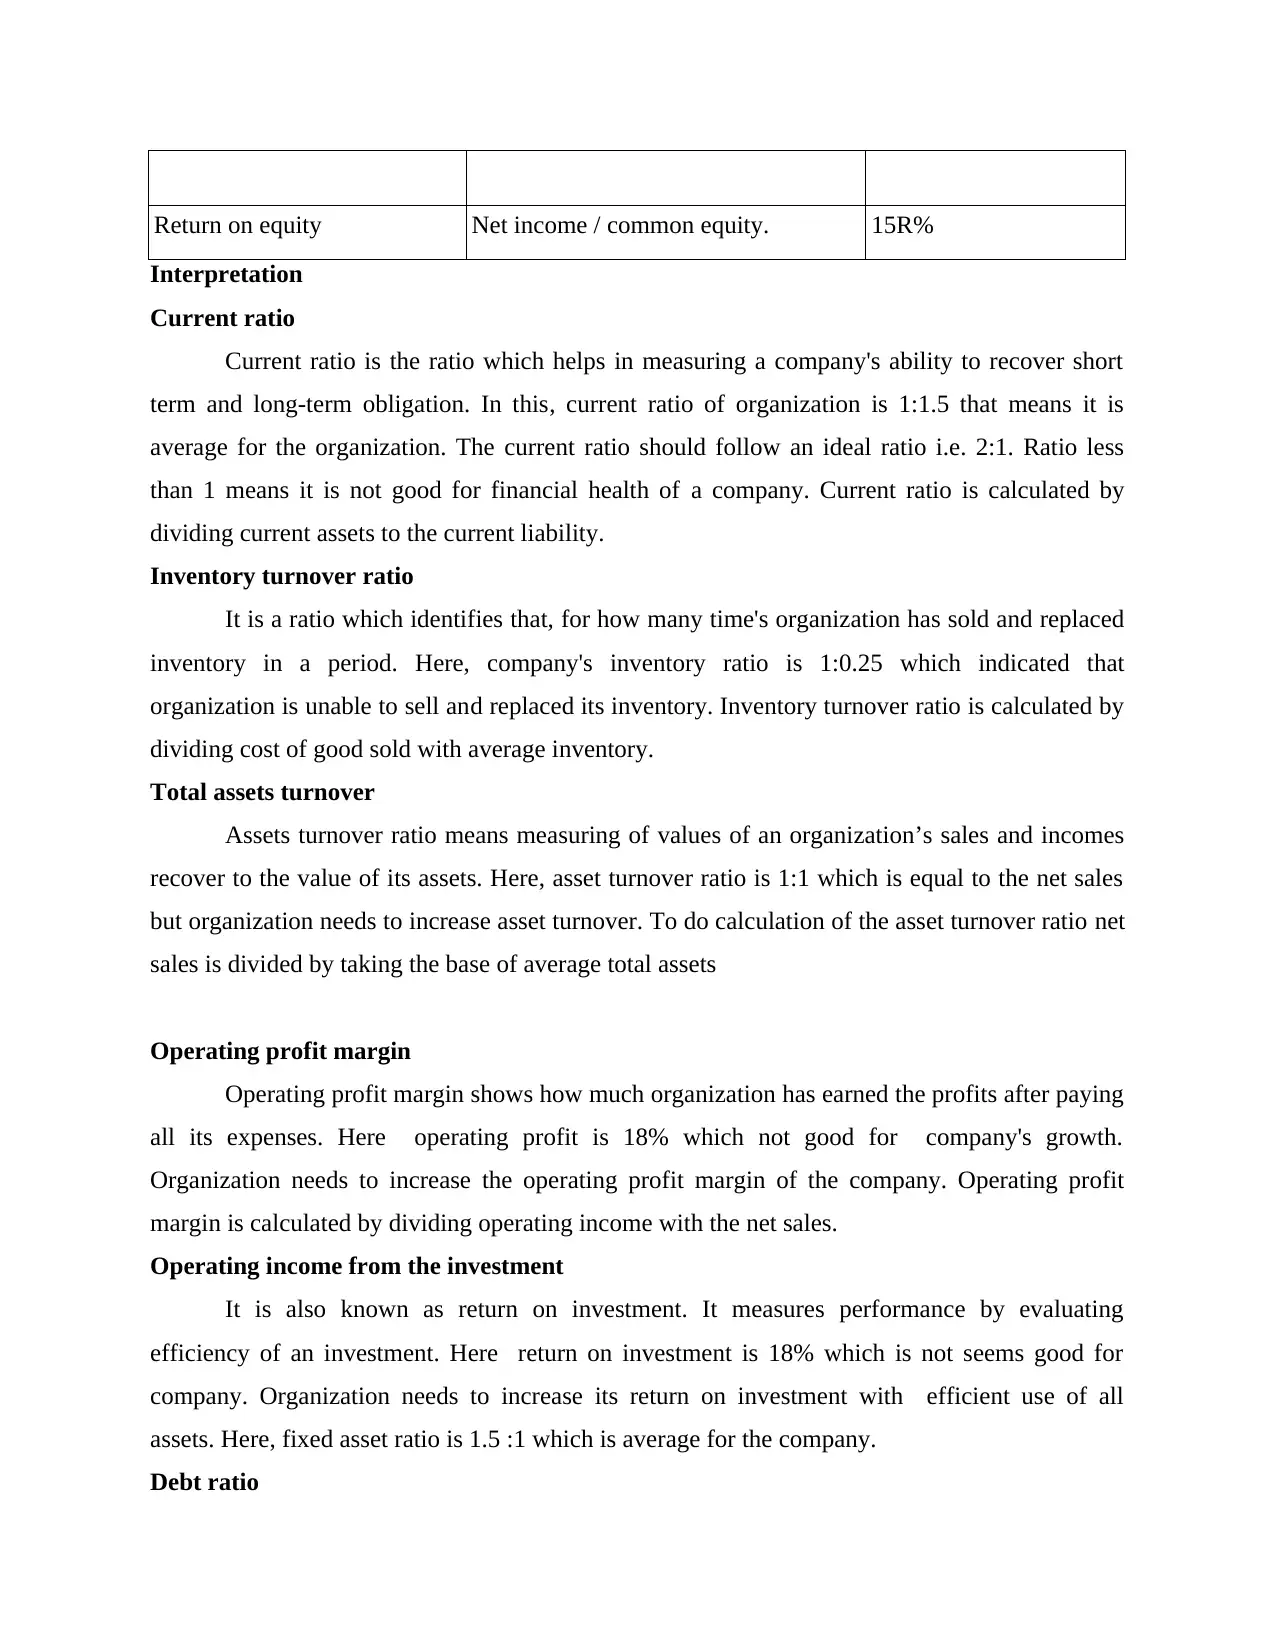
Return on equity Net income / common equity. 15R%
Interpretation
Current ratio
Current ratio is the ratio which helps in measuring a company's ability to recover short
term and long-term obligation. In this, current ratio of organization is 1:1.5 that means it is
average for the organization. The current ratio should follow an ideal ratio i.e. 2:1. Ratio less
than 1 means it is not good for financial health of a company. Current ratio is calculated by
dividing current assets to the current liability.
Inventory turnover ratio
It is a ratio which identifies that, for how many time's organization has sold and replaced
inventory in a period. Here, company's inventory ratio is 1:0.25 which indicated that
organization is unable to sell and replaced its inventory. Inventory turnover ratio is calculated by
dividing cost of good sold with average inventory.
Total assets turnover
Assets turnover ratio means measuring of values of an organization’s sales and incomes
recover to the value of its assets. Here, asset turnover ratio is 1:1 which is equal to the net sales
but organization needs to increase asset turnover. To do calculation of the asset turnover ratio net
sales is divided by taking the base of average total assets
Operating profit margin
Operating profit margin shows how much organization has earned the profits after paying
all its expenses. Here operating profit is 18% which not good for company's growth.
Organization needs to increase the operating profit margin of the company. Operating profit
margin is calculated by dividing operating income with the net sales.
Operating income from the investment
It is also known as return on investment. It measures performance by evaluating
efficiency of an investment. Here return on investment is 18% which is not seems good for
company. Organization needs to increase its return on investment with efficient use of all
assets. Here, fixed asset ratio is 1.5 :1 which is average for the company.
Debt ratio
Paraphrase This Document
Need a fresh take? Get an instant paraphrase of this document with our AI Paraphraser
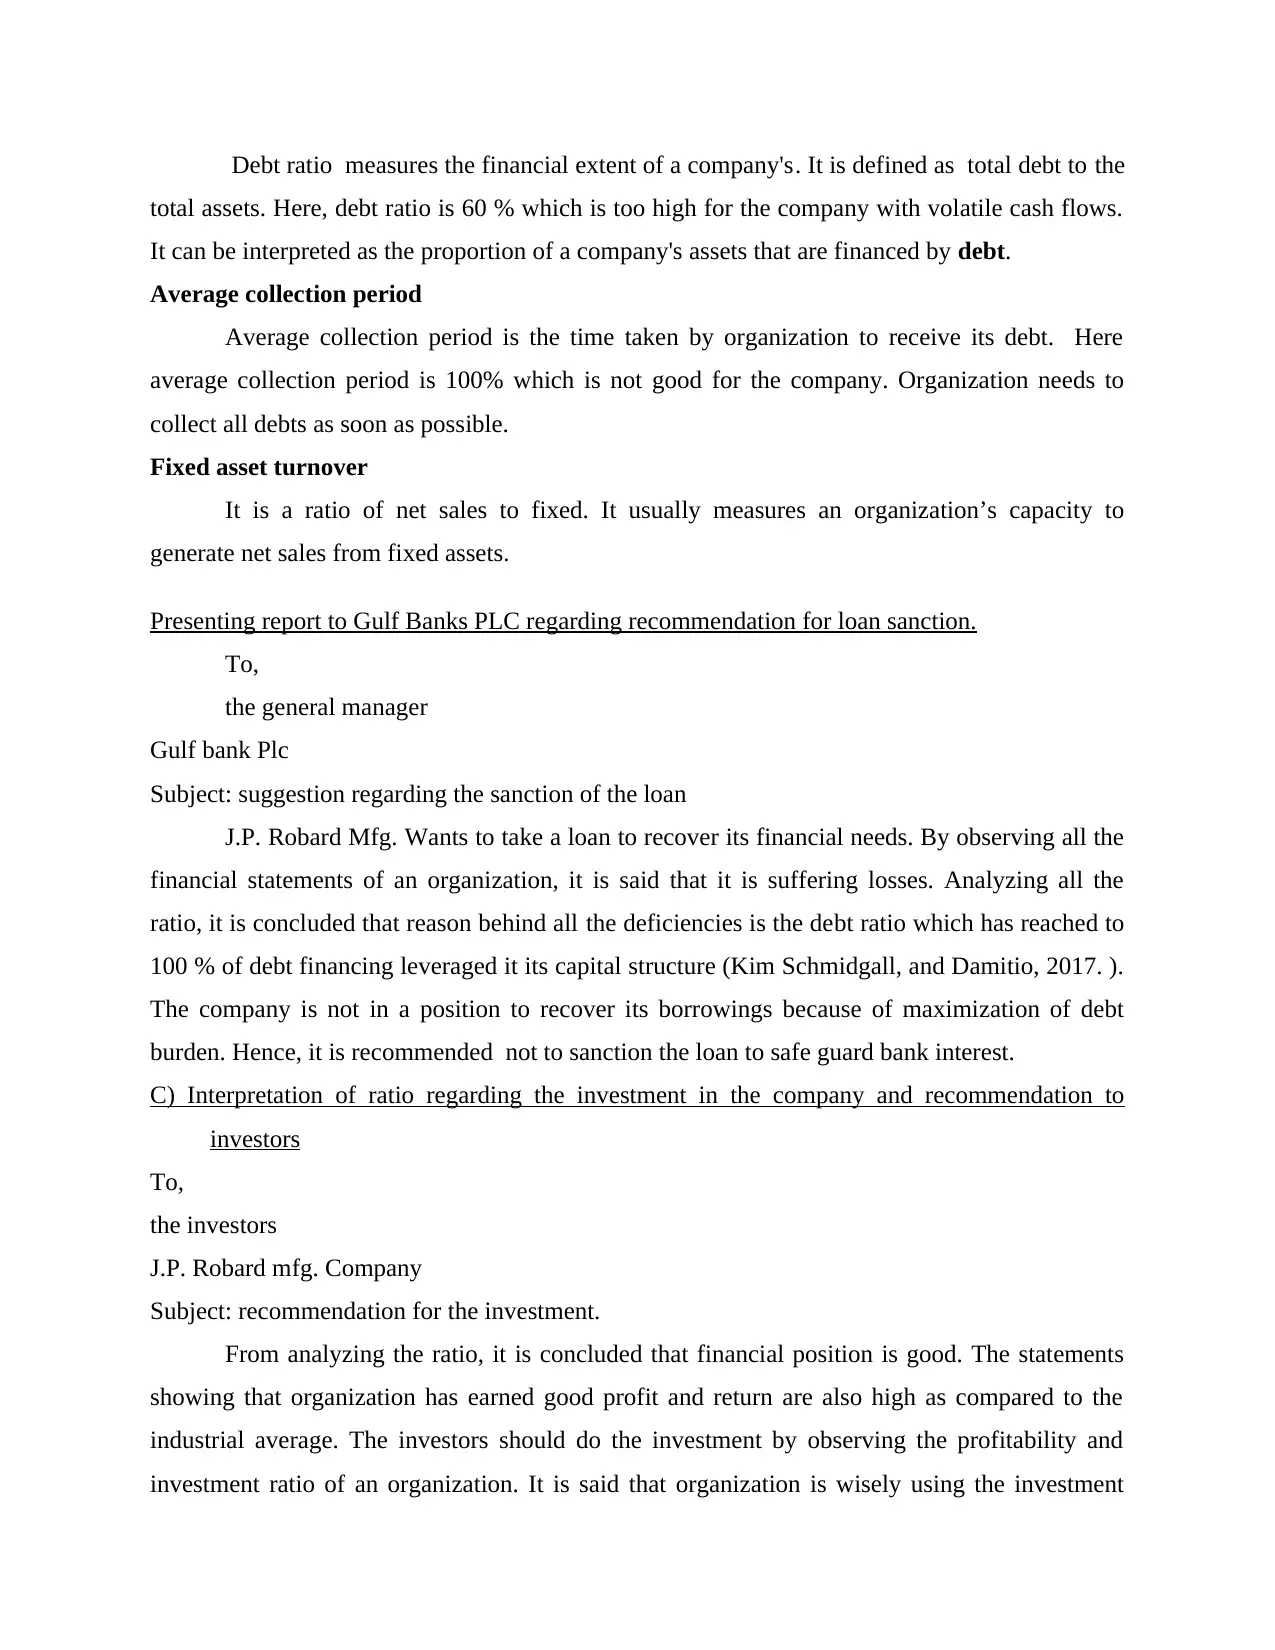
Debt ratio measures the financial extent of a company's. It is defined as total debt to the
total assets. Here, debt ratio is 60 % which is too high for the company with volatile cash flows.
It can be interpreted as the proportion of a company's assets that are financed by debt.
Average collection period
Average collection period is the time taken by organization to receive its debt. Here
average collection period is 100% which is not good for the company. Organization needs to
collect all debts as soon as possible.
Fixed asset turnover
It is a ratio of net sales to fixed. It usually measures an organization’s capacity to
generate net sales from fixed assets.
Presenting report to Gulf Banks PLC regarding recommendation for loan sanction.
To,
the general manager
Gulf bank Plc
Subject: suggestion regarding the sanction of the loan
J.P. Robard Mfg. Wants to take a loan to recover its financial needs. By observing all the
financial statements of an organization, it is said that it is suffering losses. Analyzing all the
ratio, it is concluded that reason behind all the deficiencies is the debt ratio which has reached to
100 % of debt financing leveraged it its capital structure (Kim Schmidgall, and Damitio, 2017. ).
The company is not in a position to recover its borrowings because of maximization of debt
burden. Hence, it is recommended not to sanction the loan to safe guard bank interest.
C) Interpretation of ratio regarding the investment in the company and recommendation to
investors
To,
the investors
J.P. Robard mfg. Company
Subject: recommendation for the investment.
From analyzing the ratio, it is concluded that financial position is good. The statements
showing that organization has earned good profit and return are also high as compared to the
industrial average. The investors should do the investment by observing the profitability and
investment ratio of an organization. It is said that organization is wisely using the investment
done by the shareholders in order to increase the financial position of the company (Umeji, and
Obi, 2014). By seeking all the records of the company it is recommended to the investor to invest
their money in the firm for higher returns and dividend.
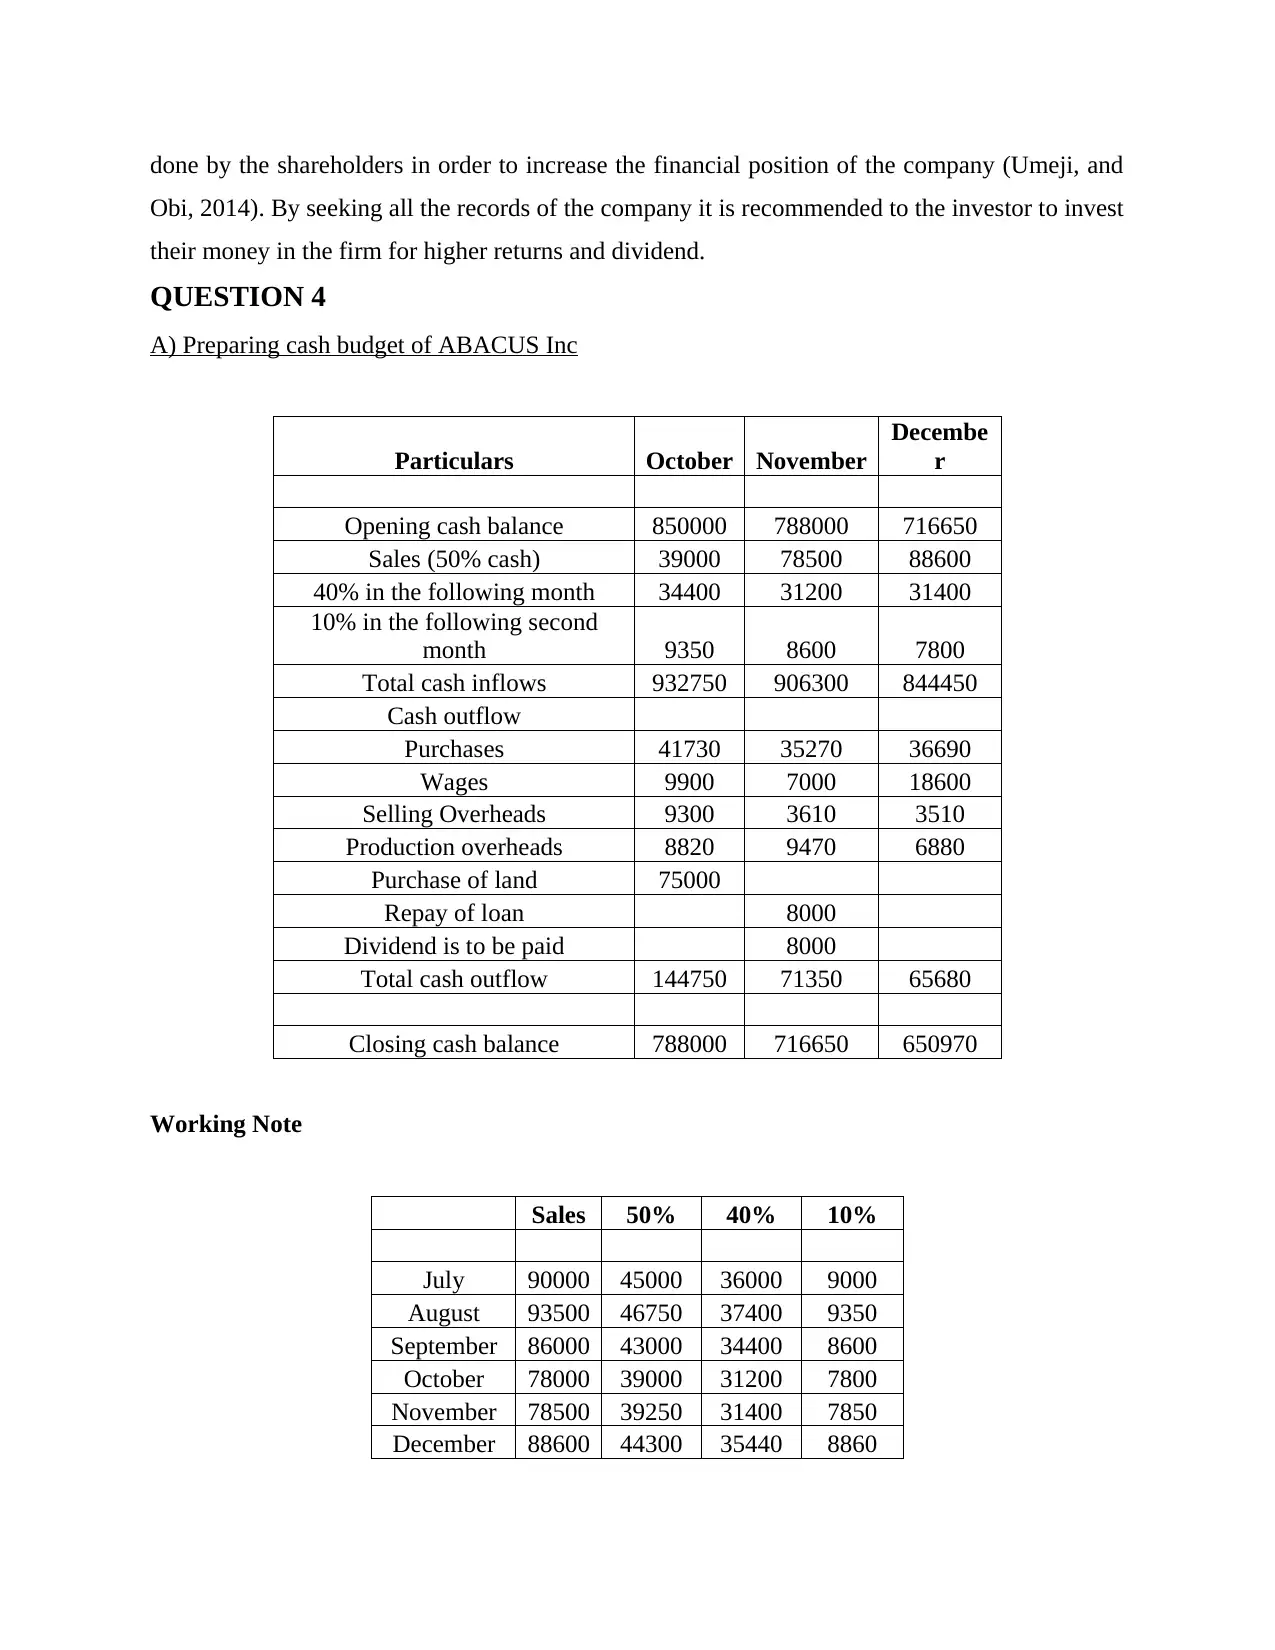
QUESTION 4
A) Preparing cash budget of ABACUS Inc
Particulars October November
Decembe
r
Opening cash balance 850000 788000 716650
Sales (50% cash) 39000 78500 88600
40% in the following month 34400 31200 31400
10% in the following second
month 9350 8600 7800
Total cash inflows 932750 906300 844450
Cash outflow
Purchases 41730 35270 36690
Wages 9900 7000 18600
Selling Overheads 9300 3610 3510
Production overheads 8820 9470 6880
Purchase of land 75000
Repay of loan 8000
Dividend is to be paid 8000
Total cash outflow 144750 71350 65680
Closing cash balance 788000 716650 650970
Working Note
Sales 50% 40% 10%
July 90000 45000 36000 9000
August 93500 46750 37400 9350
September 86000 43000 34400 8600
October 78000 39000 31200 7800
November 78500 39250 31400 7850
December 88600 44300 35440 8860
Obi, 2014). By seeking all the records of the company it is recommended to the investor to invest
their money in the firm for higher returns and dividend.
QUESTION 4
A) Preparing cash budget of ABACUS Inc
Particulars October November
Decembe
r
Opening cash balance 850000 788000 716650
Sales (50% cash) 39000 78500 88600
40% in the following month 34400 31200 31400
10% in the following second
month 9350 8600 7800
Total cash inflows 932750 906300 844450
Cash outflow
Purchases 41730 35270 36690
Wages 9900 7000 18600
Selling Overheads 9300 3610 3510
Production overheads 8820 9470 6880
Purchase of land 75000
Repay of loan 8000
Dividend is to be paid 8000
Total cash outflow 144750 71350 65680
Closing cash balance 788000 716650 650970
Working Note
Sales 50% 40% 10%
July 90000 45000 36000 9000
August 93500 46750 37400 9350
September 86000 43000 34400 8600
October 78000 39000 31200 7800
November 78500 39250 31400 7850
December 88600 44300 35440 8860
⊘ This is a preview!⊘
Do you want full access?
Subscribe today to unlock all pages.
Trusted by 1+ million students worldwide
1 out of 17
Related Documents


Your All-in-One AI-Powered Toolkit for Academic Success.
+13062052269
info@desklib.com
Available 24*7 on WhatsApp / Email
![[object Object]](/_next/static/media/star-bottom.7253800d.svg)
Unlock your academic potential
Copyright © 2020–2026 A2Z Services. All Rights Reserved. Developed and managed by ZUCOL.