Accounting and Statistics: Procter & Gamble Financial Report Analysis

Verified

Added on  2020/04/15

|6
|1042
|129
Report
AI Summary
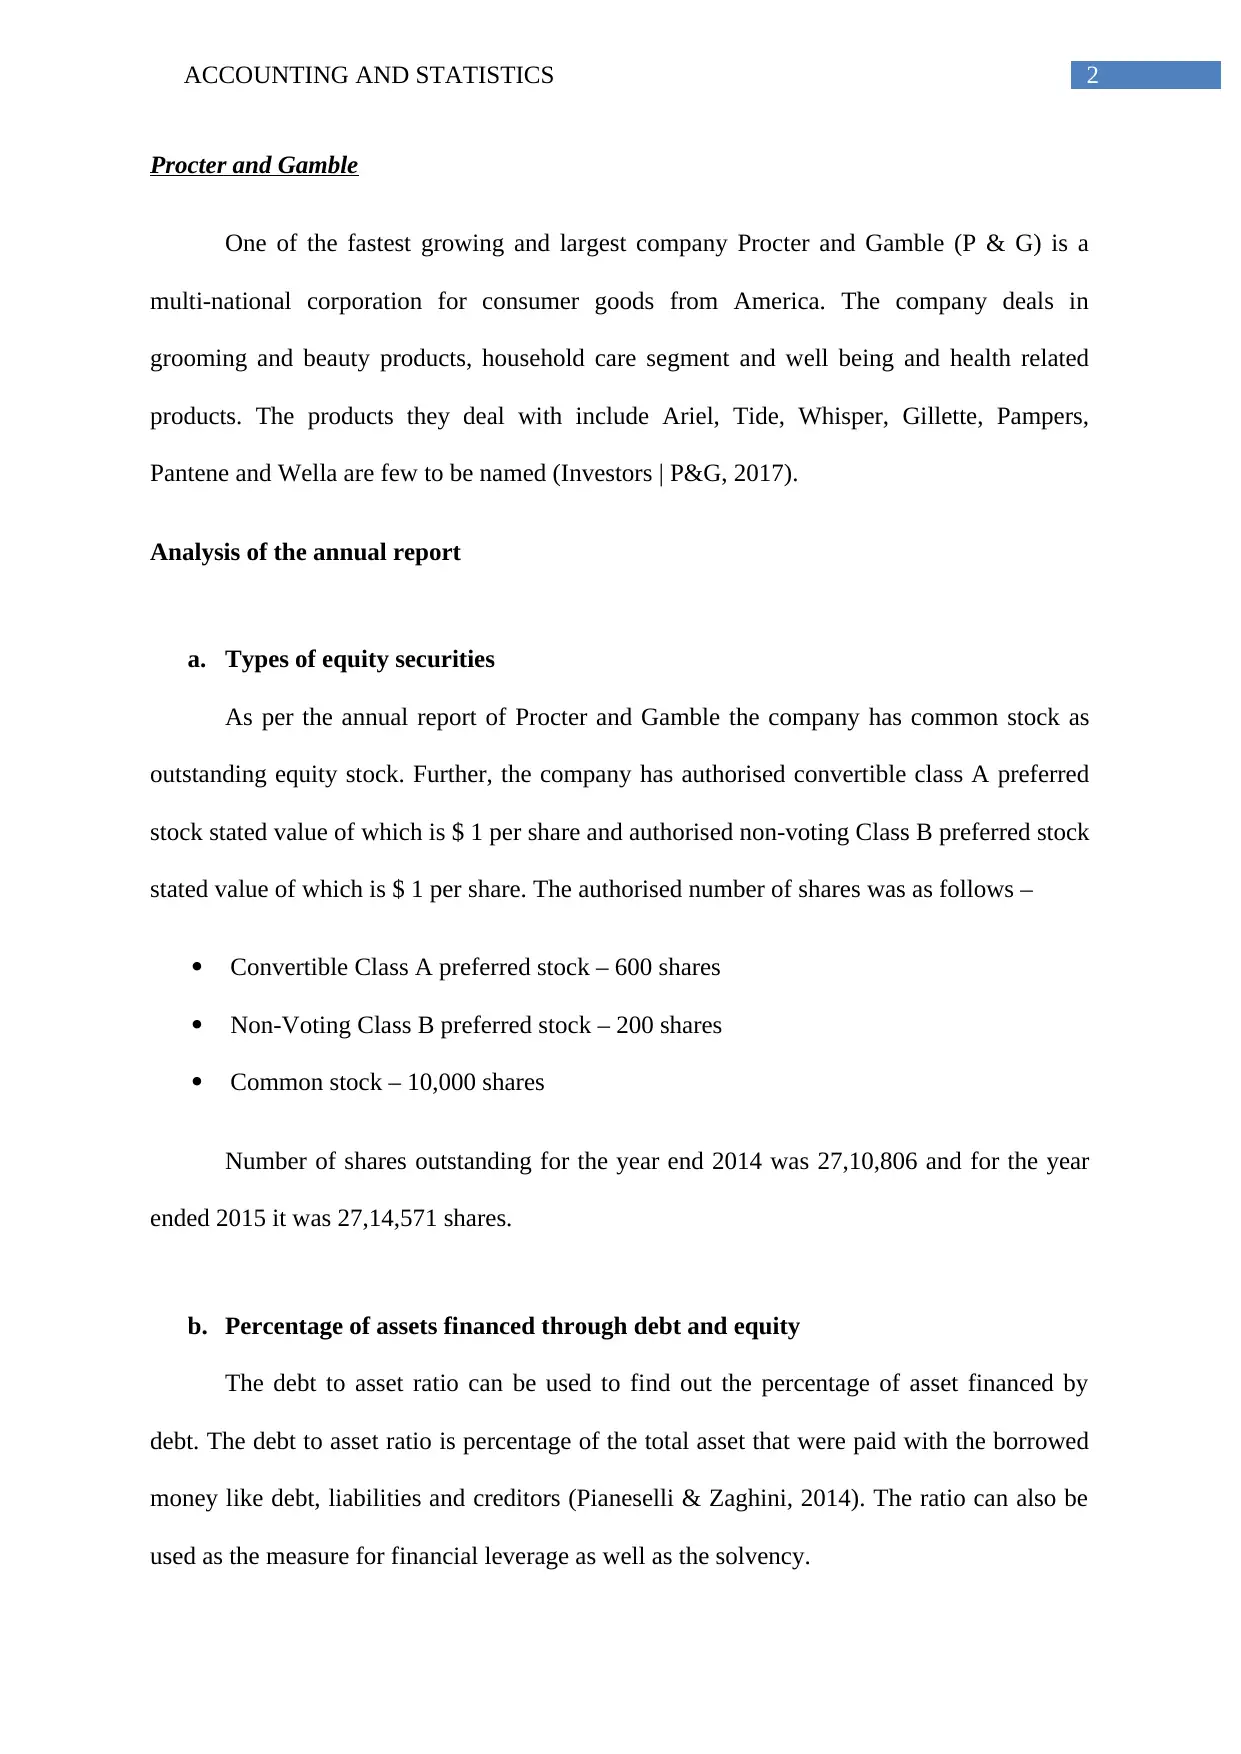
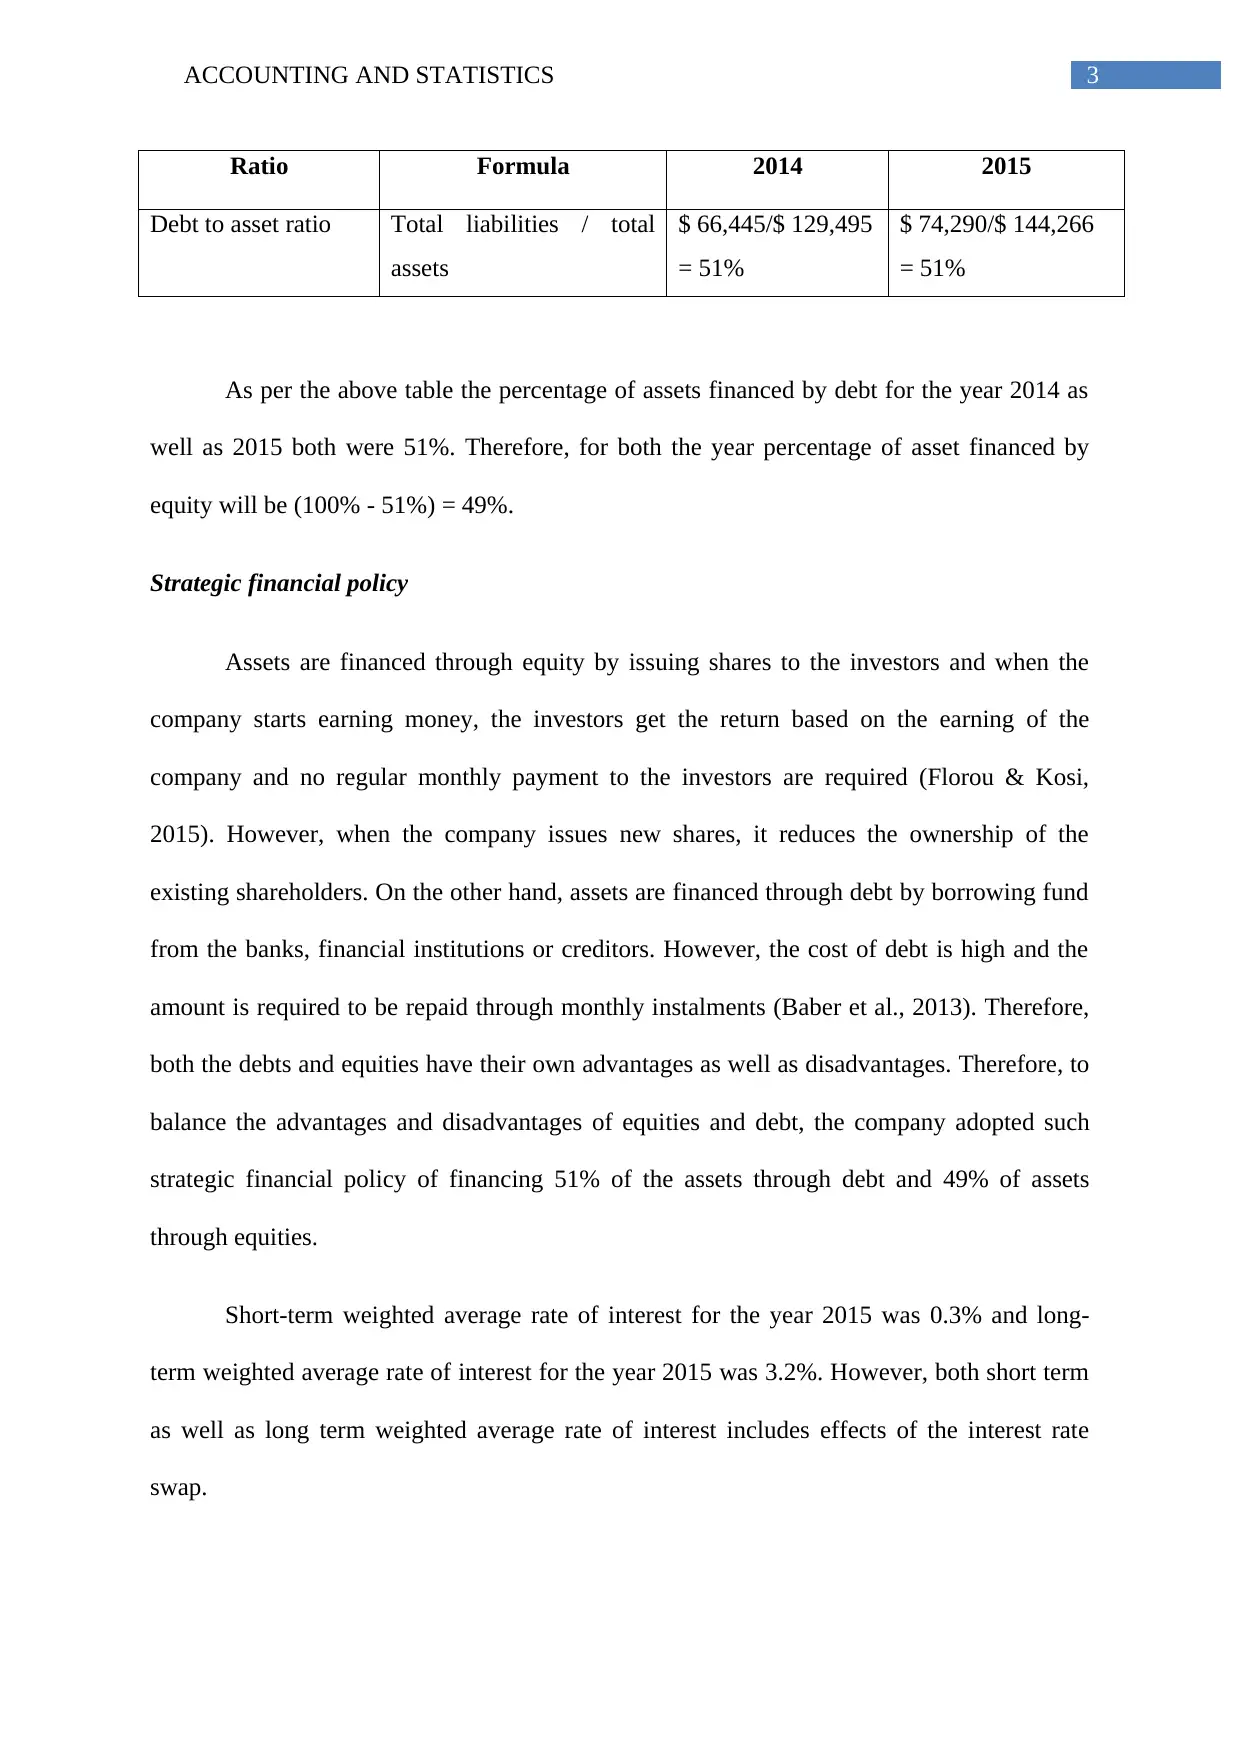
This report provides an analysis of Procter & Gamble's (P&G) financial performance. It examines the types of equity securities, including common and preferred stock, as well as the company's debt-to-asset ratio, which remained at 51% for 2014 and 2015. The report also discusses P&G's strategic financial policy of financing assets through a combination of debt and equity, highlighting the advantages and disadvantages of each. Furthermore, it details the repurchase of common shares in 2015 and the allocation of common shares under the employee stock option plan. The report references key financial data from P&G's annual report and relevant academic research to support its findings.
tabler-icon-diamond-filled.svg

Contribute Materials

Your contribution can guide someone’s learning journey. Share your documents today.
Document Page
Running head: ACCOUNTING AND STATISTICS
Accounting and statistics
Name of the students
Name of the university
Author note
tabler-icon-diamond-filled.svg

Secure Best Marks with AI Grader

Need help grading? Try our AI Grader for instant feedback on your assignments.
Document Page
1ACCOUNTING AND STATISTICS
Table of Contents
a. Types of equity securities...................................................................................................2
b. Percentage of assets financed through debt and equity......................................................2
c. Repurchase of common shares...........................................................................................4
d. Common share allocated under employee stock option.....................................................4
References..................................................................................................................................5
Document Page
2ACCOUNTING AND STATISTICS
Procter and Gamble
One of the fastest growing and largest company Procter and Gamble (P & G) is a
multi-national corporation for consumer goods from America. The company deals in
grooming and beauty products, household care segment and well being and health related
products. The products they deal with include Ariel, Tide, Whisper, Gillette, Pampers,
Pantene and Wella are few to be named (Investors | P&G, 2017).
Analysis of the annual report
a. Types of equity securities
As per the annual report of Procter and Gamble the company has common stock as
outstanding equity stock. Further, the company has authorised convertible class A preferred
stock stated value of which is $ 1 per share and authorised non-voting Class B preferred stock
stated value of which is $ 1 per share. The authorised number of shares was as follows –
Convertible Class A preferred stock – 600 shares
Non-Voting Class B preferred stock – 200 shares
Common stock – 10,000 shares
Number of shares outstanding for the year end 2014 was 27,10,806 and for the year
ended 2015 it was 27,14,571 shares.
b. Percentage of assets financed through debt and equity
The debt to asset ratio can be used to find out the percentage of asset financed by
debt. The debt to asset ratio is percentage of the total asset that were paid with the borrowed
money like debt, liabilities and creditors (Pianeselli & Zaghini, 2014). The ratio can also be
used as the measure for financial leverage as well as the solvency.
Document Page
3ACCOUNTING AND STATISTICS
Ratio Formula 2014 2015
Debt to asset ratio Total liabilities / total
assets
$ 66,445/$ 129,495
= 51%
$ 74,290/$ 144,266
= 51%
As per the above table the percentage of assets financed by debt for the year 2014 as
well as 2015 both were 51%. Therefore, for both the year percentage of asset financed by
equity will be (100% - 51%) = 49%.
Strategic financial policy
Assets are financed through equity by issuing shares to the investors and when the
company starts earning money, the investors get the return based on the earning of the
company and no regular monthly payment to the investors are required (Florou & Kosi,
2015). However, when the company issues new shares, it reduces the ownership of the
existing shareholders. On the other hand, assets are financed through debt by borrowing fund
from the banks, financial institutions or creditors. However, the cost of debt is high and the
amount is required to be repaid through monthly instalments (Baber et al., 2013). Therefore,
both the debts and equities have their own advantages as well as disadvantages. Therefore, to
balance the advantages and disadvantages of equities and debt, the company adopted such
strategic financial policy of financing 51% of the assets through debt and 49% of assets
through equities.
Short-term weighted average rate of interest for the year 2015 was 0.3% and long-
term weighted average rate of interest for the year 2015 was 3.2%. However, both short term
as well as long term weighted average rate of interest includes effects of the interest rate
swap.
tabler-icon-diamond-filled.svg

Secure Best Marks with AI Grader

Need help grading? Try our AI Grader for instant feedback on your assignments.
Document Page
4ACCOUNTING AND STATISTICS
c. Repurchase of common shares
During the year 2015, 44,20,851 shares were repurchased by the company as part of
the publicly announced programs or plans. Average price paid for each share was $ 79.17 and
therefore, the aggregate price paid was (44,20,851 * $ 79.17) = $ 34,99,98,773.67.
d. Common share allocated under employee stock option
Numbers of common shares allocated to the employees under the P&G employee
stock option plan for the year 2015 were as follows –
Total series A shares outstanding as on 30th June were 49,272, out of which 42,044
were allocated and 7,288 were unallocated.
Total series B shares outstanding as on 30th June were 57,170, out of which 23,074
were allocated and 34,096 were unallocated.
If the employee stock option were valued as per the fair value method, it will take into
consideration the earning at lower amount which in turn will reduce both the basic EPS as
well as diluted EPS (Heikal, Khaddafi & Ummah, 2014).
Document Page
5ACCOUNTING AND STATISTICS
References
Baber, W. R., Gore, A. K., Rich, K. T., & Zhang, J. X. (2013). Accounting restatements,
governance and municipal debt financing. Journal of Accounting and
Economics, 56(2), 212-227.
Florou, A., & Kosi, U. (2015). Does mandatory IFRS adoption facilitate debt
financing?. Review of Accounting Studies, 20(4), 1407-1456.
Heikal, M., Khaddafi, M., & Ummah, A. (2014). Influence analysis of return on assets
(ROA), return on equity (ROE), net profit margin (NPM), debt to equity ratio (DER),
and current ratio (CR), against corporate profit growth in automotive in Indonesia
stock exchange. International Journal of Academic Research in Business and Social
Sciences, 4(12), 101.
Investors | P&G. (2017). Pginvestor.com. Retrieved 22 November 2017, from
http://pginvestor.com/
Pianeselli, D., & Zaghini, A. (2014). The cost of firms’ debt financing and the global
financial crisis. Finance Research Letters, 11(2), 74-83.
chevron_up_icon
1 out of 6
circle_padding
hide_on_mobile
zoom_out_icon
logo.png

Your All-in-One AI-Powered Toolkit for Academic Success.

Available 24*7 on WhatsApp / Email

[object Object]