ACC1AIS: Financial Statement Analysis of Chaudhry Asad Company

Verified

Added on  2023/06/11

|10
|1424
|291
Practical Assignment
AI Summary
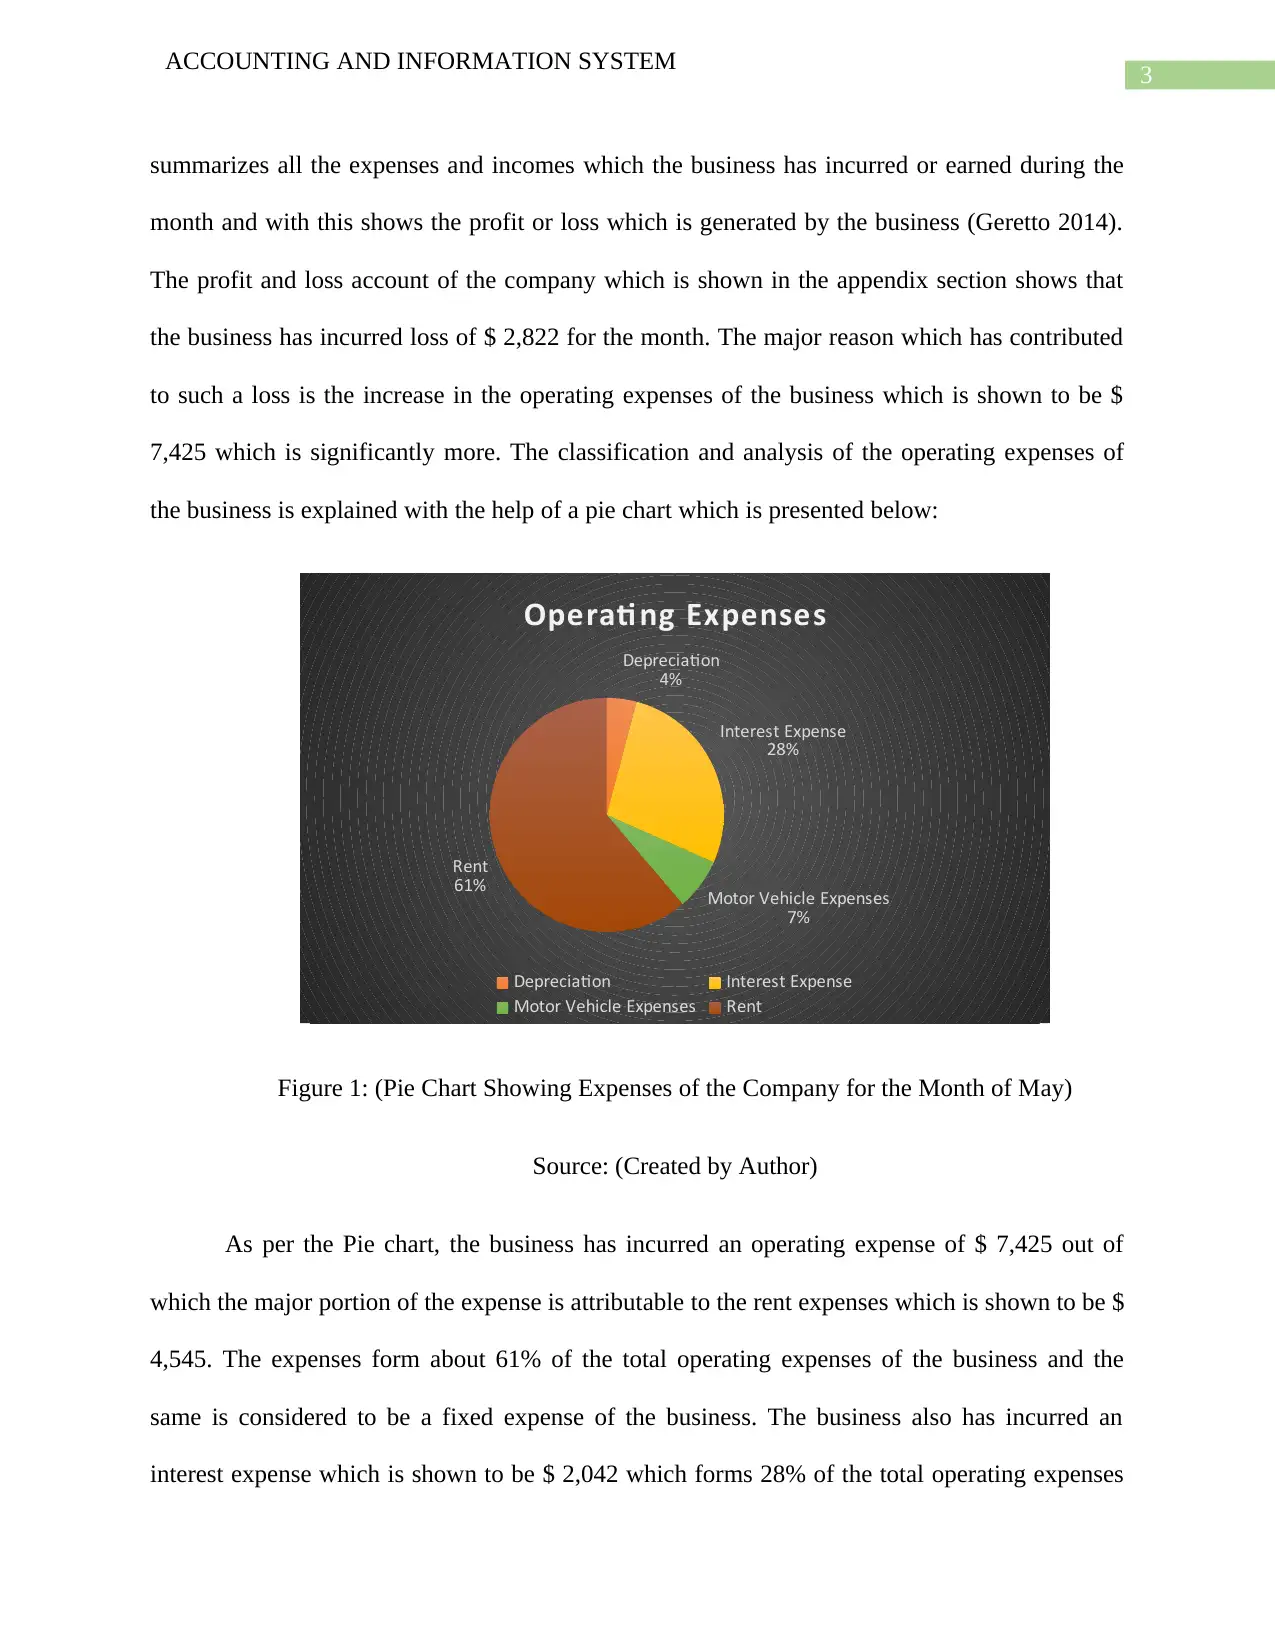
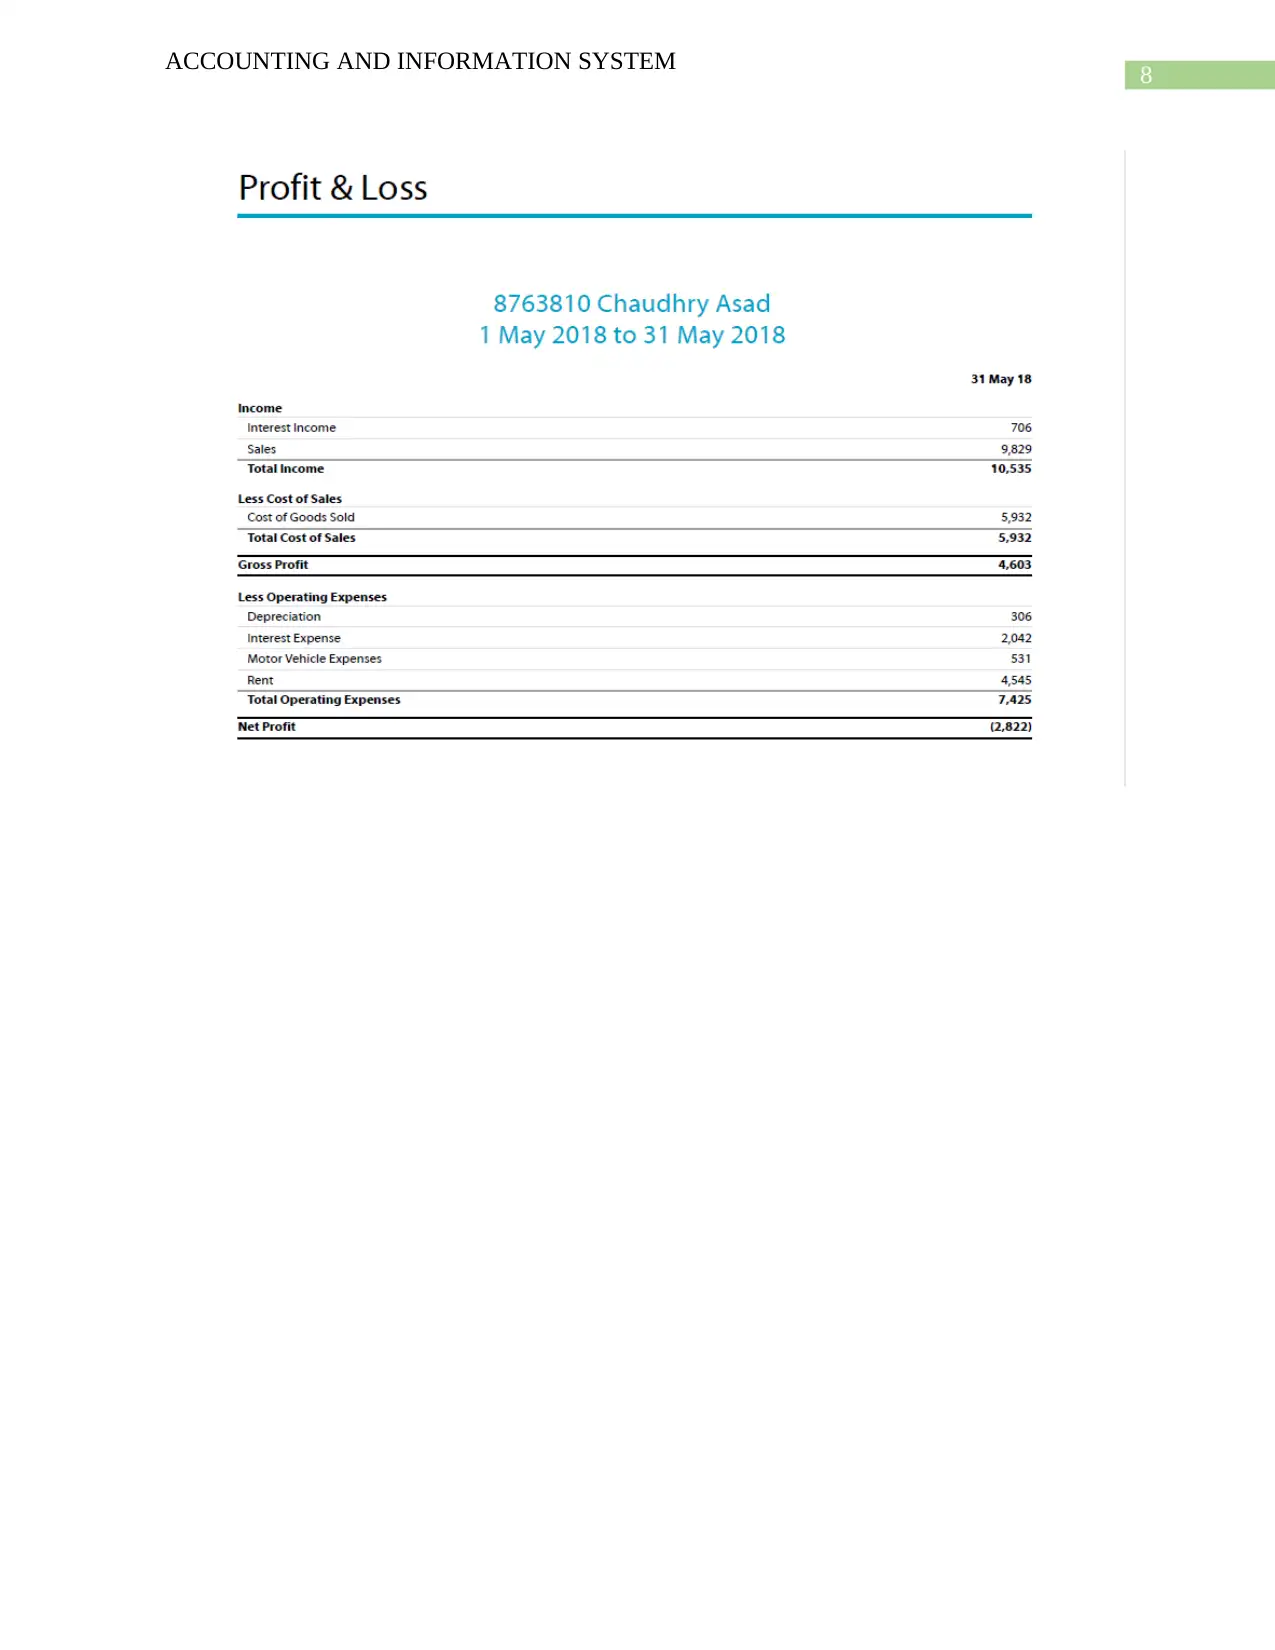
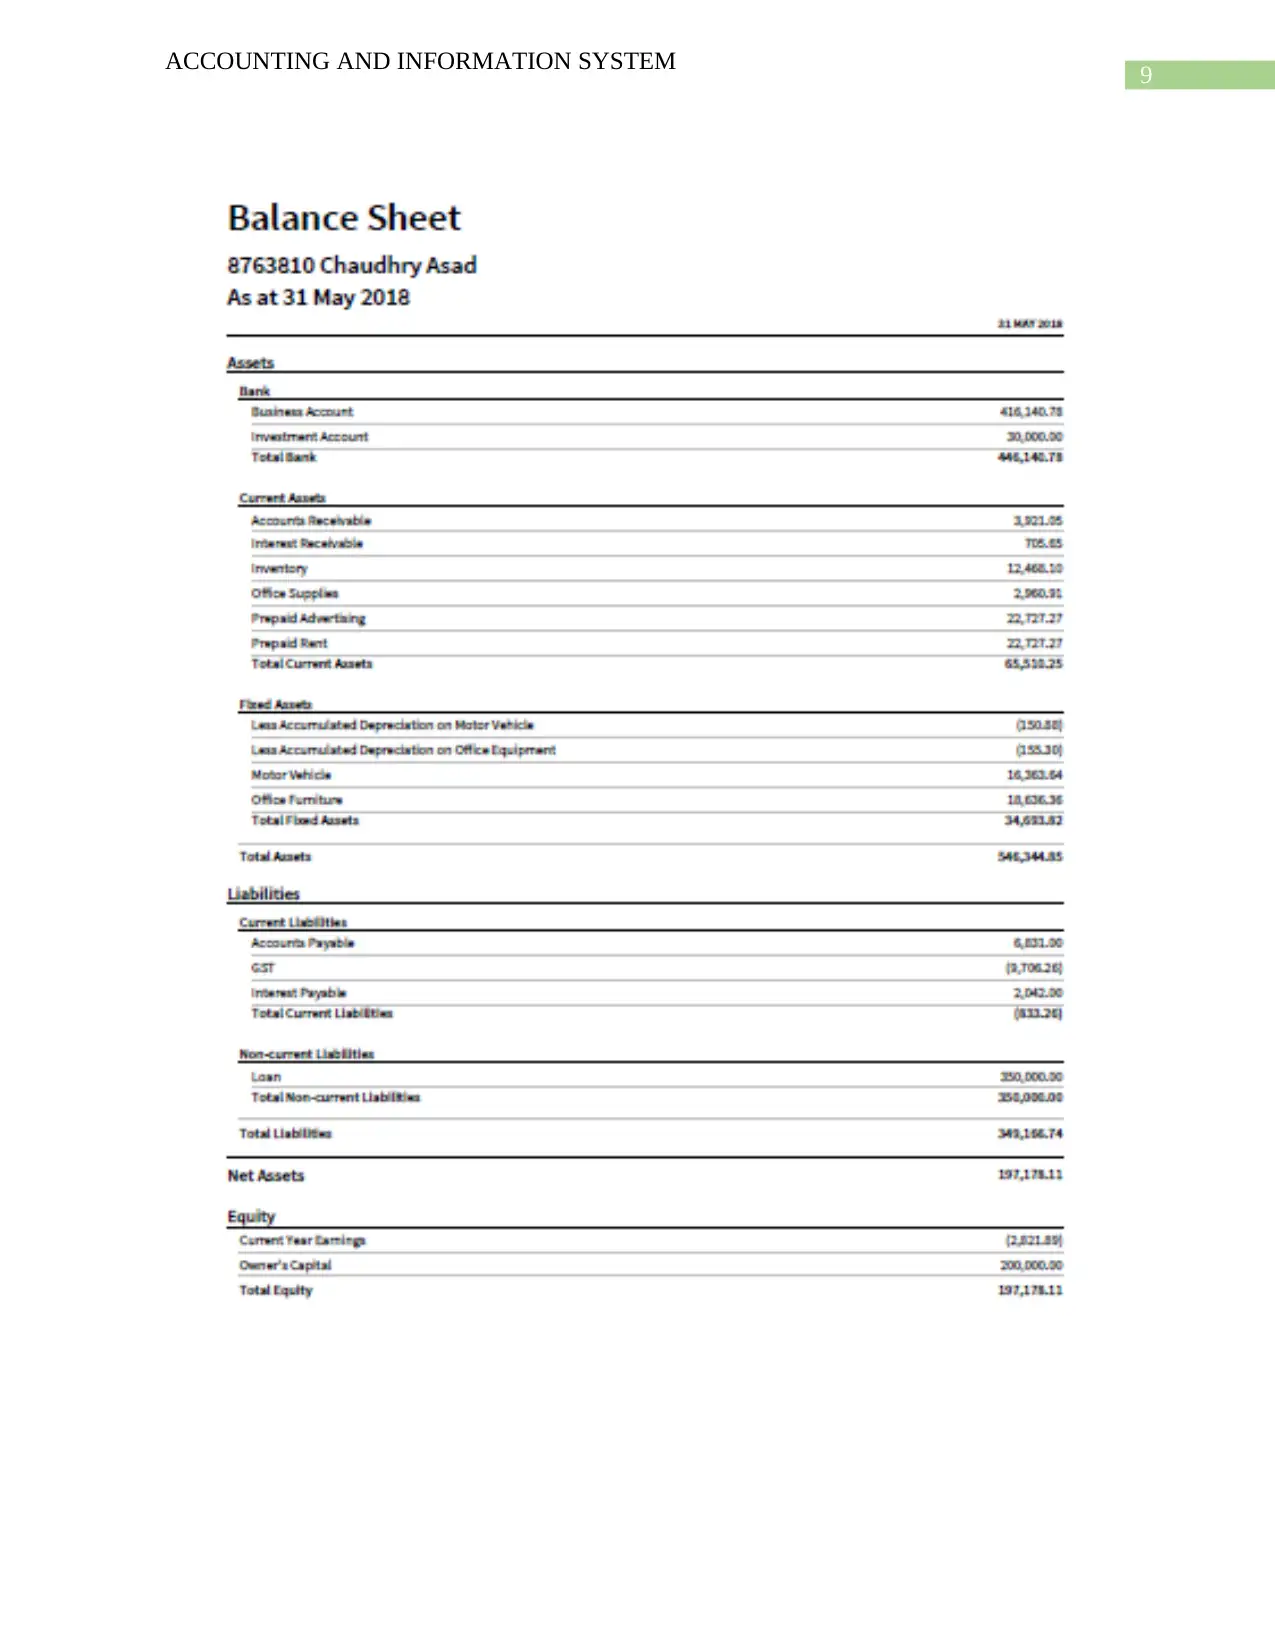
This report analyzes the financial statements of Chaudhry Asad Company, a business engaged in trading socks, for the month of May 2018. The analysis includes a review of the trial balance, profit and loss account, and balance sheet. The company incurred a loss of $2,822, primarily due to high operating expenses, particularly rent and interest. The balance sheet reveals significant liquid assets and details the composition of current assets and liabilities. The assignment uses charts and diagrams to illustrate expense classifications and asset distributions. Desklib provides a platform for students to access this and other solved assignments for academic support.
Document Page
Running head: ACCOUNTING AND INFORMATION SYSTEM
Accounting and Information System
Name of the Student:
Name of the University:
Author’s Note:
tabler-icon-diamond-filled.svg

Secure Best Marks with AI Grader

Need help grading? Try our AI Grader for instant feedback on your assignments.
Document Page
1
ACCOUNTING AND INFORMATION SYSTEM
Table of Contents
Introduction......................................................................................................................................2
Analysis of Financial Statements.....................................................................................................2
Reference.........................................................................................................................................6
Appendix..........................................................................................................................................7
Document Page
2
ACCOUNTING AND INFORMATION SYSTEM
Introduction
The report which is being prepared for Chaudhry Asad Company which will be analyzing the
financial statement which the company has prepared for the purpose of better understanding of
the items which are shown in the financial statements. The transactions which are undertaken by
the business mostly related to the general functioning of the business. The company is engaged
in trading of socks. The transactions are passed as journal for the purpose of recording the same
in the books of accounts of the business. The financial statements of the Chaudhry Asad
Company are presented in the appendix section which is shown below.
Analysis of Financial Statements
The business has prepared a trial balance which shows all the transactions which the
business incurs during the month of May. The trial balance is used for checking the numerical
accuracy of the trial balance. The debit side and the credit side total of the trial balance should
match in order to show that the financial statements which are being prepared are free from
errors ion calculations (Lawrence 2013). The trial balance as prepared by the business shows that
the company has generated sales of $ 9,829 during the month and the cost of good sold is shown
to be $ 5,932which is directly associated with the production of goods which is being sold by the
business. In addition to this, the trial balance shows the collection of all items which the business
has or transacted during the month of May which includes assets, liabilities, owner’s capital,
income and expenses of the business. The trial balance of the company matches which is shown
to be $ 566,660 and the same is shown in the appendix section.
The profit and loss account of the business shows the profit which the business is able to
generate during the month (Zhang and Andrew 2014). The profit and loss account of the business
Document Page
3
ACCOUNTING AND INFORMATION SYSTEM
summarizes all the expenses and incomes which the business has incurred or earned during the
month and with this shows the profit or loss which is generated by the business (Geretto 2014).
The profit and loss account of the company which is shown in the appendix section shows that
the business has incurred loss of $ 2,822 for the month. The major reason which has contributed
to such a loss is the increase in the operating expenses of the business which is shown to be $
7,425 which is significantly more. The classification and analysis of the operating expenses of
the business is explained with the help of a pie chart which is presented below:
Depreciation
4%
Interest Expense
28%
Motor Vehicle Expenses
7%
Rent
61%
Operati ng Expenses
Depreciation Interest Expense
Motor Vehicle Expenses Rent
Figure 1: (Pie Chart Showing Expenses of the Company for the Month of May)
Source: (Created by Author)
As per the Pie chart, the business has incurred an operating expense of $ 7,425 out of
which the major portion of the expense is attributable to the rent expenses which is shown to be $
4,545. The expenses form about 61% of the total operating expenses of the business and the
same is considered to be a fixed expense of the business. The business also has incurred an
interest expense which is shown to be $ 2,042 which forms 28% of the total operating expenses
tabler-icon-diamond-filled.svg

Secure Best Marks with AI Grader

Need help grading? Try our AI Grader for instant feedback on your assignments.
Document Page
4
ACCOUNTING AND INFORMATION SYSTEM
of the business. The interest expense of the business is attributable to the loan which is taken and
shown by the business in the balance sheet of the business. The other expenses which the
business incurs are depreciation expenses and Motor vehicle expenses. The depreciation
expenses occur due to the natural wear and tear of the asset which the business possesses.
Depreciation expense is one of the non-cash expense of the business. The Motor vehicle
expenses of the company is related to the maintenance of the motor vehicles of the business. The
expenses relating to motor vehicles and depreciation is shown as $ 531 and $ 306 respectively.
The Balance sheet of the company is prepared by the business to display the financial
position of the business for the period. In this case, the balance sheet is prepared considering a
period of one month (Kapan and Minoiu 2013). The balance sheet shows all the assets which the
business possesses during the end of the period. The balance sheet of the company shows that the
most liquid assets of the business comprise of Bank balance and investments which the business
possesses. The bank balance is shown to be $ 416,140.78 which is a significant amount which is
included in the statement. This represent liquid cash which the management of the company can
use for any purpose they like. The total of the liquid assets of the business is shown to be $
446,140.78 as per the balance sheet which is shown in the appendix section. The current assets of
the business also represent the liquid assets of the business which includes inventory, account
receivables (Aysun and Hepp 2013). The classification of the current assets is shown with the
help of Bar diagram which is shown below:
Document Page
5
ACCOUNTING AND INFORMATION SYSTEM
Accounts
Receivable Interest
Receivable Inventory Office
Supplies Prepaid
Advertising Prepaid Rent
3921.05
705.65
12468.1
2960.91
22727.27 22727.27
Current Assets
Figure 2: (Chart Showing Current Assets of the Company for the Month of May)
Source: (Created by Author)
As per the graph which is depicted above, the current assets of the business are made up
of account receivables, interest receivables, inventory, office supplies, prepaid advertisement and
prepaid rent. The major portion of the current asset is made up of the prepaid expenses which are
prepaid advertisement and prepaid rent which is both of the same amount as $ 22,727.27. The
inventory of the business also forms a significant part of the current assets of the business and
the same is shown as $ 12,468.10. The current liabilities of the business are shown to be $ 833.26
which is shown in negative. A major portion of the liabilities of the business is made up of loan
which is shown to be $ 3,50,000 (Ghent and Valkanov 2015). The asset and equity and liabilities
side matches when summation is done which means the balance sheet is effective prepared
following the double entry principle of accounting. The total equity of the business is shown to
be $ 197,178.11.
Document Page
6
ACCOUNTING AND INFORMATION SYSTEM
Reference
Aysun, U. and Hepp, R., 2013. Identifying the balance sheet and the lending channels of
monetary transmission: A loan-level analysis. Journal of banking & Finance, 37(8), pp.2812-
2822.
Geretto, E., 2014. Liquidity Regulatory Framework of Basel III: A Simulation Model for
Balance Sheets and Profit and Loss Accounts. IUP Journal of Financial Risk
Management, 11(1), p.7.
Ghent, A. and Valkanov, R., 2015. Comparing securitized and balance sheet loans: size
matters. Management Science, 62(10), pp.2784-2803.
Kapan, M.T. and Minoiu, C., 2013. Balance sheet strength and bank lending during the global
financial crisis (No. 13-102). International Monetary Fund.
Lawrence, A., 2013. Individual investors and financial disclosure. Journal of Accounting and
Economics, 56(1), pp.130-147.
Zhang, Y. and Andrew, J., 2014. Financialisation and the conceptual framework. Critical
perspectives on accounting, 25(1), pp.17-26.
tabler-icon-diamond-filled.svg

Paraphrase This Document

Need a fresh take? Get an instant paraphrase of this document with our AI Paraphraser
Document Page
7
ACCOUNTING AND INFORMATION SYSTEM
Appendix
Document Page
8
ACCOUNTING AND INFORMATION SYSTEM
Document Page
9
ACCOUNTING AND INFORMATION SYSTEM
chevron_up_icon
1 out of 10
circle_padding
hide_on_mobile
zoom_out_icon
logo.png

Your All-in-One AI-Powered Toolkit for Academic Success.

Available 24*7 on WhatsApp / Email

[object Object]