Detailed Analysis: Accounting System and Processes Project Report
VerifiedAdded on 2023/06/05
|16
|2451
|454
Project
AI Summary
This project report provides a comprehensive analysis of accounting systems and processes. Part A explores the use of spreadsheets in accounting, including IF functions, negative number formatting, and cell referencing. Part B delves into inventory management, comparing perpetual and periodic systems, and evaluating the cost of goods sold using FIFO, LIFO, and weighted average methods. Part C examines bank reconciliation statements, detailing debit and credit balances and journal entries. Finally, Part D addresses bad debt management, analyzing various methods and applying financial analysis to Coca-Cola Amatil Limited, including profitability, liquidity, and market ratios, along with sustainability analysis and investment recommendations. The report concludes with references and an appendix containing ratio calculations.
Running Head: Accounting system and processes
1
Project Report: Accounting system and processes
1
Project Report: Accounting system and processes
Paraphrase This Document
Need a fresh take? Get an instant paraphrase of this document with our AI Paraphraser
Accounting system and processes 2
Contents
Part A: Spreadsheet...........................................................................................................4
a. Spreadsheet..........................................................................................................4
b. Separation of data report and spreadsheet............................................................4
c. Spreadsheet example............................................................................................4
i. IF function............................................................................................................4
ii. Negative number in brackets................................................................................5
iii. Naming reference cells.........................................................................................5
Part B: Inventory management.........................................................................................6
Introduction...................................................................................................................6
Perpetual and periodic inventory system......................................................................6
Cost of goods sold and profit level...............................................................................6
Suggestions and Conclusion.........................................................................................7
Part c: Bank reconciliation statement...............................................................................8
a. Debit and credit balance:......................................................................................8
b. Bank reconciliation statement..............................................................................8
c. Journal entries......................................................................................................9
Part D: Bad debt management and financial decision....................................................10
Introduction.................................................................................................................10
Bad debt method.........................................................................................................10
Various bad debt methods..........................................................................................11
Financial analysis........................................................................................................11
Sustainability analysis................................................................................................13
Recommendation and conclusion...............................................................................13
Accounting system and processes 3
References.......................................................................................................................14
Appendix.........................................................................................................................15
References.......................................................................................................................14
Appendix.........................................................................................................................15
⊘ This is a preview!⊘
Do you want full access?
Subscribe today to unlock all pages.
Trusted by 1+ million students worldwide
Accounting system and processes 4
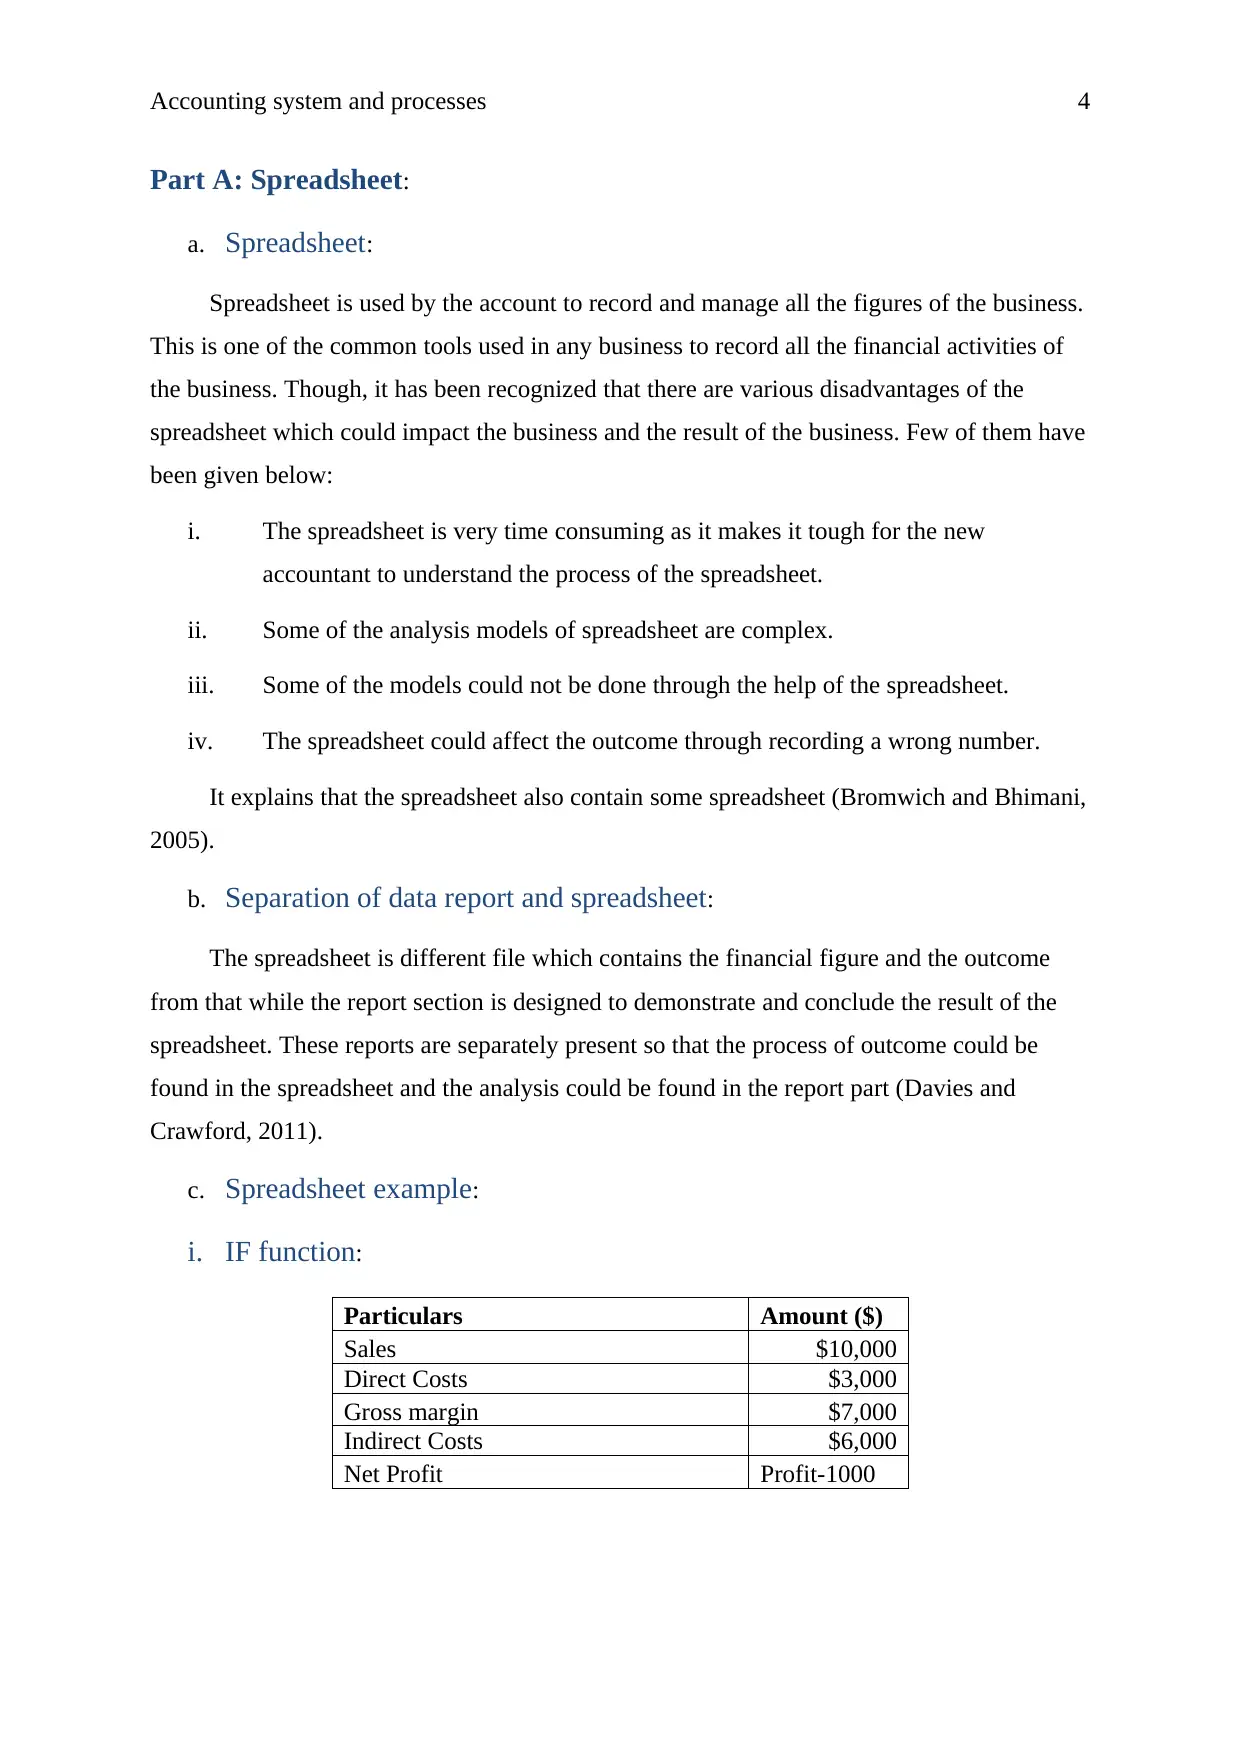
Part A: Spreadsheet:
a. Spreadsheet:
Spreadsheet is used by the account to record and manage all the figures of the business.
This is one of the common tools used in any business to record all the financial activities of
the business. Though, it has been recognized that there are various disadvantages of the
spreadsheet which could impact the business and the result of the business. Few of them have
been given below:
i. The spreadsheet is very time consuming as it makes it tough for the new
accountant to understand the process of the spreadsheet.
ii. Some of the analysis models of spreadsheet are complex.
iii. Some of the models could not be done through the help of the spreadsheet.
iv. The spreadsheet could affect the outcome through recording a wrong number.
It explains that the spreadsheet also contain some spreadsheet (Bromwich and Bhimani,
2005).
b. Separation of data report and spreadsheet:
The spreadsheet is different file which contains the financial figure and the outcome
from that while the report section is designed to demonstrate and conclude the result of the
spreadsheet. These reports are separately present so that the process of outcome could be
found in the spreadsheet and the analysis could be found in the report part (Davies and
Crawford, 2011).
c. Spreadsheet example:
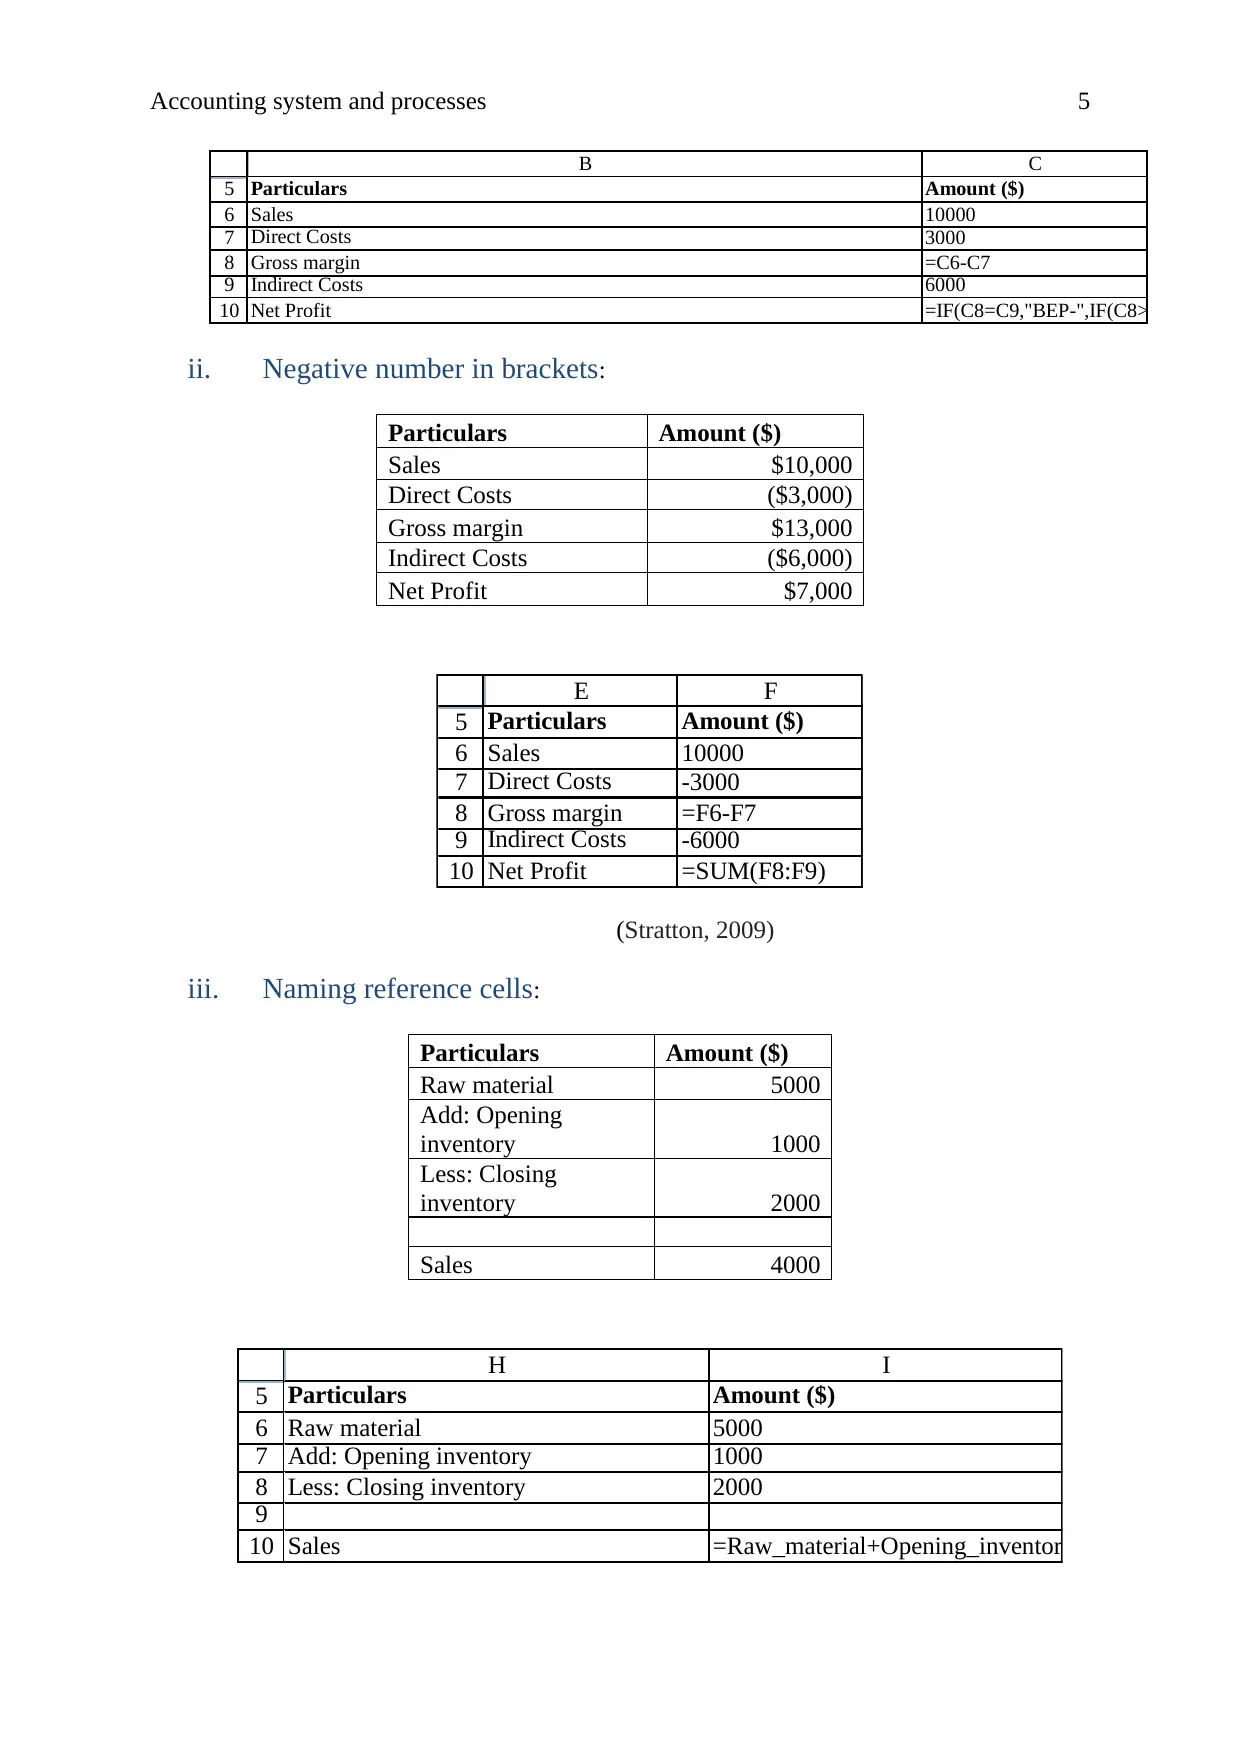
i. IF function:
Particulars Amount ($)
Sales $10,000
Direct Costs $3,000
Gross margin $7,000
Indirect Costs $6,000
Net Profit Profit-1000
Part A: Spreadsheet:
a. Spreadsheet:
Spreadsheet is used by the account to record and manage all the figures of the business.
This is one of the common tools used in any business to record all the financial activities of
the business. Though, it has been recognized that there are various disadvantages of the
spreadsheet which could impact the business and the result of the business. Few of them have
been given below:
i. The spreadsheet is very time consuming as it makes it tough for the new
accountant to understand the process of the spreadsheet.
ii. Some of the analysis models of spreadsheet are complex.
iii. Some of the models could not be done through the help of the spreadsheet.
iv. The spreadsheet could affect the outcome through recording a wrong number.
It explains that the spreadsheet also contain some spreadsheet (Bromwich and Bhimani,
2005).
b. Separation of data report and spreadsheet:
The spreadsheet is different file which contains the financial figure and the outcome
from that while the report section is designed to demonstrate and conclude the result of the
spreadsheet. These reports are separately present so that the process of outcome could be
found in the spreadsheet and the analysis could be found in the report part (Davies and
Crawford, 2011).
c. Spreadsheet example:
i. IF function:
Particulars Amount ($)
Sales $10,000
Direct Costs $3,000
Gross margin $7,000
Indirect Costs $6,000
Net Profit Profit-1000
Paraphrase This Document
Need a fresh take? Get an instant paraphrase of this document with our AI Paraphraser
Accounting system and processes 5
5
6
7
8
9
10
B C
Particulars Amount ($)
Sales 10000
Direct Costs 3000
Gross margin =C6-C7
Indirect Costs 6000
Net Profit =IF(C8=C9,"BEP-",IF(C8>C9,"Profit-"
ii. Negative number in brackets:
Particulars Amount ($)
Sales $10,000
Direct Costs ($3,000)
Gross margin $13,000
Indirect Costs ($6,000)
Net Profit $7,000
5
6
7
8
9
10
E F
Particulars Amount ($)
Sales 10000
Direct Costs -3000
Gross margin =F6-F7
Indirect Costs -6000
Net Profit =SUM(F8:F9)
(Stratton, 2009)
iii. Naming reference cells:
Particulars Amount ($)
Raw material 5000
Add: Opening
inventory 1000
Less: Closing
inventory 2000
Sales 4000
5
6
7
8
9
10
H I
Particulars Amount ($)
Raw material 5000
Add: Opening inventory 1000
Less: Closing inventory 2000
Sales =Raw_material+Opening_inventory-Closing_invento
5
6
7
8
9
10
B C
Particulars Amount ($)
Sales 10000
Direct Costs 3000
Gross margin =C6-C7
Indirect Costs 6000
Net Profit =IF(C8=C9,"BEP-",IF(C8>C9,"Profit-"
ii. Negative number in brackets:
Particulars Amount ($)
Sales $10,000
Direct Costs ($3,000)
Gross margin $13,000
Indirect Costs ($6,000)
Net Profit $7,000
5
6
7
8
9
10
E F
Particulars Amount ($)
Sales 10000
Direct Costs -3000
Gross margin =F6-F7
Indirect Costs -6000
Net Profit =SUM(F8:F9)
(Stratton, 2009)
iii. Naming reference cells:
Particulars Amount ($)
Raw material 5000
Add: Opening
inventory 1000
Less: Closing
inventory 2000
Sales 4000
5
6
7
8
9
10
H I
Particulars Amount ($)
Raw material 5000
Add: Opening inventory 1000
Less: Closing inventory 2000
Sales =Raw_material+Opening_inventory-Closing_invento
Accounting system and processes 6
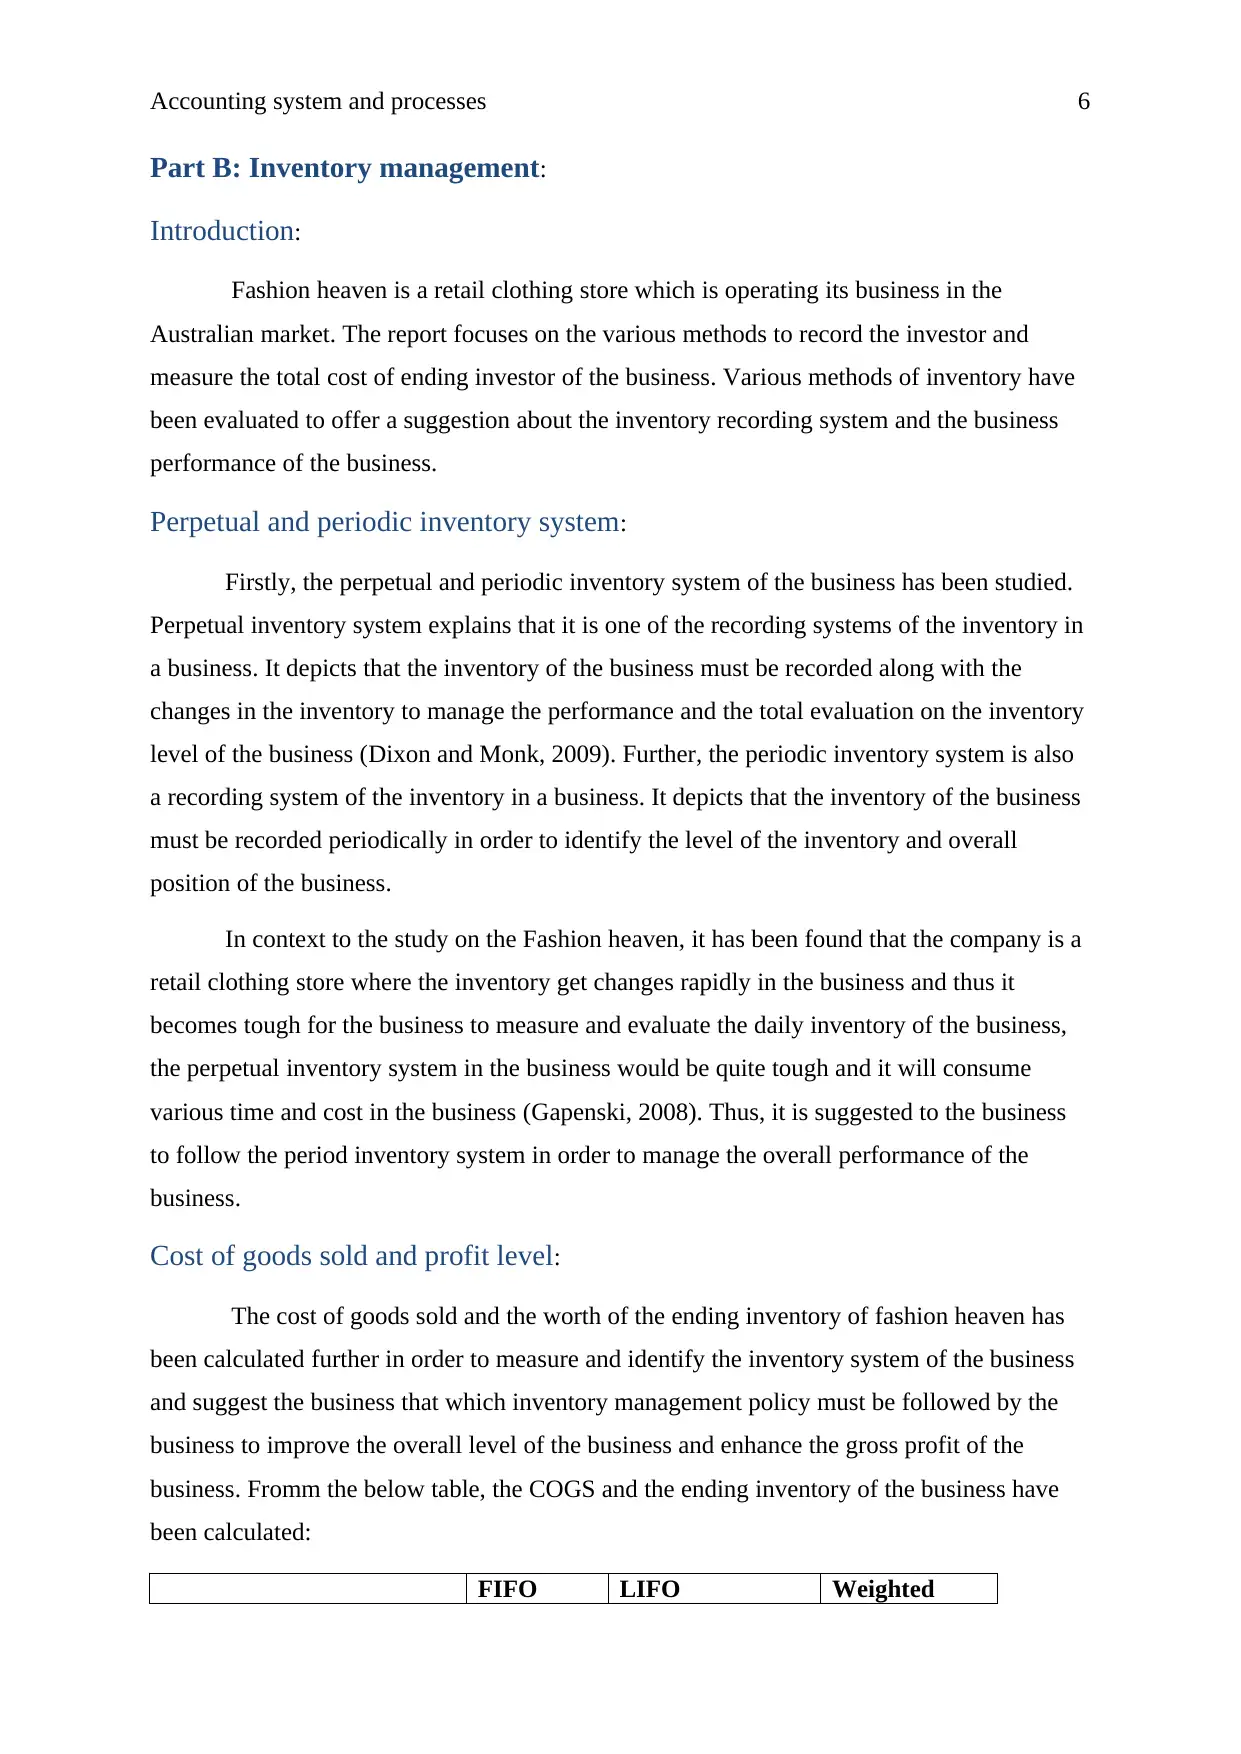
Part B: Inventory management:
Introduction:
Fashion heaven is a retail clothing store which is operating its business in the
Australian market. The report focuses on the various methods to record the investor and
measure the total cost of ending investor of the business. Various methods of inventory have
been evaluated to offer a suggestion about the inventory recording system and the business
performance of the business.
Perpetual and periodic inventory system:
Firstly, the perpetual and periodic inventory system of the business has been studied.
Perpetual inventory system explains that it is one of the recording systems of the inventory in
a business. It depicts that the inventory of the business must be recorded along with the
changes in the inventory to manage the performance and the total evaluation on the inventory
level of the business (Dixon and Monk, 2009). Further, the periodic inventory system is also
a recording system of the inventory in a business. It depicts that the inventory of the business
must be recorded periodically in order to identify the level of the inventory and overall
position of the business.
In context to the study on the Fashion heaven, it has been found that the company is a
retail clothing store where the inventory get changes rapidly in the business and thus it
becomes tough for the business to measure and evaluate the daily inventory of the business,
the perpetual inventory system in the business would be quite tough and it will consume
various time and cost in the business (Gapenski, 2008). Thus, it is suggested to the business
to follow the period inventory system in order to manage the overall performance of the
business.
Cost of goods sold and profit level:
The cost of goods sold and the worth of the ending inventory of fashion heaven has
been calculated further in order to measure and identify the inventory system of the business
and suggest the business that which inventory management policy must be followed by the
business to improve the overall level of the business and enhance the gross profit of the
business. Fromm the below table, the COGS and the ending inventory of the business have
been calculated:
FIFO LIFO Weighted
⊘ This is a preview!⊘
Do you want full access?
Subscribe today to unlock all pages.
Trusted by 1+ million students worldwide
Accounting system and processes 7
average
Opening inventory
$
2,205.00
$
2,205.00
$
2,205.00
Add: Purchase
$
5,290.00
$
5,290.00
$
5,290.00
Cost of goods available for
sale
$
7,495.00
$
7,495.00
$
7,495.00
Ending inventory
$
1,680.00
$
1,520.00
$
1,577.89
Cost of goods sold
$
5,815.00
$
5,975.00
$
5,917.11
15
16
17
18
19
20
F G H I
FIFO LIFO Weighted average
Opening inventory =D16 =G16 =H16
Add: Purchase =SUM(D17:D19) =G17 =H17
Cost of goods available for sale =G16+G17 =H16+H17 =I16+I17
Ending inventory =16*105 =16*95 =(SUM(D16:D19)/(21+5+15+35))*16
Cost of goods sold =G18-G19 =H18-H19 =I18-I19
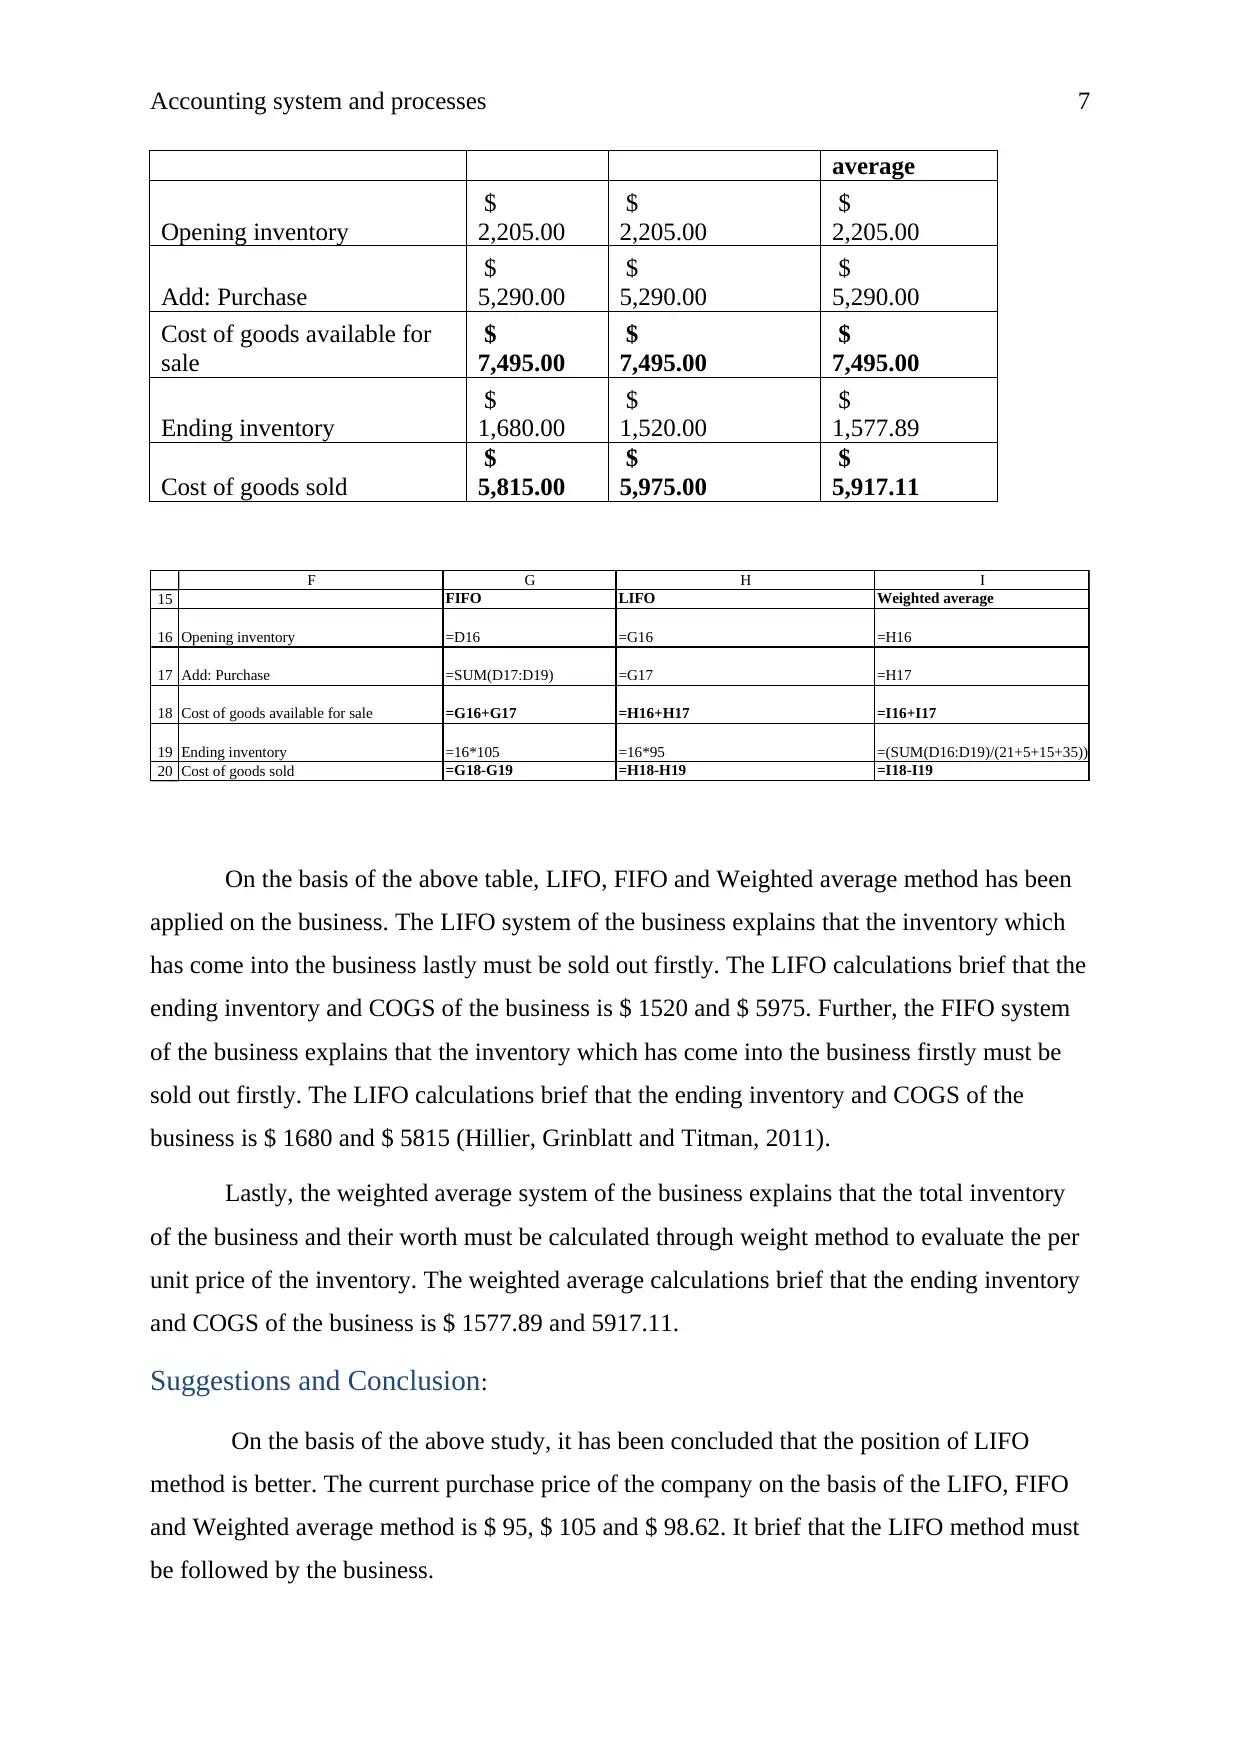
On the basis of the above table, LIFO, FIFO and Weighted average method has been
applied on the business. The LIFO system of the business explains that the inventory which
has come into the business lastly must be sold out firstly. The LIFO calculations brief that the
ending inventory and COGS of the business is $ 1520 and $ 5975. Further, the FIFO system
of the business explains that the inventory which has come into the business firstly must be
sold out firstly. The LIFO calculations brief that the ending inventory and COGS of the
business is $ 1680 and $ 5815 (Hillier, Grinblatt and Titman, 2011).
Lastly, the weighted average system of the business explains that the total inventory
of the business and their worth must be calculated through weight method to evaluate the per
unit price of the inventory. The weighted average calculations brief that the ending inventory
and COGS of the business is $ 1577.89 and 5917.11.
Suggestions and Conclusion:
On the basis of the above study, it has been concluded that the position of LIFO
method is better. The current purchase price of the company on the basis of the LIFO, FIFO
and Weighted average method is $ 95, $ 105 and $ 98.62. It brief that the LIFO method must
be followed by the business.
average
Opening inventory
$
2,205.00
$
2,205.00
$
2,205.00
Add: Purchase
$
5,290.00
$
5,290.00
$
5,290.00
Cost of goods available for
sale
$
7,495.00
$
7,495.00
$
7,495.00
Ending inventory
$
1,680.00
$
1,520.00
$
1,577.89
Cost of goods sold
$
5,815.00
$
5,975.00
$
5,917.11
15
16
17
18
19
20
F G H I
FIFO LIFO Weighted average
Opening inventory =D16 =G16 =H16
Add: Purchase =SUM(D17:D19) =G17 =H17
Cost of goods available for sale =G16+G17 =H16+H17 =I16+I17
Ending inventory =16*105 =16*95 =(SUM(D16:D19)/(21+5+15+35))*16
Cost of goods sold =G18-G19 =H18-H19 =I18-I19
On the basis of the above table, LIFO, FIFO and Weighted average method has been
applied on the business. The LIFO system of the business explains that the inventory which
has come into the business lastly must be sold out firstly. The LIFO calculations brief that the
ending inventory and COGS of the business is $ 1520 and $ 5975. Further, the FIFO system
of the business explains that the inventory which has come into the business firstly must be
sold out firstly. The LIFO calculations brief that the ending inventory and COGS of the
business is $ 1680 and $ 5815 (Hillier, Grinblatt and Titman, 2011).
Lastly, the weighted average system of the business explains that the total inventory
of the business and their worth must be calculated through weight method to evaluate the per
unit price of the inventory. The weighted average calculations brief that the ending inventory
and COGS of the business is $ 1577.89 and 5917.11.
Suggestions and Conclusion:
On the basis of the above study, it has been concluded that the position of LIFO
method is better. The current purchase price of the company on the basis of the LIFO, FIFO
and Weighted average method is $ 95, $ 105 and $ 98.62. It brief that the LIFO method must
be followed by the business.
Paraphrase This Document
Need a fresh take? Get an instant paraphrase of this document with our AI Paraphraser
Accounting system and processes 8
Part c: Bank reconciliation statement:
a. Debit and credit balance:
1. Deposit in transit: Amount has been deposited in the transit worth $ 1000.
2. Bank Collection: Amount has been collected by the bank from the debtors worth $
1000.
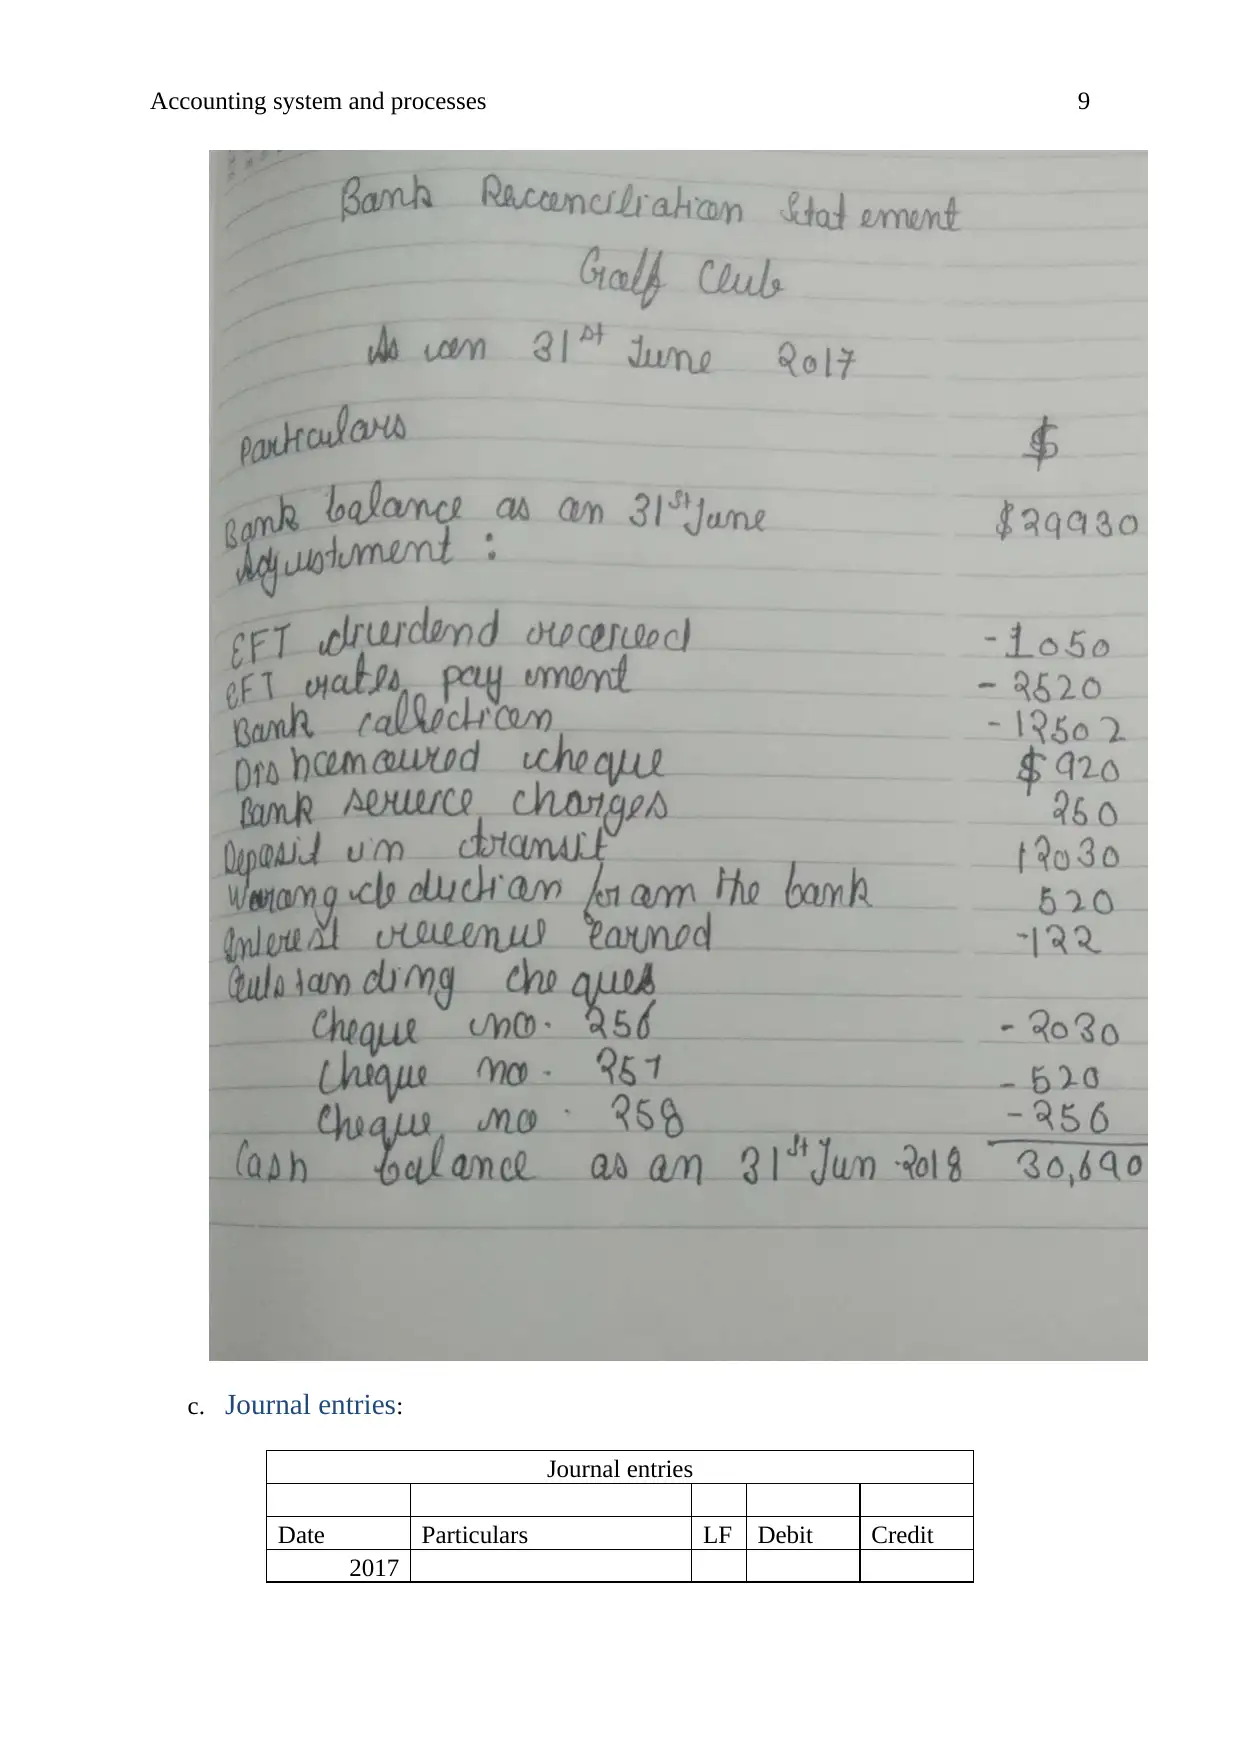
b. Bank reconciliation statement:
Part c: Bank reconciliation statement:
a. Debit and credit balance:
1. Deposit in transit: Amount has been deposited in the transit worth $ 1000.
2. Bank Collection: Amount has been collected by the bank from the debtors worth $
1000.
b. Bank reconciliation statement:
Accounting system and processes 9
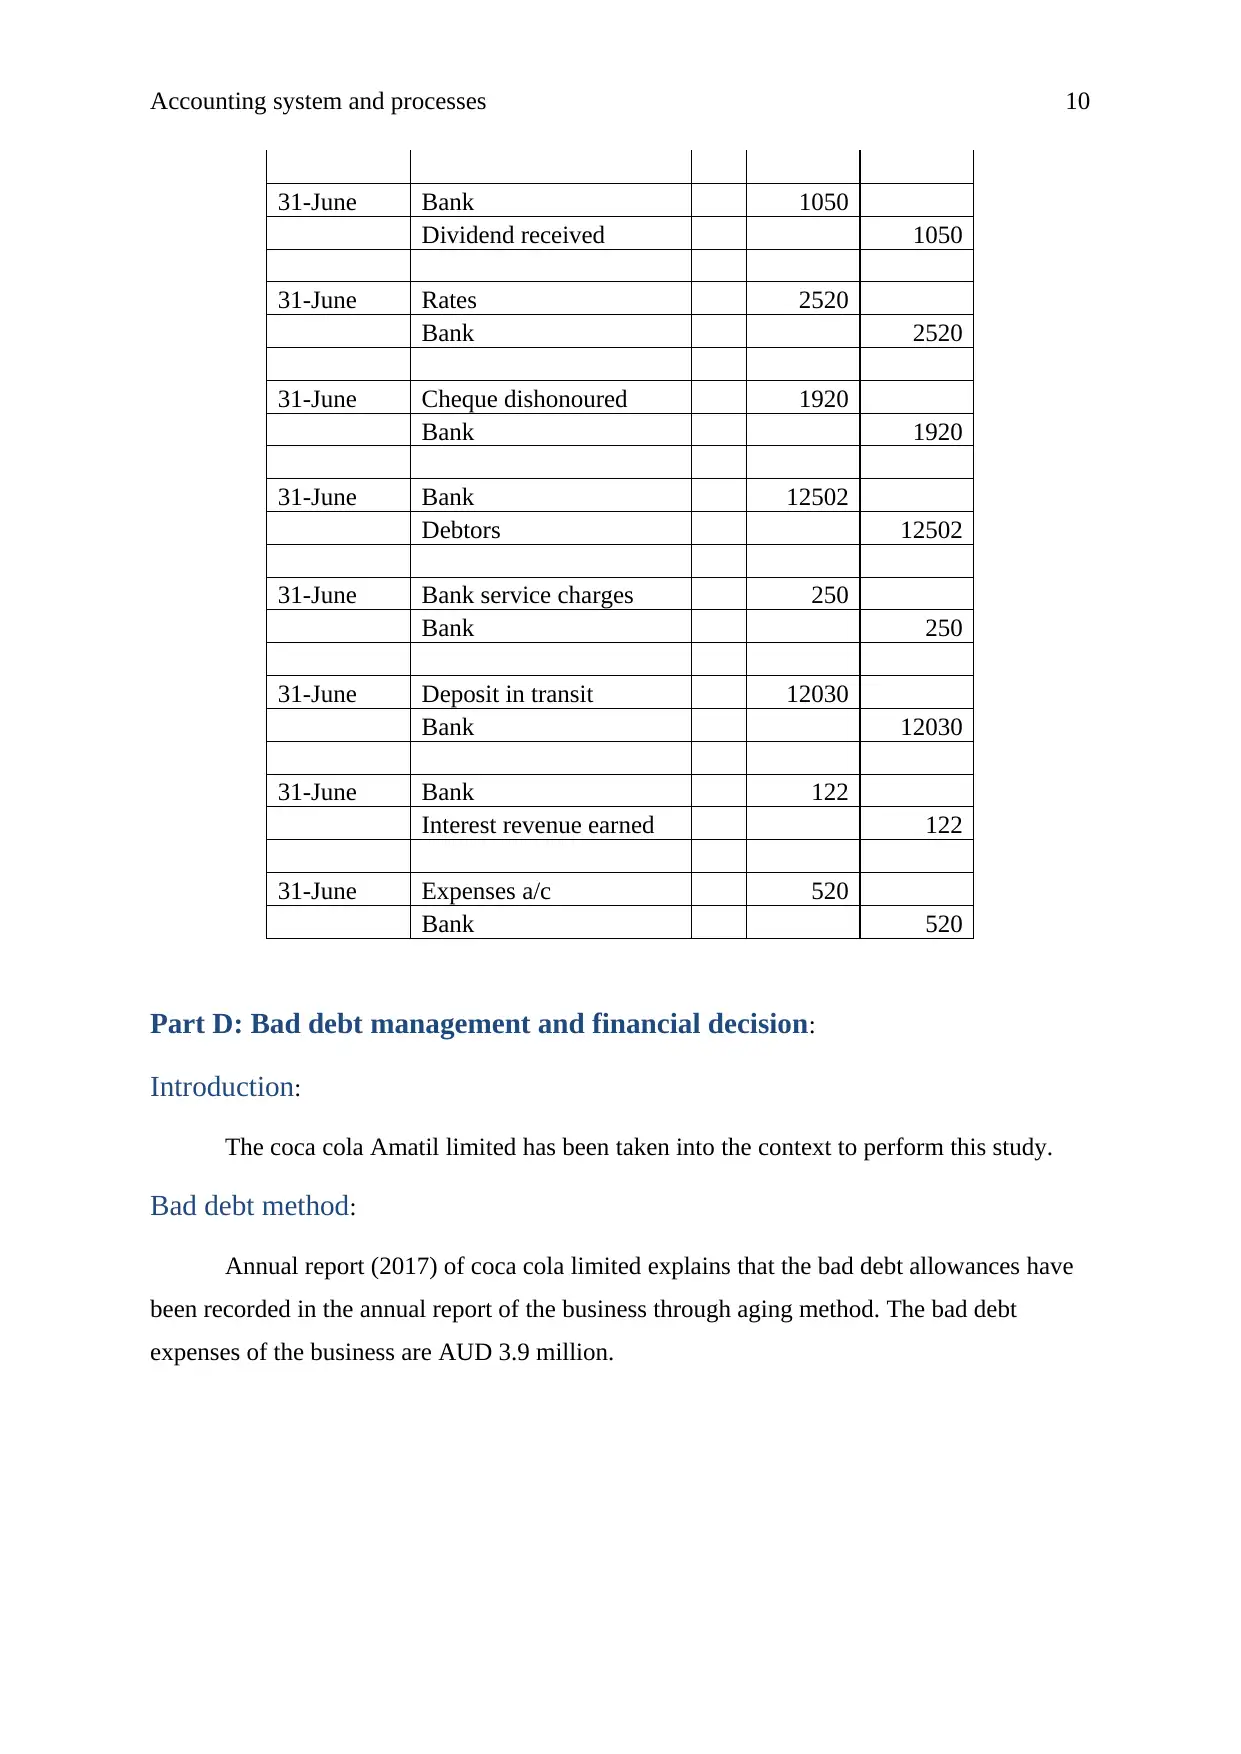
c. Journal entries:
Journal entries
Date Particulars LF Debit Credit
2017
c. Journal entries:
Journal entries
Date Particulars LF Debit Credit
2017
⊘ This is a preview!⊘
Do you want full access?
Subscribe today to unlock all pages.
Trusted by 1+ million students worldwide
Accounting system and processes 10
31-June Bank 1050
Dividend received 1050
31-June Rates 2520
Bank 2520
31-June Cheque dishonoured 1920
Bank 1920
31-June Bank 12502
Debtors 12502
31-June Bank service charges 250
Bank 250
31-June Deposit in transit 12030
Bank 12030
31-June Bank 122
Interest revenue earned 122
31-June Expenses a/c 520
Bank 520
Part D: Bad debt management and financial decision:
Introduction:
The coca cola Amatil limited has been taken into the context to perform this study.
Bad debt method:
Annual report (2017) of coca cola limited explains that the bad debt allowances have
been recorded in the annual report of the business through aging method. The bad debt
expenses of the business are AUD 3.9 million.
Paraphrase This Document
Need a fresh take? Get an instant paraphrase of this document with our AI Paraphraser
Accounting system and processes 11
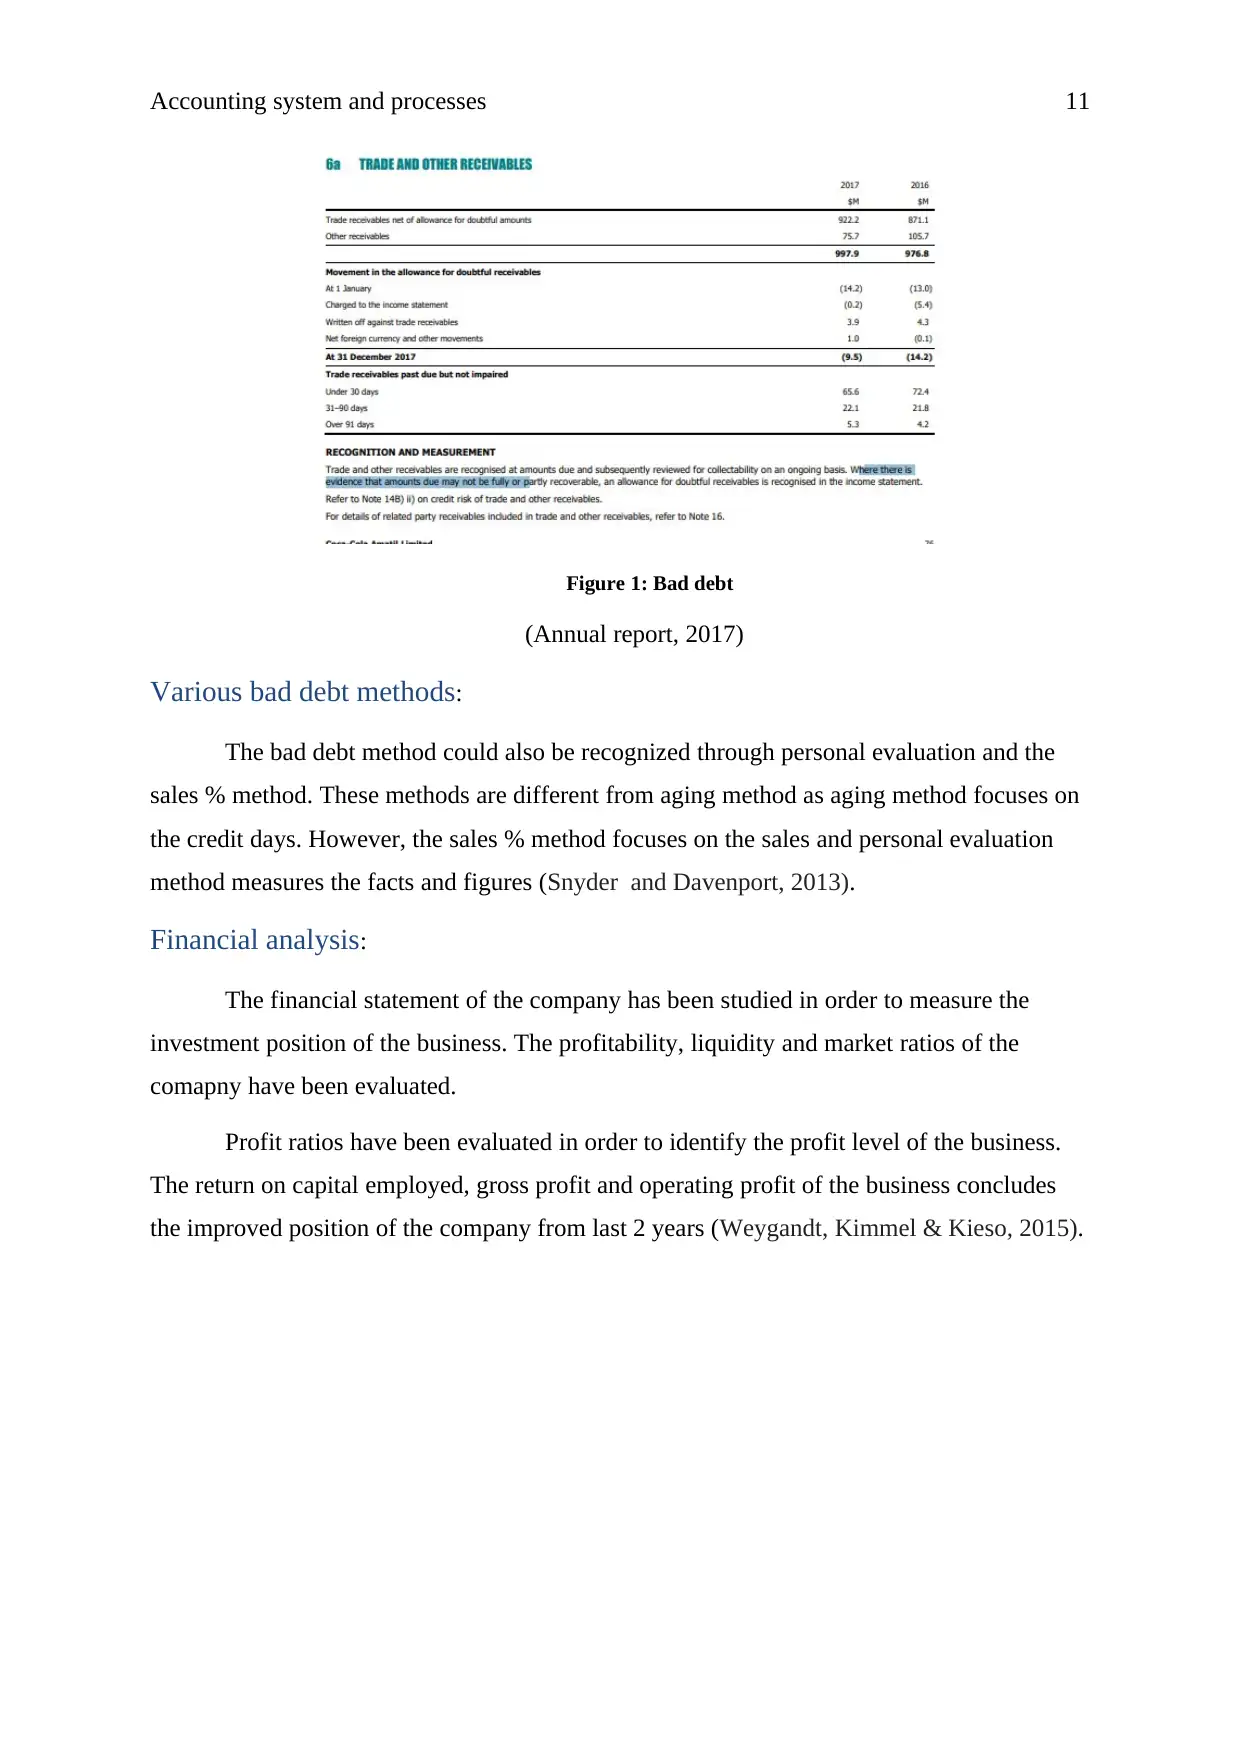
Figure 1: Bad debt
(Annual report, 2017)
Various bad debt methods:
The bad debt method could also be recognized through personal evaluation and the
sales % method. These methods are different from aging method as aging method focuses on
the credit days. However, the sales % method focuses on the sales and personal evaluation
method measures the facts and figures (Snyder and Davenport, 2013).
Financial analysis:
The financial statement of the company has been studied in order to measure the
investment position of the business. The profitability, liquidity and market ratios of the
comapny have been evaluated.
Profit ratios have been evaluated in order to identify the profit level of the business.
The return on capital employed, gross profit and operating profit of the business concludes
the improved position of the company from last 2 years (Weygandt, Kimmel & Kieso, 2015).
Accounting system and processes 12
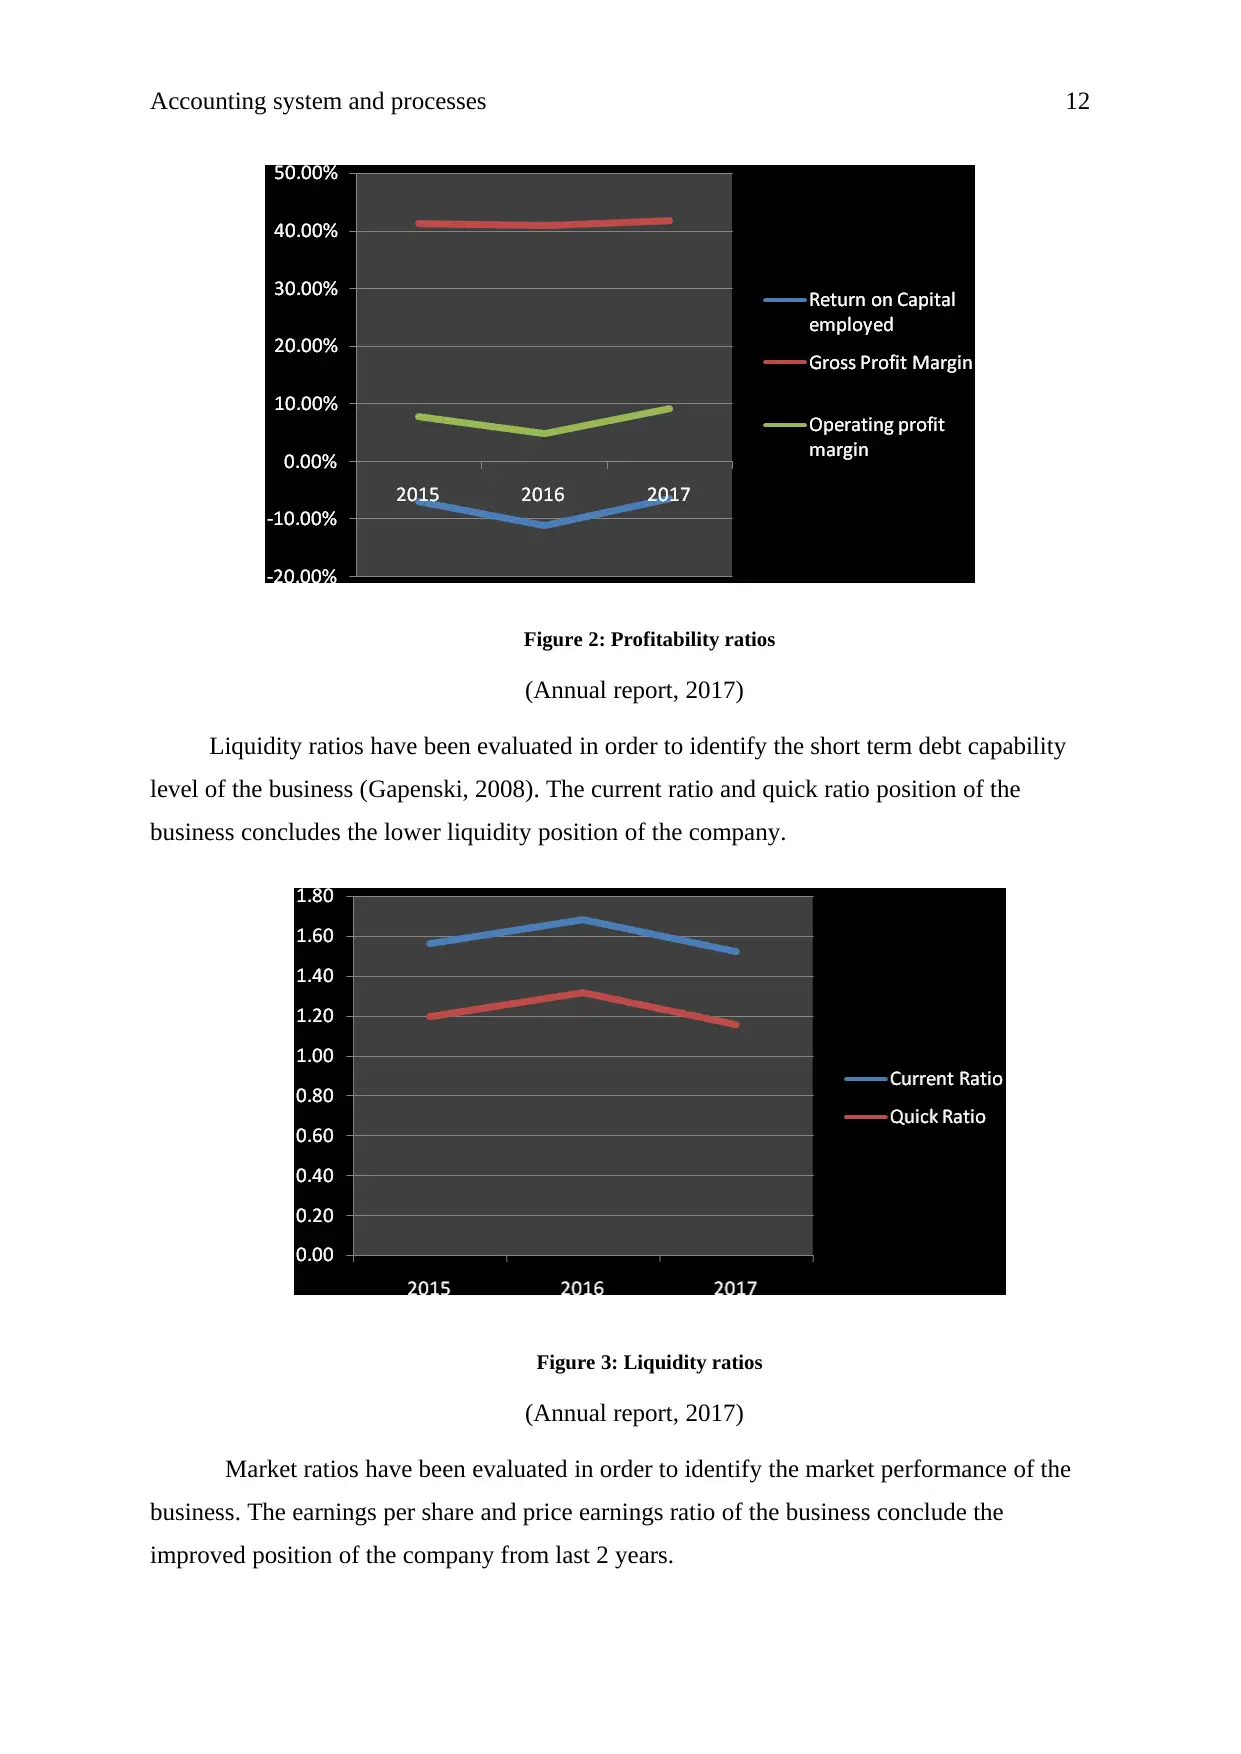
Figure 2: Profitability ratios
(Annual report, 2017)
Liquidity ratios have been evaluated in order to identify the short term debt capability
level of the business (Gapenski, 2008). The current ratio and quick ratio position of the
business concludes the lower liquidity position of the company.
Figure 3: Liquidity ratios
(Annual report, 2017)
Market ratios have been evaluated in order to identify the market performance of the
business. The earnings per share and price earnings ratio of the business conclude the
improved position of the company from last 2 years.
⊘ This is a preview!⊘
Do you want full access?
Subscribe today to unlock all pages.
Trusted by 1+ million students worldwide
1 out of 16
Related Documents


Your All-in-One AI-Powered Toolkit for Academic Success.
+13062052269
info@desklib.com
Available 24*7 on WhatsApp / Email
![[object Object]](/_next/static/media/star-bottom.7253800d.svg)
Unlock your academic potential
Copyright © 2020–2026 A2Z Services. All Rights Reserved. Developed and managed by ZUCOL.