Accounting System and Processes: A Comprehensive Project Report
VerifiedAdded on 2023/06/05
|15
|2715
|161
Project
AI Summary
This project report provides a comprehensive analysis of accounting systems and processes. It begins with an overview of spreadsheets, including their uses, advantages, and disadvantages, along with examples of IF functions and negative number formatting. The report then delves into inventory management, comparing perpetual and periodic inventory systems and evaluating different valuation methods (LIFO, FIFO, and weighted average) for a retail company, Fashion Heaven, offering recommendations for optimal inventory practices. Further, the report examines bank reconciliation statements, including debit and credit balances and journal entries. Finally, it assesses bad debt management, analyzing methods for recognizing bad debts and conducting a financial analysis of Coca-Cola Amatil, including profitability, liquidity, and market ratios, and concludes with recommendations based on the findings.
Running Head: Accounting system and processes
1
Project Report: Accounting system and processes
1
Project Report: Accounting system and processes
Paraphrase This Document
Need a fresh take? Get an instant paraphrase of this document with our AI Paraphraser
Accounting system and processes 2
Contents
Part A: Spreadsheet...........................................................................................................3
a.Spreadsheet................................................................................................................3
b.Separation of data report and spreadsheet.................................................................3
c.Spreadsheet example..................................................................................................4
i.IF function..................................................................................................................4
ii.Negative number in brackets.....................................................................................4
iii.Naming reference cells.............................................................................................4
Part B: Inventory management.........................................................................................4
Introduction...................................................................................................................4
Perpetual and periodic inventory system......................................................................5
Cost of goods sold and profit level...............................................................................5
Suggestions and Conclusion.........................................................................................6
Part c: Bank reconciliation statement...............................................................................6
a.Debit and credit balance:...........................................................................................7
b.Bank reconciliation statement....................................................................................7
c.Journal entries............................................................................................................7
Part D: Bad debt management and financial decision......................................................9
Introduction...................................................................................................................9
Bad debt method...........................................................................................................9
Various bad debt methods............................................................................................9
Financial analysis..........................................................................................................9
Sustainability analysis................................................................................................12
Recommendation and conclusion...............................................................................13
Accounting system and processes 3
References.......................................................................................................................14
Part A: Spreadsheet:
a. Spreadsheet:
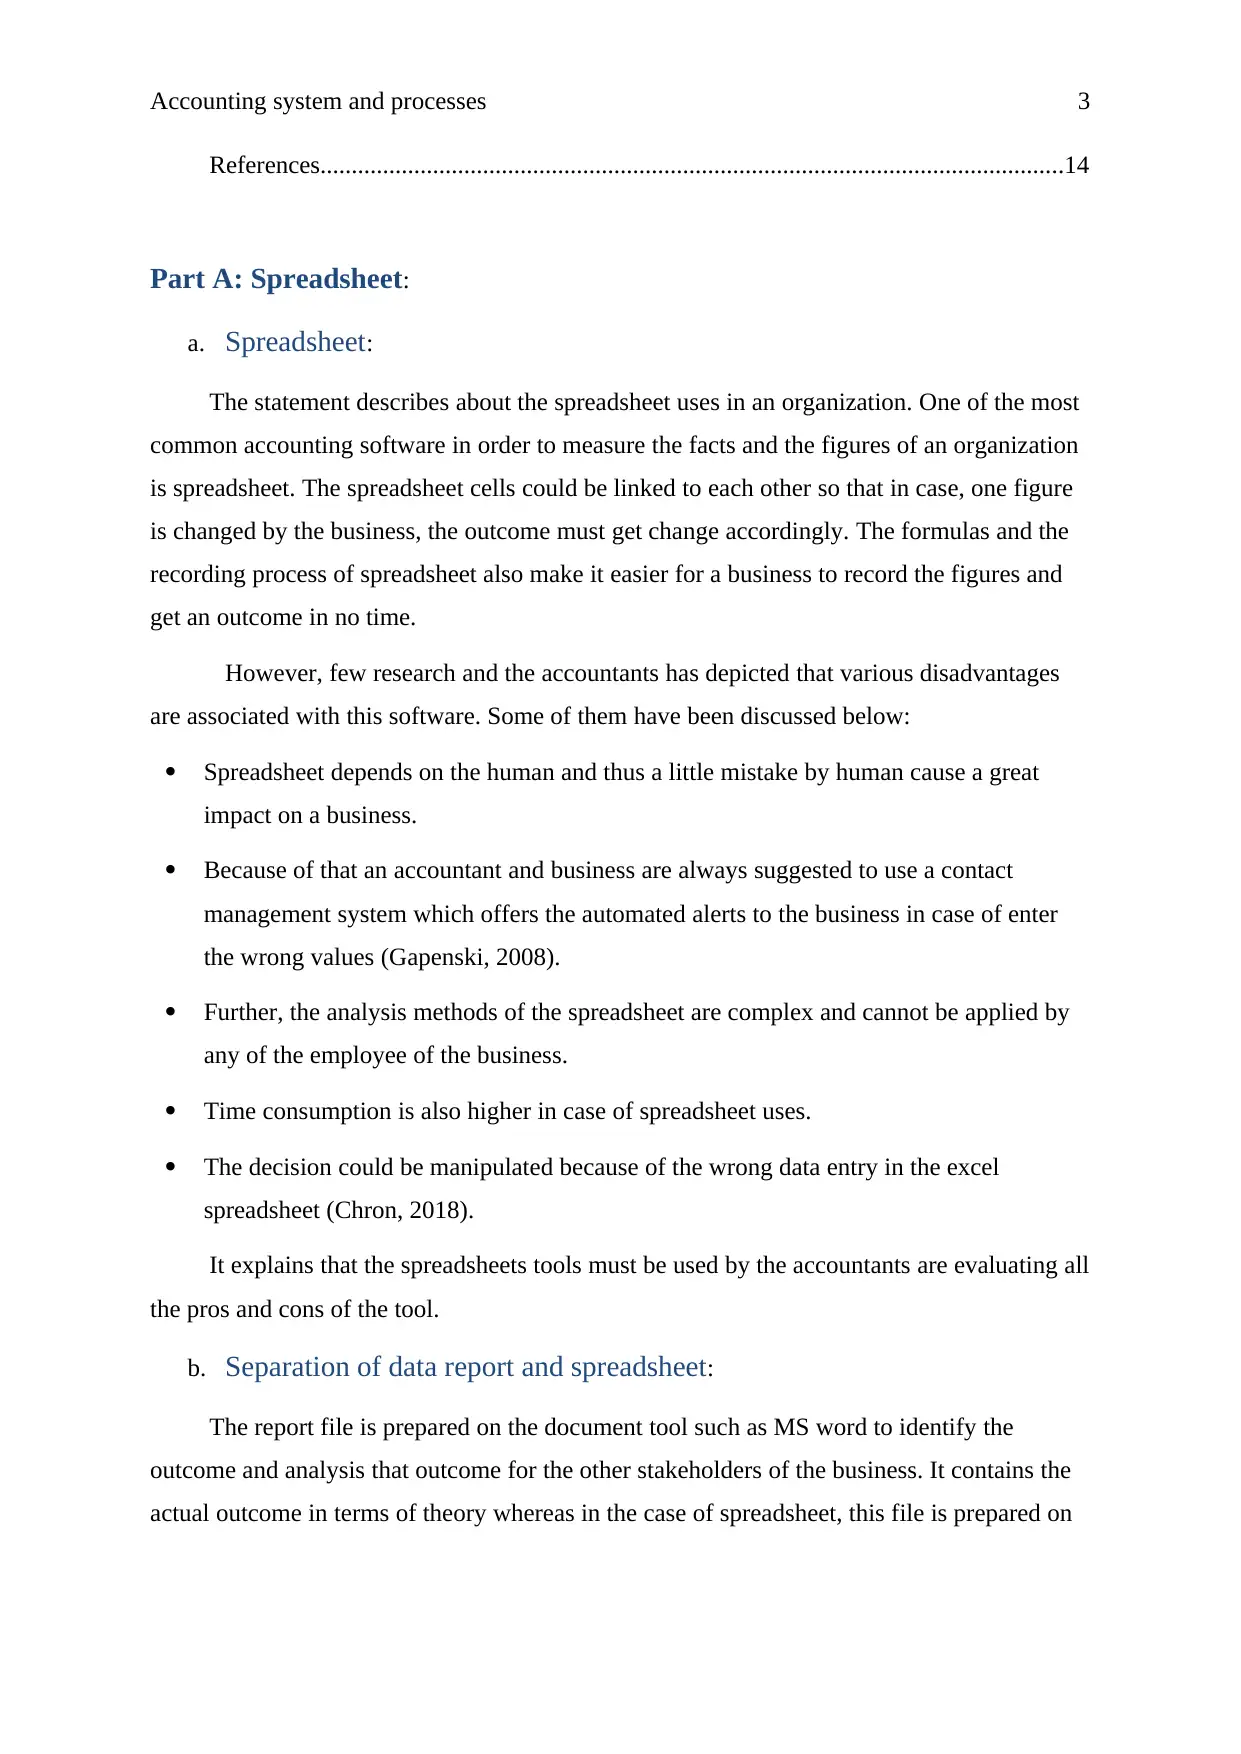
The statement describes about the spreadsheet uses in an organization. One of the most
common accounting software in order to measure the facts and the figures of an organization
is spreadsheet. The spreadsheet cells could be linked to each other so that in case, one figure
is changed by the business, the outcome must get change accordingly. The formulas and the
recording process of spreadsheet also make it easier for a business to record the figures and
get an outcome in no time.
However, few research and the accountants has depicted that various disadvantages
are associated with this software. Some of them have been discussed below:
Spreadsheet depends on the human and thus a little mistake by human cause a great
impact on a business.
Because of that an accountant and business are always suggested to use a contact
management system which offers the automated alerts to the business in case of enter
the wrong values (Gapenski, 2008).
Further, the analysis methods of the spreadsheet are complex and cannot be applied by
any of the employee of the business.
Time consumption is also higher in case of spreadsheet uses.
The decision could be manipulated because of the wrong data entry in the excel
spreadsheet (Chron, 2018).
It explains that the spreadsheets tools must be used by the accountants are evaluating all
the pros and cons of the tool.
b. Separation of data report and spreadsheet:
The report file is prepared on the document tool such as MS word to identify the
outcome and analysis that outcome for the other stakeholders of the business. It contains the
actual outcome in terms of theory whereas in the case of spreadsheet, this file is prepared on
References.......................................................................................................................14
Part A: Spreadsheet:
a. Spreadsheet:
The statement describes about the spreadsheet uses in an organization. One of the most
common accounting software in order to measure the facts and the figures of an organization
is spreadsheet. The spreadsheet cells could be linked to each other so that in case, one figure
is changed by the business, the outcome must get change accordingly. The formulas and the
recording process of spreadsheet also make it easier for a business to record the figures and
get an outcome in no time.
However, few research and the accountants has depicted that various disadvantages
are associated with this software. Some of them have been discussed below:
Spreadsheet depends on the human and thus a little mistake by human cause a great
impact on a business.
Because of that an accountant and business are always suggested to use a contact
management system which offers the automated alerts to the business in case of enter
the wrong values (Gapenski, 2008).
Further, the analysis methods of the spreadsheet are complex and cannot be applied by
any of the employee of the business.
Time consumption is also higher in case of spreadsheet uses.
The decision could be manipulated because of the wrong data entry in the excel
spreadsheet (Chron, 2018).
It explains that the spreadsheets tools must be used by the accountants are evaluating all
the pros and cons of the tool.
b. Separation of data report and spreadsheet:
The report file is prepared on the document tool such as MS word to identify the
outcome and analysis that outcome for the other stakeholders of the business. It contains the
actual outcome in terms of theory whereas in the case of spreadsheet, this file is prepared on
⊘ This is a preview!⊘
Do you want full access?
Subscribe today to unlock all pages.
Trusted by 1+ million students worldwide
Accounting system and processes 4
the basis of the available numbers to calculate an outcome (Edwards, 2013). Both of the files
contain the different motto and thus it must be presented differently.
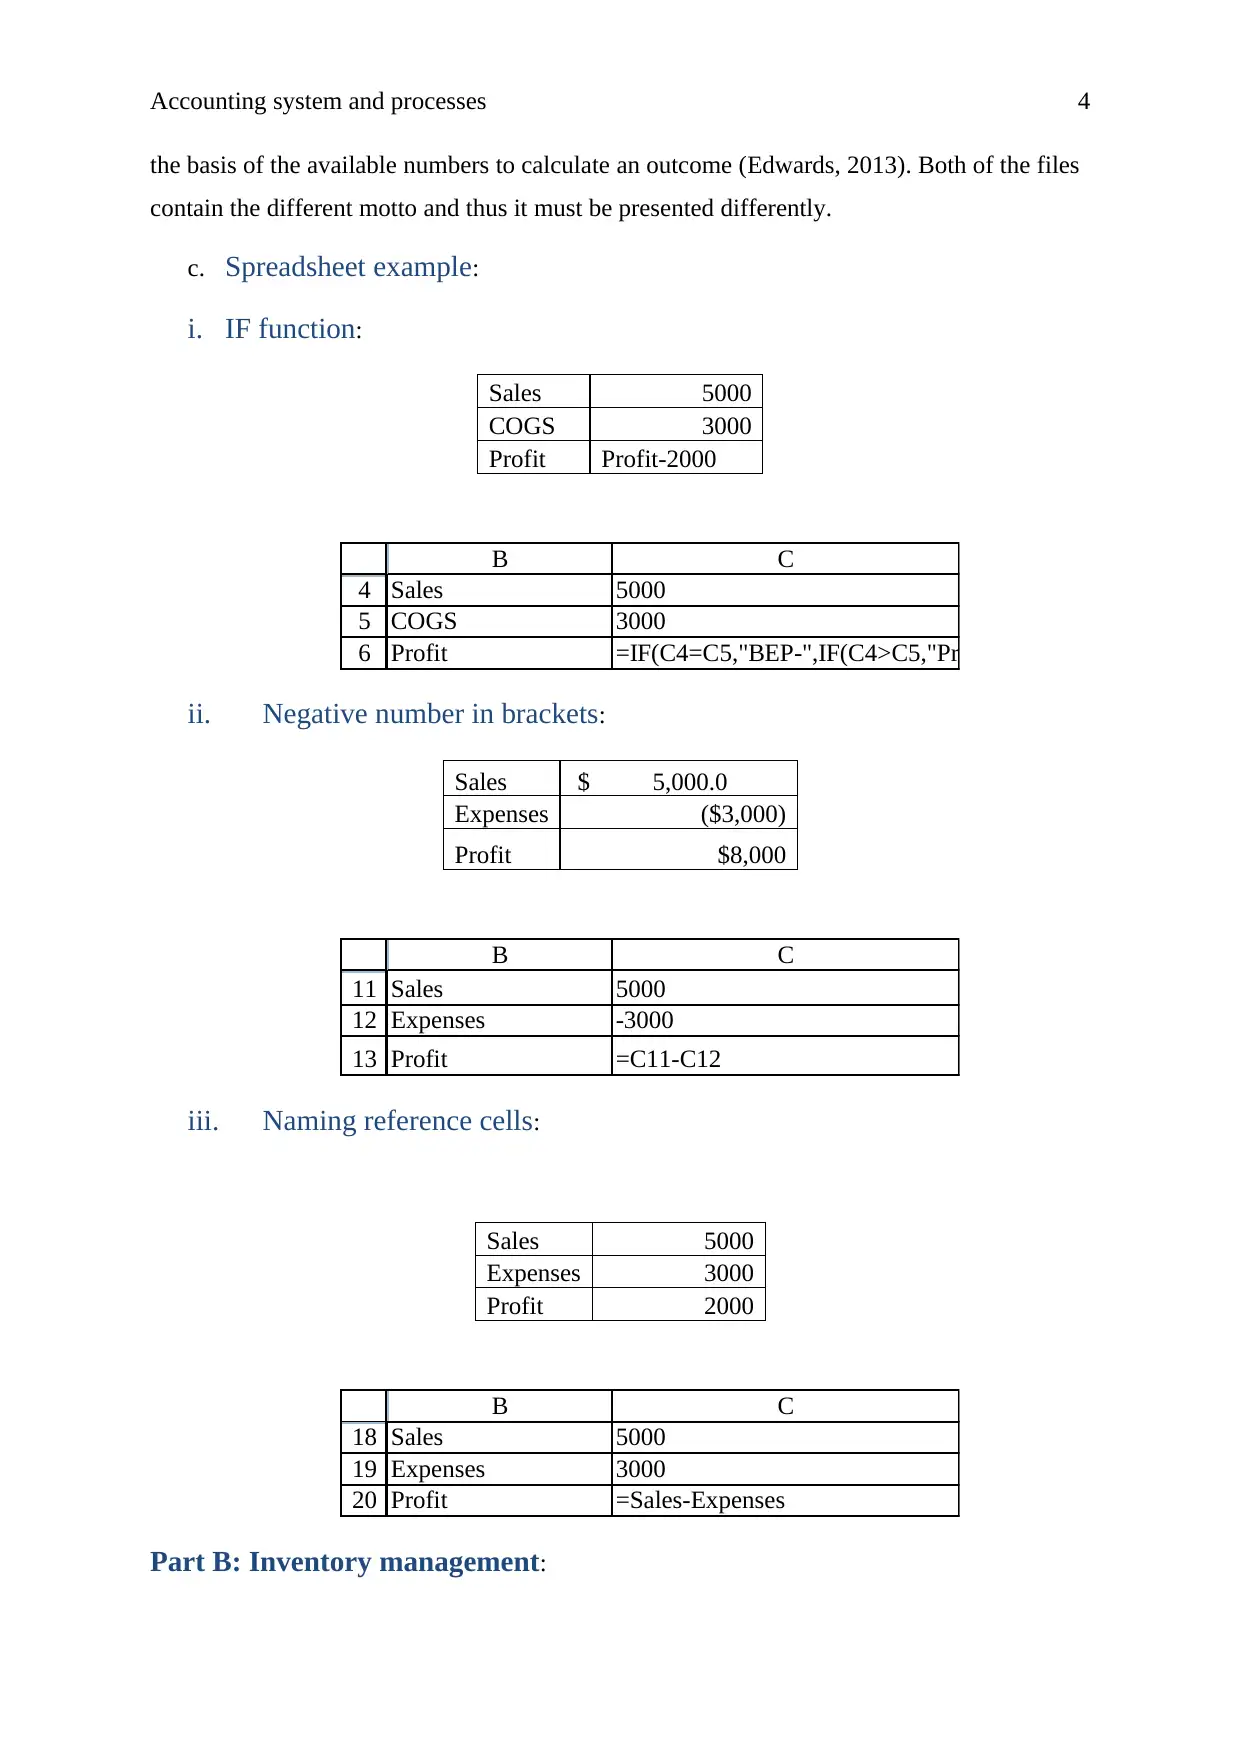
c. Spreadsheet example:
i. IF function:
Sales 5000
COGS 3000
Profit Profit-2000
4
5
6
B C
Sales 5000
COGS 3000
Profit =IF(C4=C5,"BEP-",IF(C4>C5,"Profit-",IF(C4<C5,"Loss-")))&
ii. Negative number in brackets:
Sales $ 5,000.0
Expenses ($3,000)
Profit $8,000
11
12
13
B C
Sales 5000
Expenses -3000
Profit =C11-C12
iii. Naming reference cells:
Sales 5000
Expenses 3000
Profit 2000
18
19
20
B C
Sales 5000
Expenses 3000
Profit =Sales-Expenses
Part B: Inventory management:
the basis of the available numbers to calculate an outcome (Edwards, 2013). Both of the files
contain the different motto and thus it must be presented differently.
c. Spreadsheet example:
i. IF function:
Sales 5000
COGS 3000
Profit Profit-2000
4
5
6
B C
Sales 5000
COGS 3000
Profit =IF(C4=C5,"BEP-",IF(C4>C5,"Profit-",IF(C4<C5,"Loss-")))&
ii. Negative number in brackets:
Sales $ 5,000.0
Expenses ($3,000)
Profit $8,000
11
12
13
B C
Sales 5000
Expenses -3000
Profit =C11-C12
iii. Naming reference cells:
Sales 5000
Expenses 3000
Profit 2000
18
19
20
B C
Sales 5000
Expenses 3000
Profit =Sales-Expenses
Part B: Inventory management:
Paraphrase This Document
Need a fresh take? Get an instant paraphrase of this document with our AI Paraphraser
Accounting system and processes 5
Introduction:
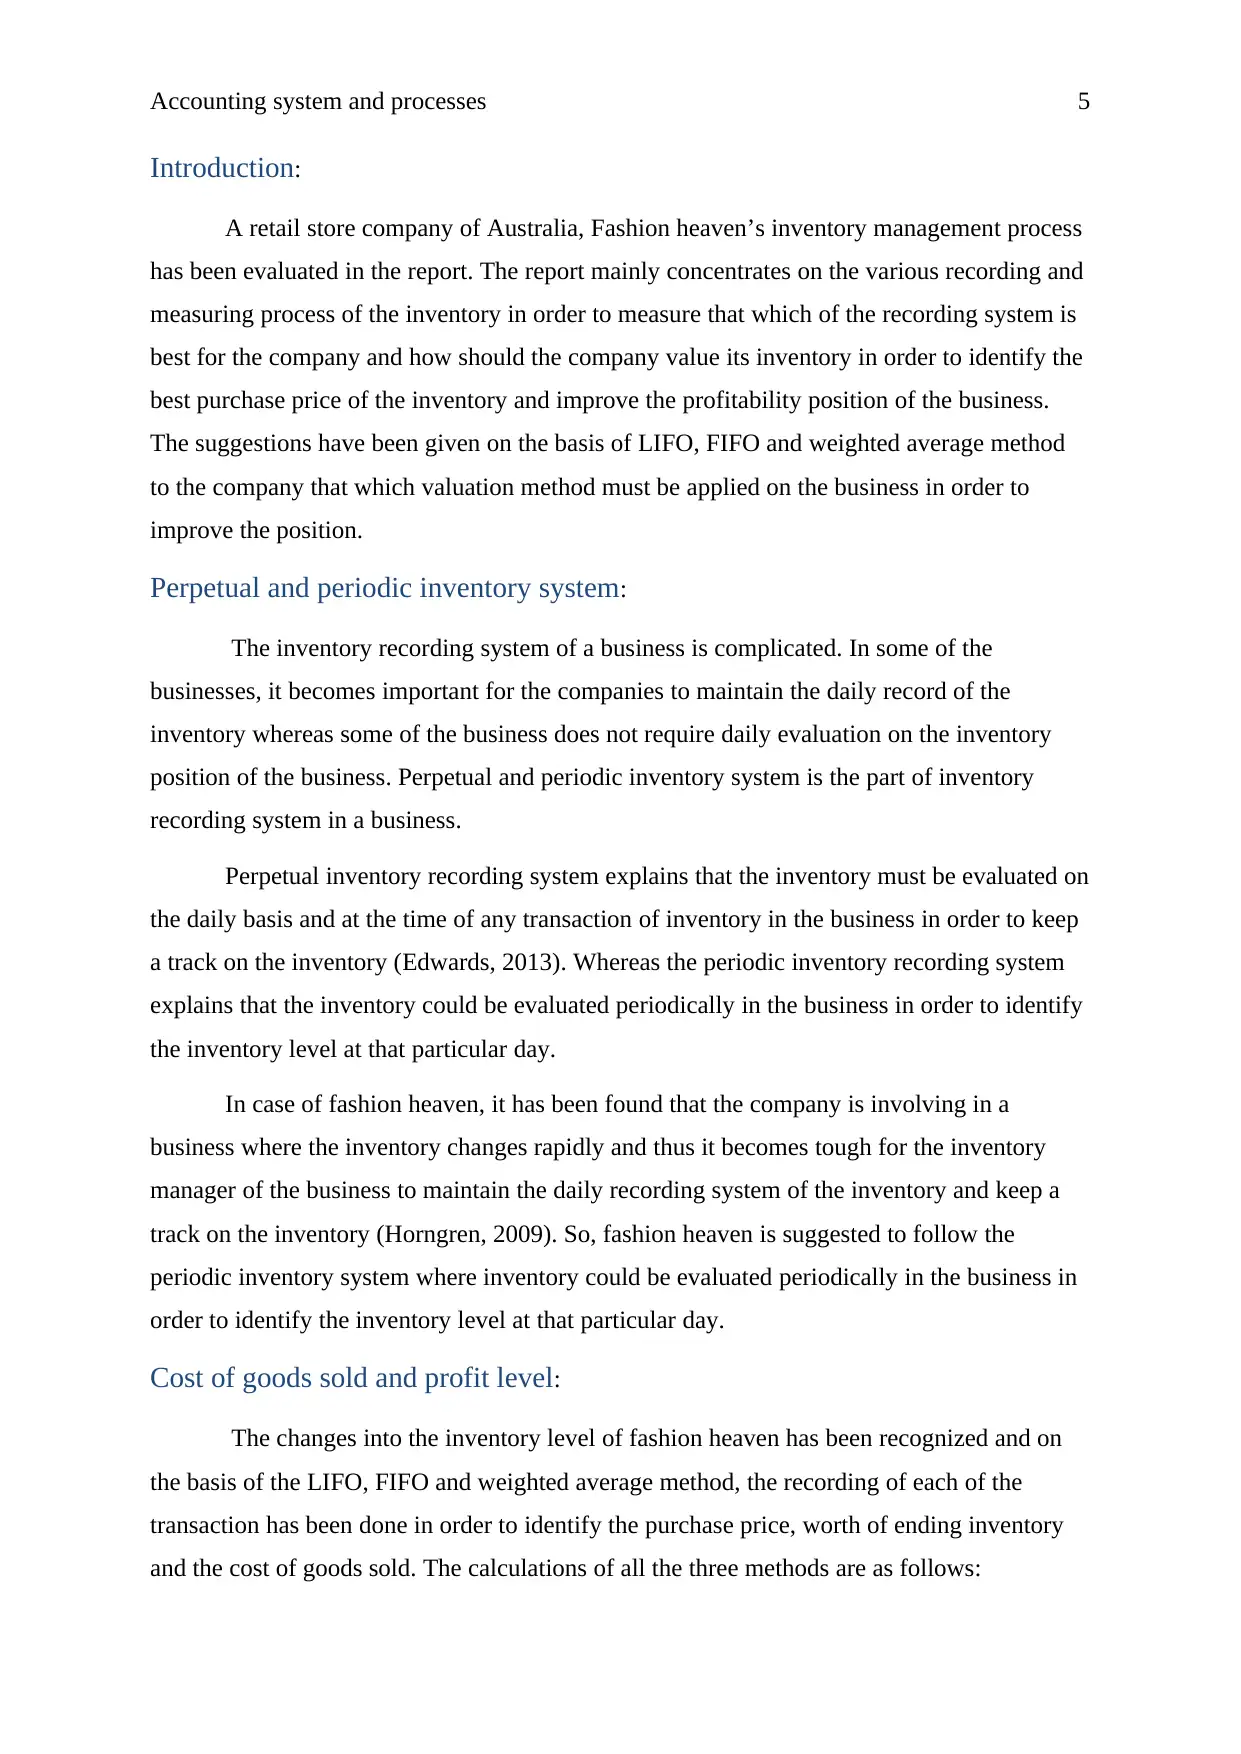
A retail store company of Australia, Fashion heaven’s inventory management process
has been evaluated in the report. The report mainly concentrates on the various recording and
measuring process of the inventory in order to measure that which of the recording system is
best for the company and how should the company value its inventory in order to identify the
best purchase price of the inventory and improve the profitability position of the business.
The suggestions have been given on the basis of LIFO, FIFO and weighted average method
to the company that which valuation method must be applied on the business in order to
improve the position.
Perpetual and periodic inventory system:
The inventory recording system of a business is complicated. In some of the
businesses, it becomes important for the companies to maintain the daily record of the
inventory whereas some of the business does not require daily evaluation on the inventory
position of the business. Perpetual and periodic inventory system is the part of inventory
recording system in a business.
Perpetual inventory recording system explains that the inventory must be evaluated on
the daily basis and at the time of any transaction of inventory in the business in order to keep
a track on the inventory (Edwards, 2013). Whereas the periodic inventory recording system
explains that the inventory could be evaluated periodically in the business in order to identify
the inventory level at that particular day.
In case of fashion heaven, it has been found that the company is involving in a
business where the inventory changes rapidly and thus it becomes tough for the inventory
manager of the business to maintain the daily recording system of the inventory and keep a
track on the inventory (Horngren, 2009). So, fashion heaven is suggested to follow the
periodic inventory system where inventory could be evaluated periodically in the business in
order to identify the inventory level at that particular day.
Cost of goods sold and profit level:
The changes into the inventory level of fashion heaven has been recognized and on
the basis of the LIFO, FIFO and weighted average method, the recording of each of the
transaction has been done in order to identify the purchase price, worth of ending inventory
and the cost of goods sold. The calculations of all the three methods are as follows:
Introduction:
A retail store company of Australia, Fashion heaven’s inventory management process
has been evaluated in the report. The report mainly concentrates on the various recording and
measuring process of the inventory in order to measure that which of the recording system is
best for the company and how should the company value its inventory in order to identify the
best purchase price of the inventory and improve the profitability position of the business.
The suggestions have been given on the basis of LIFO, FIFO and weighted average method
to the company that which valuation method must be applied on the business in order to
improve the position.
Perpetual and periodic inventory system:
The inventory recording system of a business is complicated. In some of the
businesses, it becomes important for the companies to maintain the daily record of the
inventory whereas some of the business does not require daily evaluation on the inventory
position of the business. Perpetual and periodic inventory system is the part of inventory
recording system in a business.
Perpetual inventory recording system explains that the inventory must be evaluated on
the daily basis and at the time of any transaction of inventory in the business in order to keep
a track on the inventory (Edwards, 2013). Whereas the periodic inventory recording system
explains that the inventory could be evaluated periodically in the business in order to identify
the inventory level at that particular day.
In case of fashion heaven, it has been found that the company is involving in a
business where the inventory changes rapidly and thus it becomes tough for the inventory
manager of the business to maintain the daily recording system of the inventory and keep a
track on the inventory (Horngren, 2009). So, fashion heaven is suggested to follow the
periodic inventory system where inventory could be evaluated periodically in the business in
order to identify the inventory level at that particular day.
Cost of goods sold and profit level:
The changes into the inventory level of fashion heaven has been recognized and on
the basis of the LIFO, FIFO and weighted average method, the recording of each of the
transaction has been done in order to identify the purchase price, worth of ending inventory
and the cost of goods sold. The calculations of all the three methods are as follows:
Accounting system and processes 6
Opening
inventory + Purchase =
Cost of
goods
sold
before
ending
inventory -
Ending
inventory =
Cost of
goods
sold
LIFO 2205 + 7495 = 9700 -
$
1,680.00 =
$
8,020.00
LIFO 2205 + 7495 = 9700 -
$
1,520.00 =
$
8,180.00
Weighted
average 2205 + 7495 = 9700 -
$
1,577.89 =
$
8,122.11
5
6
7
8
F G H I J K L M N O
Opening inventory + Purchase = Cost of goods sold before ending inventory- Ending inventory = Cost of goods sold
LIFO =21*105 + =I12 = =G6+I6 - =16*G12 = =K6-M6
FIFO =21*105 + =I6 = =G7+I7 - =16*G15 = =K7-M7
Weighted average =21*105 + =I7 = =G8+I8 - =(I12/SUM(F12:F15))*16= =K8-M8
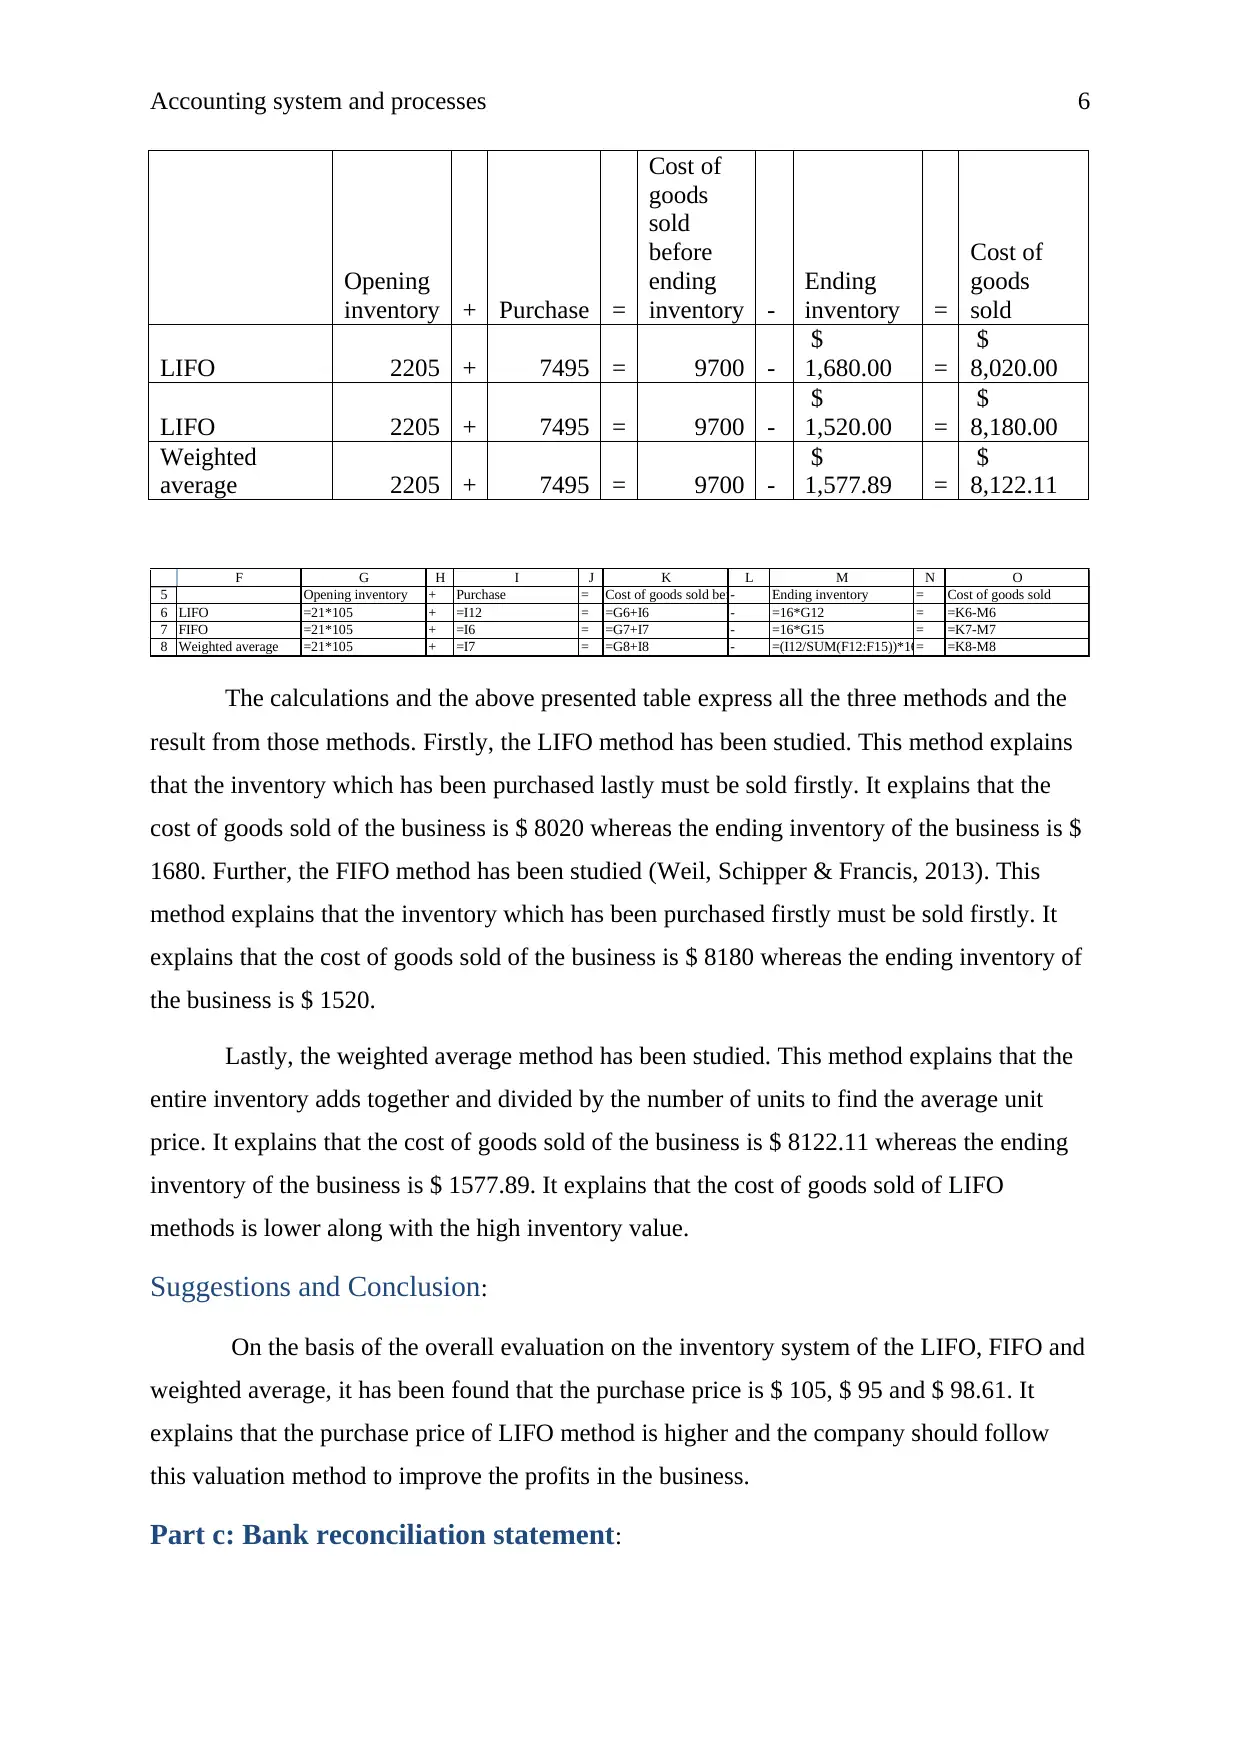
The calculations and the above presented table express all the three methods and the
result from those methods. Firstly, the LIFO method has been studied. This method explains
that the inventory which has been purchased lastly must be sold firstly. It explains that the
cost of goods sold of the business is $ 8020 whereas the ending inventory of the business is $
1680. Further, the FIFO method has been studied (Weil, Schipper & Francis, 2013). This
method explains that the inventory which has been purchased firstly must be sold firstly. It
explains that the cost of goods sold of the business is $ 8180 whereas the ending inventory of
the business is $ 1520.
Lastly, the weighted average method has been studied. This method explains that the
entire inventory adds together and divided by the number of units to find the average unit
price. It explains that the cost of goods sold of the business is $ 8122.11 whereas the ending
inventory of the business is $ 1577.89. It explains that the cost of goods sold of LIFO
methods is lower along with the high inventory value.
Suggestions and Conclusion:
On the basis of the overall evaluation on the inventory system of the LIFO, FIFO and
weighted average, it has been found that the purchase price is $ 105, $ 95 and $ 98.61. It
explains that the purchase price of LIFO method is higher and the company should follow
this valuation method to improve the profits in the business.
Part c: Bank reconciliation statement:
Opening
inventory + Purchase =
Cost of
goods
sold
before
ending
inventory -
Ending
inventory =
Cost of
goods
sold
LIFO 2205 + 7495 = 9700 -
$
1,680.00 =
$
8,020.00
LIFO 2205 + 7495 = 9700 -
$
1,520.00 =
$
8,180.00
Weighted
average 2205 + 7495 = 9700 -
$
1,577.89 =
$
8,122.11
5
6
7
8
F G H I J K L M N O
Opening inventory + Purchase = Cost of goods sold before ending inventory- Ending inventory = Cost of goods sold
LIFO =21*105 + =I12 = =G6+I6 - =16*G12 = =K6-M6
FIFO =21*105 + =I6 = =G7+I7 - =16*G15 = =K7-M7
Weighted average =21*105 + =I7 = =G8+I8 - =(I12/SUM(F12:F15))*16= =K8-M8
The calculations and the above presented table express all the three methods and the
result from those methods. Firstly, the LIFO method has been studied. This method explains
that the inventory which has been purchased lastly must be sold firstly. It explains that the
cost of goods sold of the business is $ 8020 whereas the ending inventory of the business is $
1680. Further, the FIFO method has been studied (Weil, Schipper & Francis, 2013). This
method explains that the inventory which has been purchased firstly must be sold firstly. It
explains that the cost of goods sold of the business is $ 8180 whereas the ending inventory of
the business is $ 1520.
Lastly, the weighted average method has been studied. This method explains that the
entire inventory adds together and divided by the number of units to find the average unit
price. It explains that the cost of goods sold of the business is $ 8122.11 whereas the ending
inventory of the business is $ 1577.89. It explains that the cost of goods sold of LIFO
methods is lower along with the high inventory value.
Suggestions and Conclusion:
On the basis of the overall evaluation on the inventory system of the LIFO, FIFO and
weighted average, it has been found that the purchase price is $ 105, $ 95 and $ 98.61. It
explains that the purchase price of LIFO method is higher and the company should follow
this valuation method to improve the profits in the business.
Part c: Bank reconciliation statement:
⊘ This is a preview!⊘
Do you want full access?
Subscribe today to unlock all pages.
Trusted by 1+ million students worldwide
Accounting system and processes 7
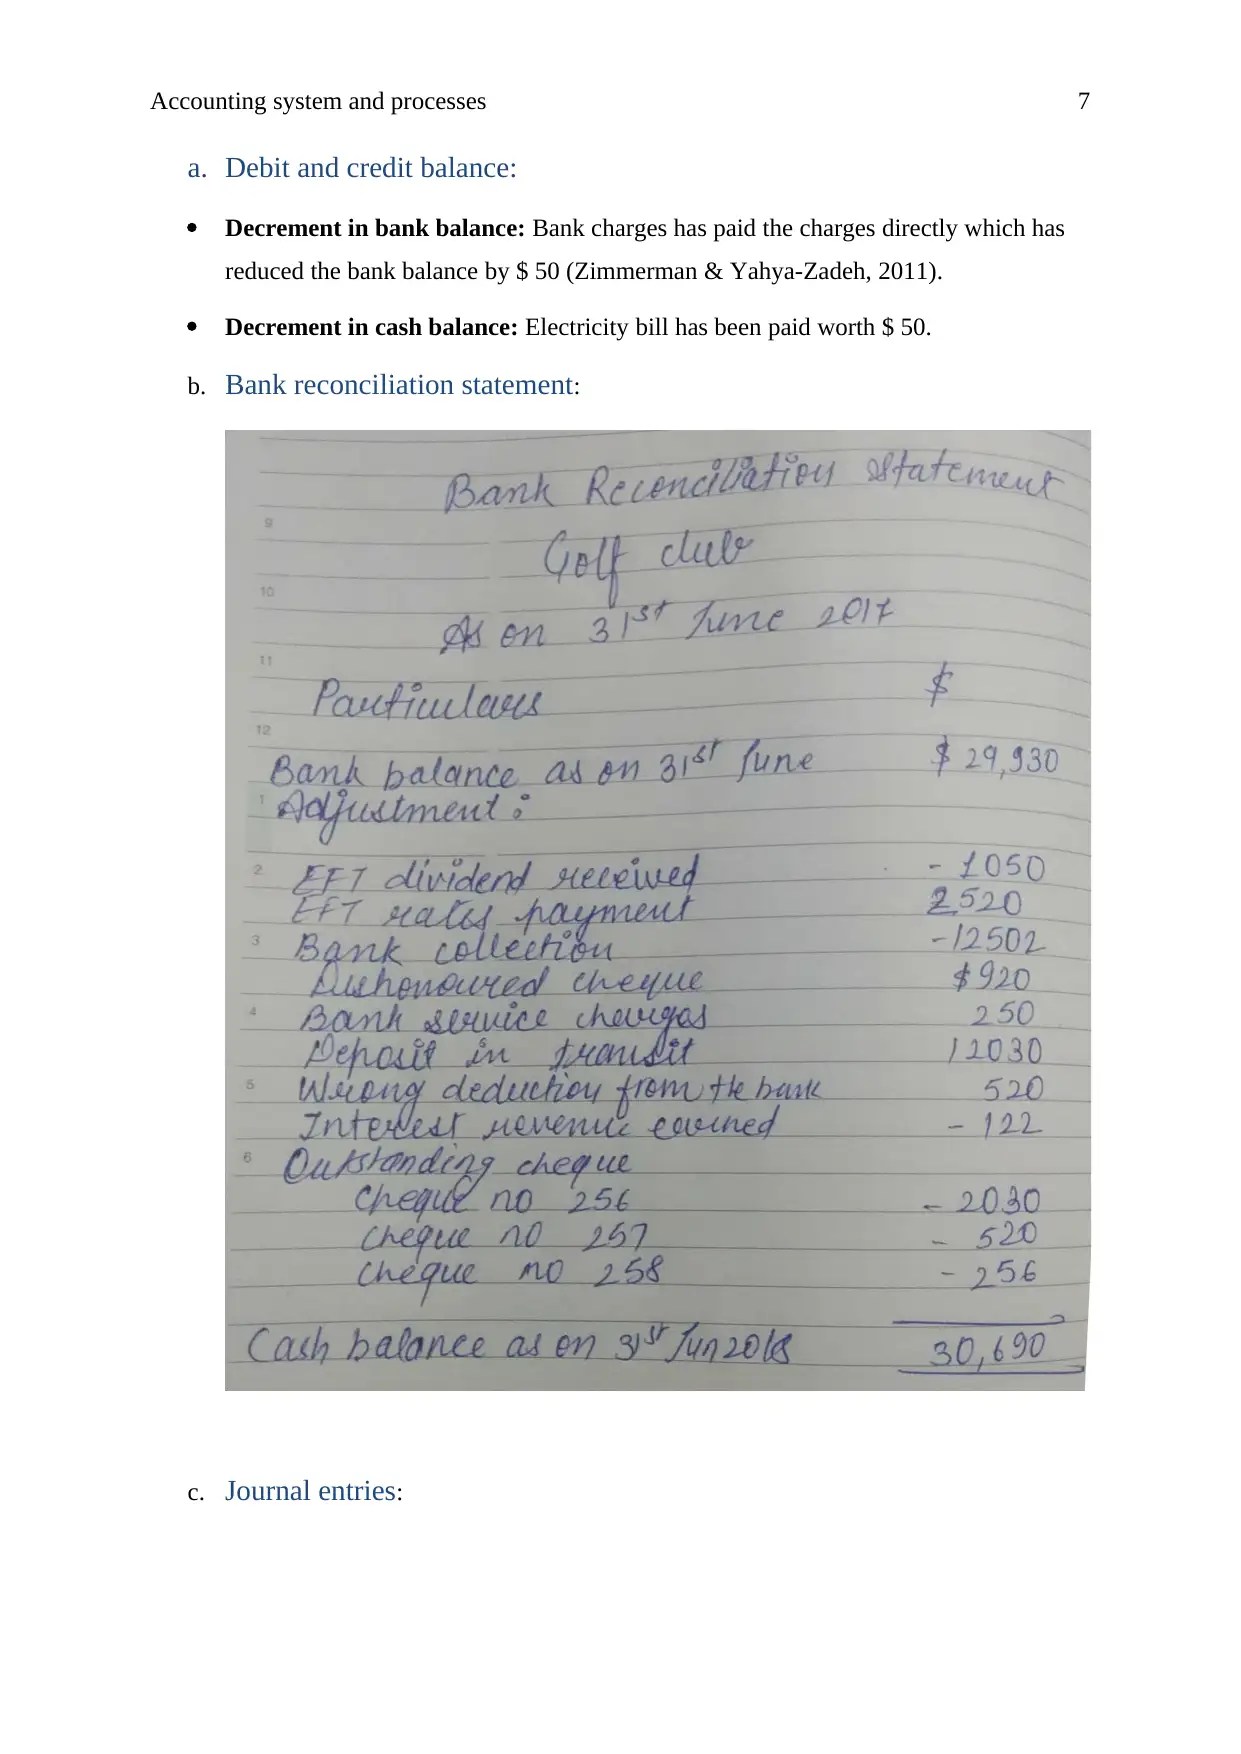
a. Debit and credit balance:
Decrement in bank balance: Bank charges has paid the charges directly which has
reduced the bank balance by $ 50 (Zimmerman & Yahya-Zadeh, 2011).
Decrement in cash balance: Electricity bill has been paid worth $ 50.
b. Bank reconciliation statement:
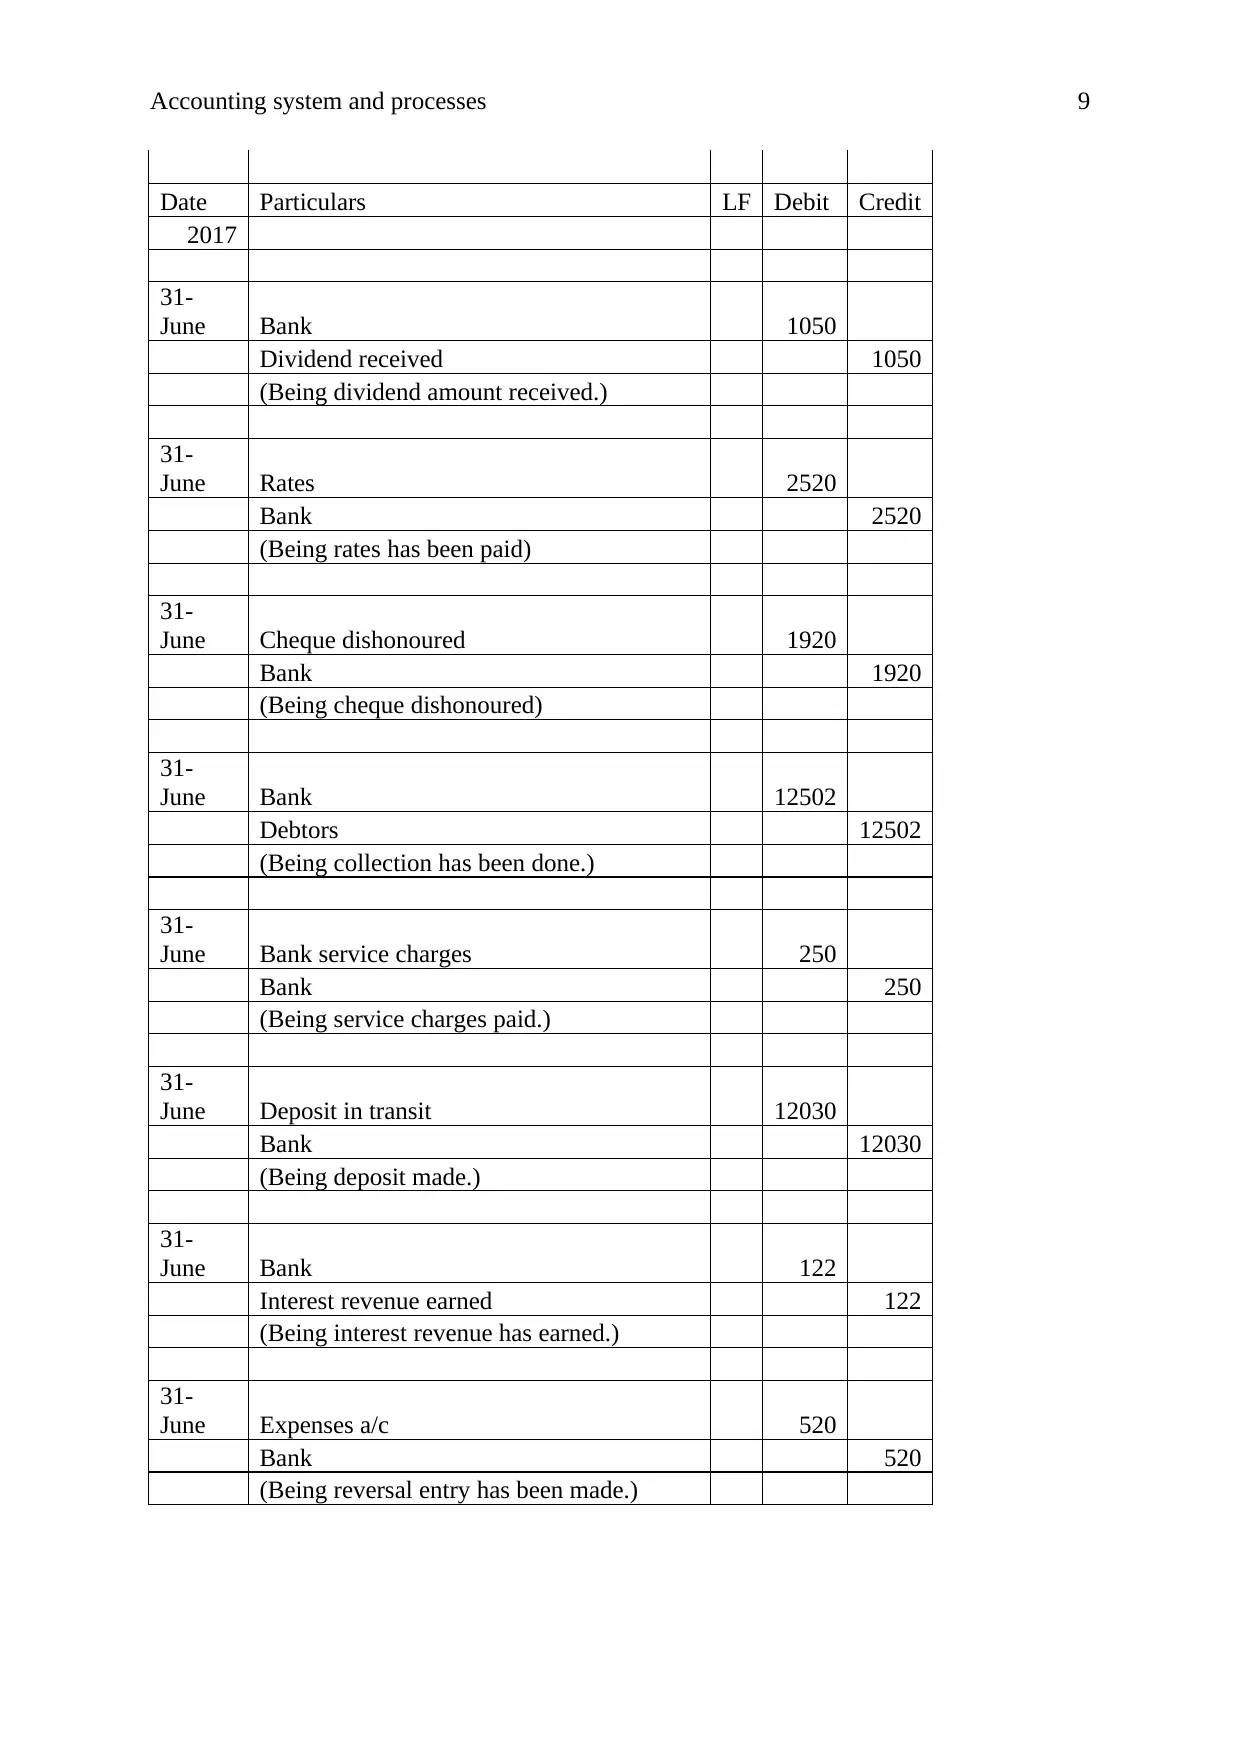
c. Journal entries:
a. Debit and credit balance:
Decrement in bank balance: Bank charges has paid the charges directly which has
reduced the bank balance by $ 50 (Zimmerman & Yahya-Zadeh, 2011).
Decrement in cash balance: Electricity bill has been paid worth $ 50.
b. Bank reconciliation statement:
c. Journal entries:
Paraphrase This Document
Need a fresh take? Get an instant paraphrase of this document with our AI Paraphraser

Accounting system and processes 8
Journal entries
Journal entries
Accounting system and processes 9
Date Particulars LF Debit Credit
2017
31-
June Bank 1050
Dividend received 1050
(Being dividend amount received.)
31-
June Rates 2520
Bank 2520
(Being rates has been paid)
31-
June Cheque dishonoured 1920
Bank 1920
(Being cheque dishonoured)
31-
June Bank 12502
Debtors 12502
(Being collection has been done.)
31-
June Bank service charges 250
Bank 250
(Being service charges paid.)
31-
June Deposit in transit 12030
Bank 12030
(Being deposit made.)
31-
June Bank 122
Interest revenue earned 122
(Being interest revenue has earned.)
31-
June Expenses a/c 520
Bank 520
(Being reversal entry has been made.)
⊘ This is a preview!⊘
Do you want full access?
Subscribe today to unlock all pages.
Trusted by 1+ million students worldwide
Accounting system and processes 10
Part D: Bad debt management and financial decision:
Introduction:
The cocoa coal Amatil is an Australian company. This report has been prepared to
evaluate the debt management and the financial performance of the business in order to
identify the investment position of the company. The report focuses on the financial
statement and changes into the sustainability position of Coca Cola Amatil limited.
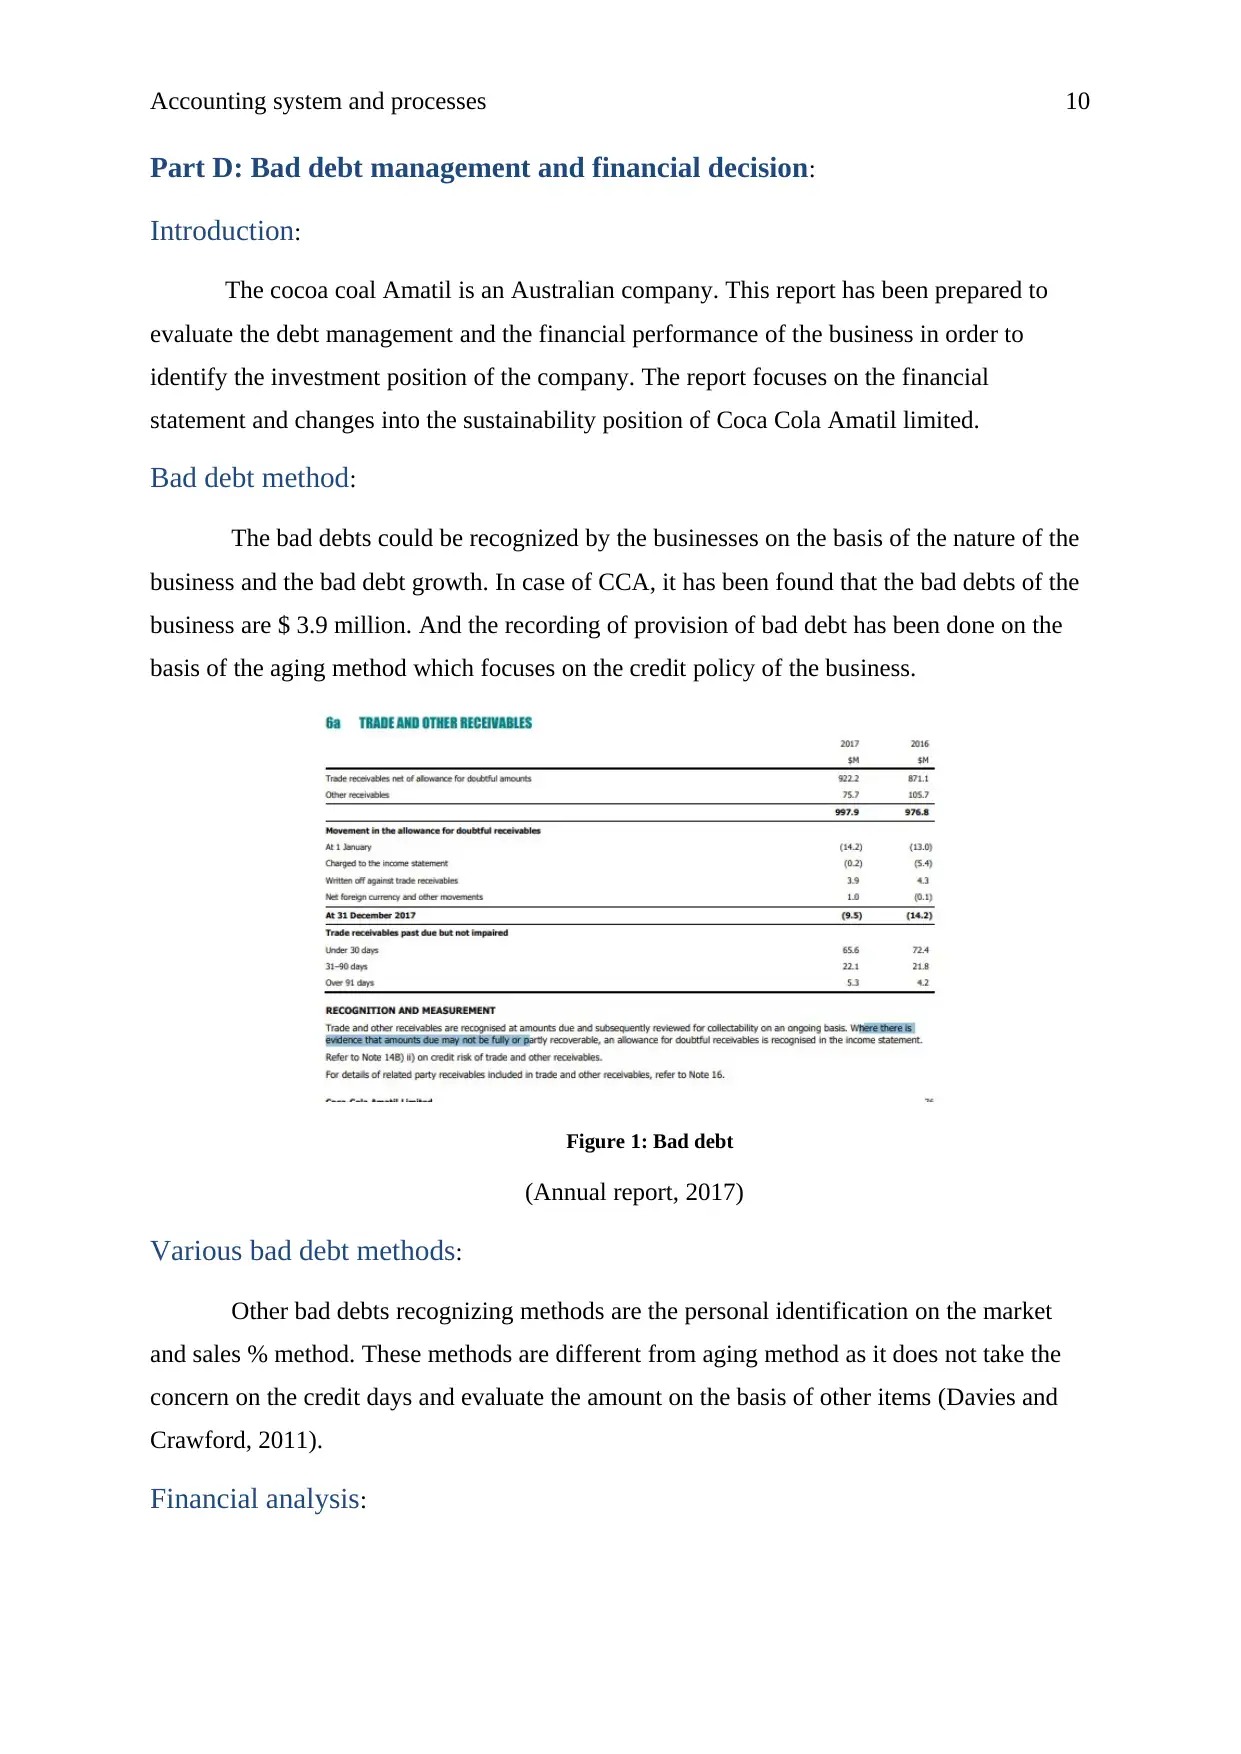
Bad debt method:
The bad debts could be recognized by the businesses on the basis of the nature of the
business and the bad debt growth. In case of CCA, it has been found that the bad debts of the
business are $ 3.9 million. And the recording of provision of bad debt has been done on the
basis of the aging method which focuses on the credit policy of the business.
Figure 1: Bad debt
(Annual report, 2017)
Various bad debt methods:
Other bad debts recognizing methods are the personal identification on the market
and sales % method. These methods are different from aging method as it does not take the
concern on the credit days and evaluate the amount on the basis of other items (Davies and
Crawford, 2011).
Financial analysis:
Part D: Bad debt management and financial decision:
Introduction:
The cocoa coal Amatil is an Australian company. This report has been prepared to
evaluate the debt management and the financial performance of the business in order to
identify the investment position of the company. The report focuses on the financial
statement and changes into the sustainability position of Coca Cola Amatil limited.
Bad debt method:
The bad debts could be recognized by the businesses on the basis of the nature of the
business and the bad debt growth. In case of CCA, it has been found that the bad debts of the
business are $ 3.9 million. And the recording of provision of bad debt has been done on the
basis of the aging method which focuses on the credit policy of the business.
Figure 1: Bad debt
(Annual report, 2017)
Various bad debt methods:
Other bad debts recognizing methods are the personal identification on the market
and sales % method. These methods are different from aging method as it does not take the
concern on the credit days and evaluate the amount on the basis of other items (Davies and
Crawford, 2011).
Financial analysis:
Paraphrase This Document
Need a fresh take? Get an instant paraphrase of this document with our AI Paraphraser
Accounting system and processes 11
The financial ratios have been applied on the business to measure the investment
position of CCA. Profitability, liquidity and capital structure ratios have been applied.
Profitability ratios have been calculated as it explains the profit generation capabilities of the
business and the investment level (Gapenski, 2008). Liquidity ratios have been calculated to
identify the short term debt management and liquidity risk of the business. Market ratios have
been calculated to identify the investment level of the business.
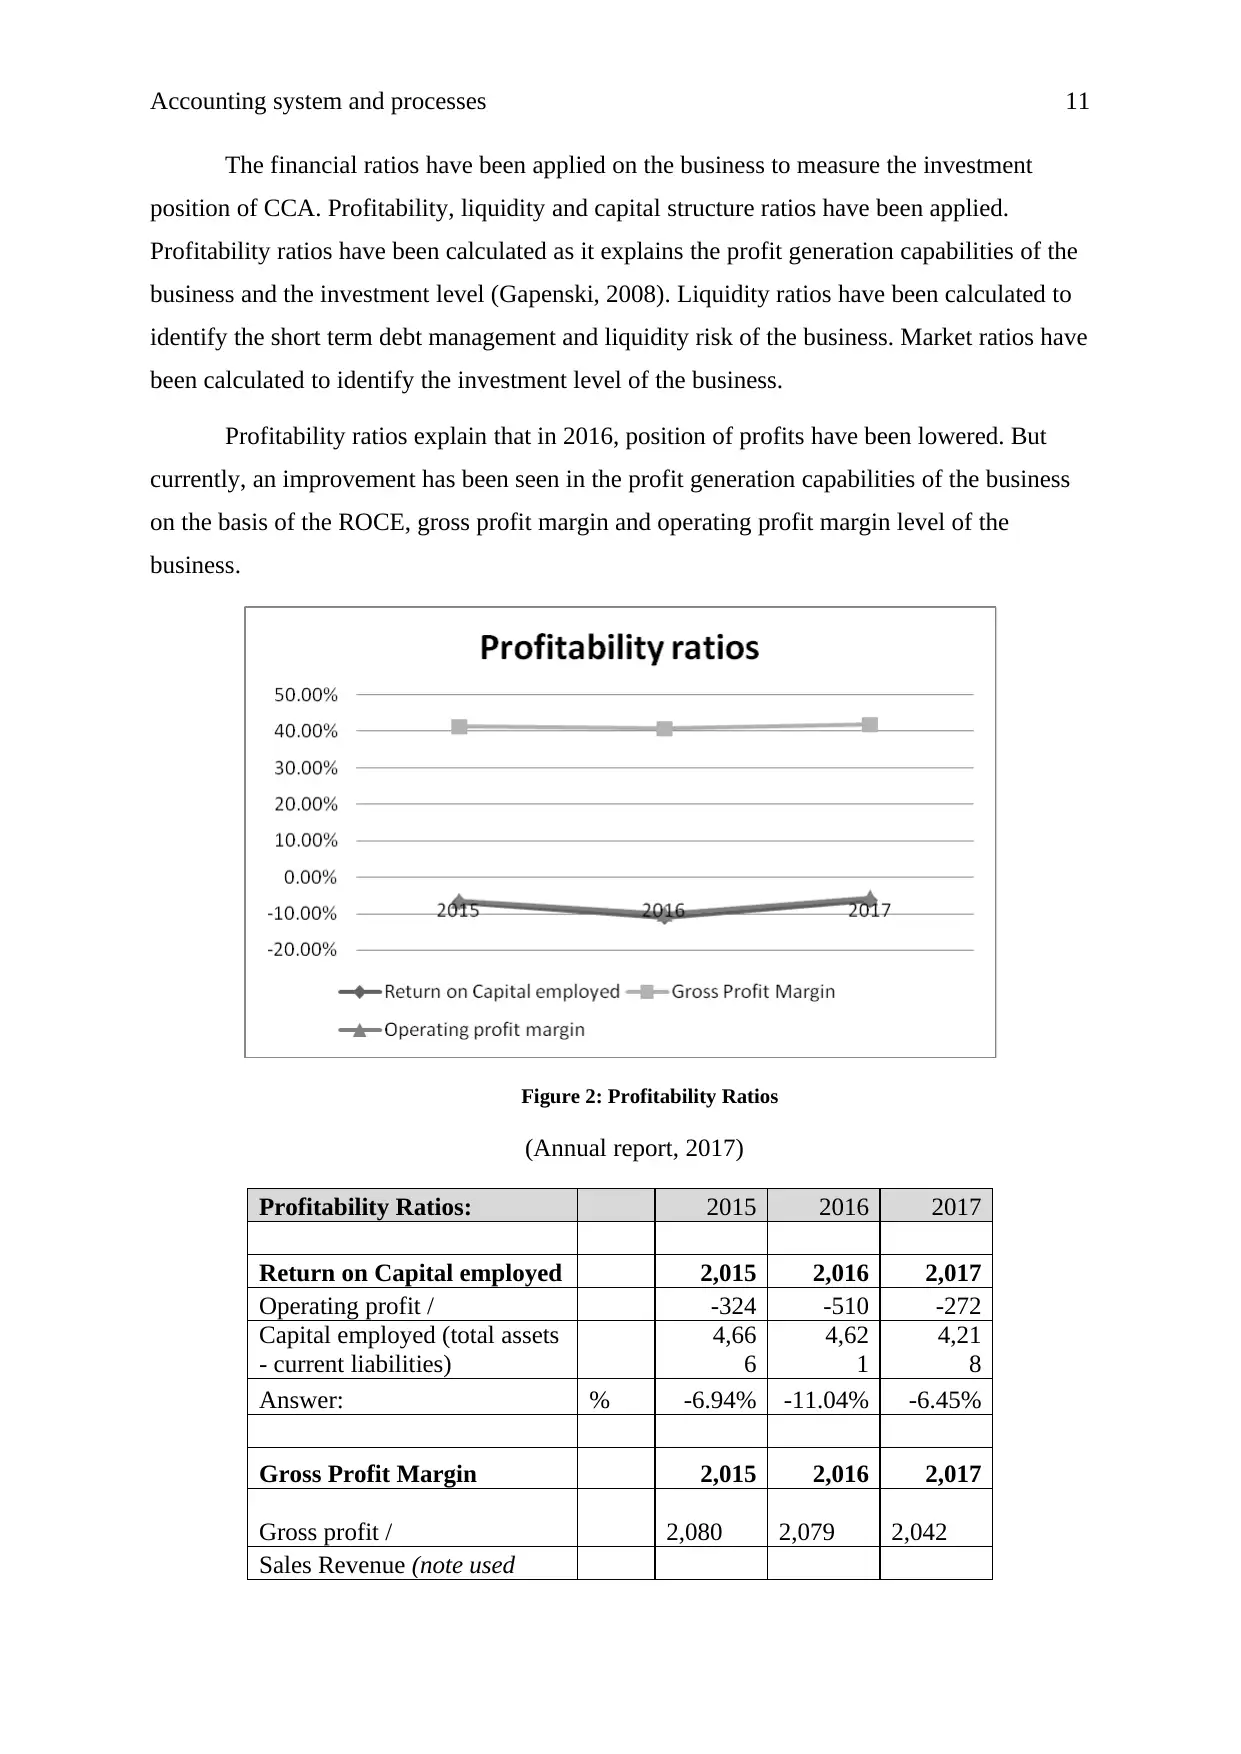
Profitability ratios explain that in 2016, position of profits have been lowered. But
currently, an improvement has been seen in the profit generation capabilities of the business
on the basis of the ROCE, gross profit margin and operating profit margin level of the
business.
Figure 2: Profitability Ratios
(Annual report, 2017)
Profitability Ratios: 2015 2016 2017
Return on Capital employed 2,015 2,016 2,017
Operating profit / -324 -510 -272
Capital employed (total assets
- current liabilities)
4,66
6
4,62
1
4,21
8
Answer: % -6.94% -11.04% -6.45%
Gross Profit Margin 2,015 2,016 2,017
Gross profit / 2,080 2,079 2,042
Sales Revenue (note used
The financial ratios have been applied on the business to measure the investment
position of CCA. Profitability, liquidity and capital structure ratios have been applied.
Profitability ratios have been calculated as it explains the profit generation capabilities of the
business and the investment level (Gapenski, 2008). Liquidity ratios have been calculated to
identify the short term debt management and liquidity risk of the business. Market ratios have
been calculated to identify the investment level of the business.
Profitability ratios explain that in 2016, position of profits have been lowered. But
currently, an improvement has been seen in the profit generation capabilities of the business
on the basis of the ROCE, gross profit margin and operating profit margin level of the
business.
Figure 2: Profitability Ratios
(Annual report, 2017)
Profitability Ratios: 2015 2016 2017
Return on Capital employed 2,015 2,016 2,017
Operating profit / -324 -510 -272
Capital employed (total assets
- current liabilities)
4,66
6
4,62
1
4,21
8
Answer: % -6.94% -11.04% -6.45%
Gross Profit Margin 2,015 2,016 2,017
Gross profit / 2,080 2,079 2,042
Sales Revenue (note used
Accounting system and processes 12
operating revenue) 5,033 5,091 4,881
Answer: 41.3% 40.8% 41.8%
Operating profit margin 2,015 2,016 2,017
Operating profit / -324 -510 -272
Sales Revenue % 5,033 5,091 4,881
Answer: -6.44% -10.02% -5.57%
(Annual report, 2017)
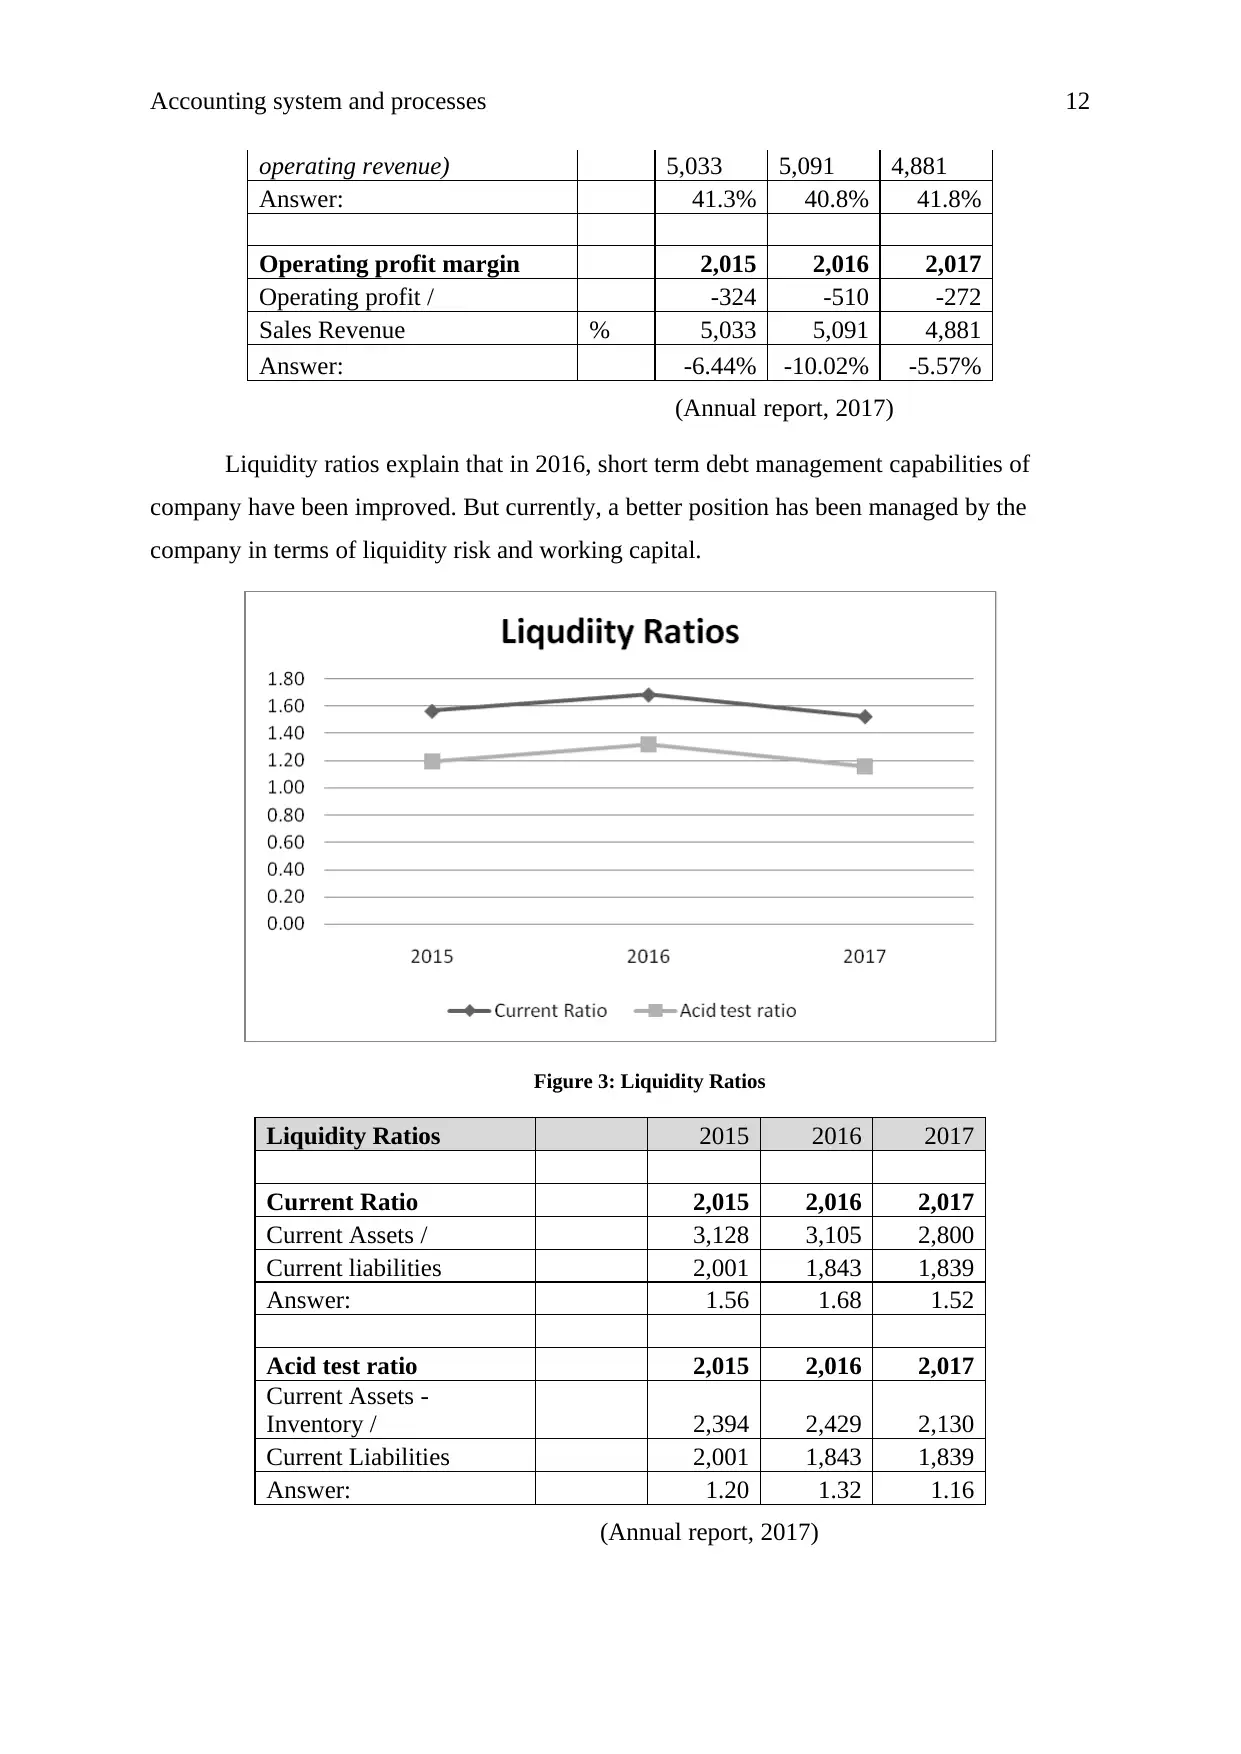
Liquidity ratios explain that in 2016, short term debt management capabilities of
company have been improved. But currently, a better position has been managed by the
company in terms of liquidity risk and working capital.
Figure 3: Liquidity Ratios
Liquidity Ratios 2015 2016 2017
Current Ratio 2,015 2,016 2,017
Current Assets / 3,128 3,105 2,800
Current liabilities 2,001 1,843 1,839
Answer: 1.56 1.68 1.52
Acid test ratio 2,015 2,016 2,017
Current Assets -
Inventory / 2,394 2,429 2,130
Current Liabilities 2,001 1,843 1,839
Answer: 1.20 1.32 1.16
(Annual report, 2017)
operating revenue) 5,033 5,091 4,881
Answer: 41.3% 40.8% 41.8%
Operating profit margin 2,015 2,016 2,017
Operating profit / -324 -510 -272
Sales Revenue % 5,033 5,091 4,881
Answer: -6.44% -10.02% -5.57%
(Annual report, 2017)
Liquidity ratios explain that in 2016, short term debt management capabilities of
company have been improved. But currently, a better position has been managed by the
company in terms of liquidity risk and working capital.
Figure 3: Liquidity Ratios
Liquidity Ratios 2015 2016 2017
Current Ratio 2,015 2,016 2,017
Current Assets / 3,128 3,105 2,800
Current liabilities 2,001 1,843 1,839
Answer: 1.56 1.68 1.52
Acid test ratio 2,015 2,016 2,017
Current Assets -
Inventory / 2,394 2,429 2,130
Current Liabilities 2,001 1,843 1,839
Answer: 1.20 1.32 1.16
(Annual report, 2017)
⊘ This is a preview!⊘
Do you want full access?
Subscribe today to unlock all pages.
Trusted by 1+ million students worldwide
1 out of 15
Related Documents


Your All-in-One AI-Powered Toolkit for Academic Success.
+13062052269
info@desklib.com
Available 24*7 on WhatsApp / Email
![[object Object]](/_next/static/media/star-bottom.7253800d.svg)
Unlock your academic potential
Copyright © 2020–2026 A2Z Services. All Rights Reserved. Developed and managed by ZUCOL.