Accounting Systems and Processes - Fall 2024 Assignment Solution

Verified

Added on  2019/10/30

|28
|3602
|156
Homework Assignment
AI Summary
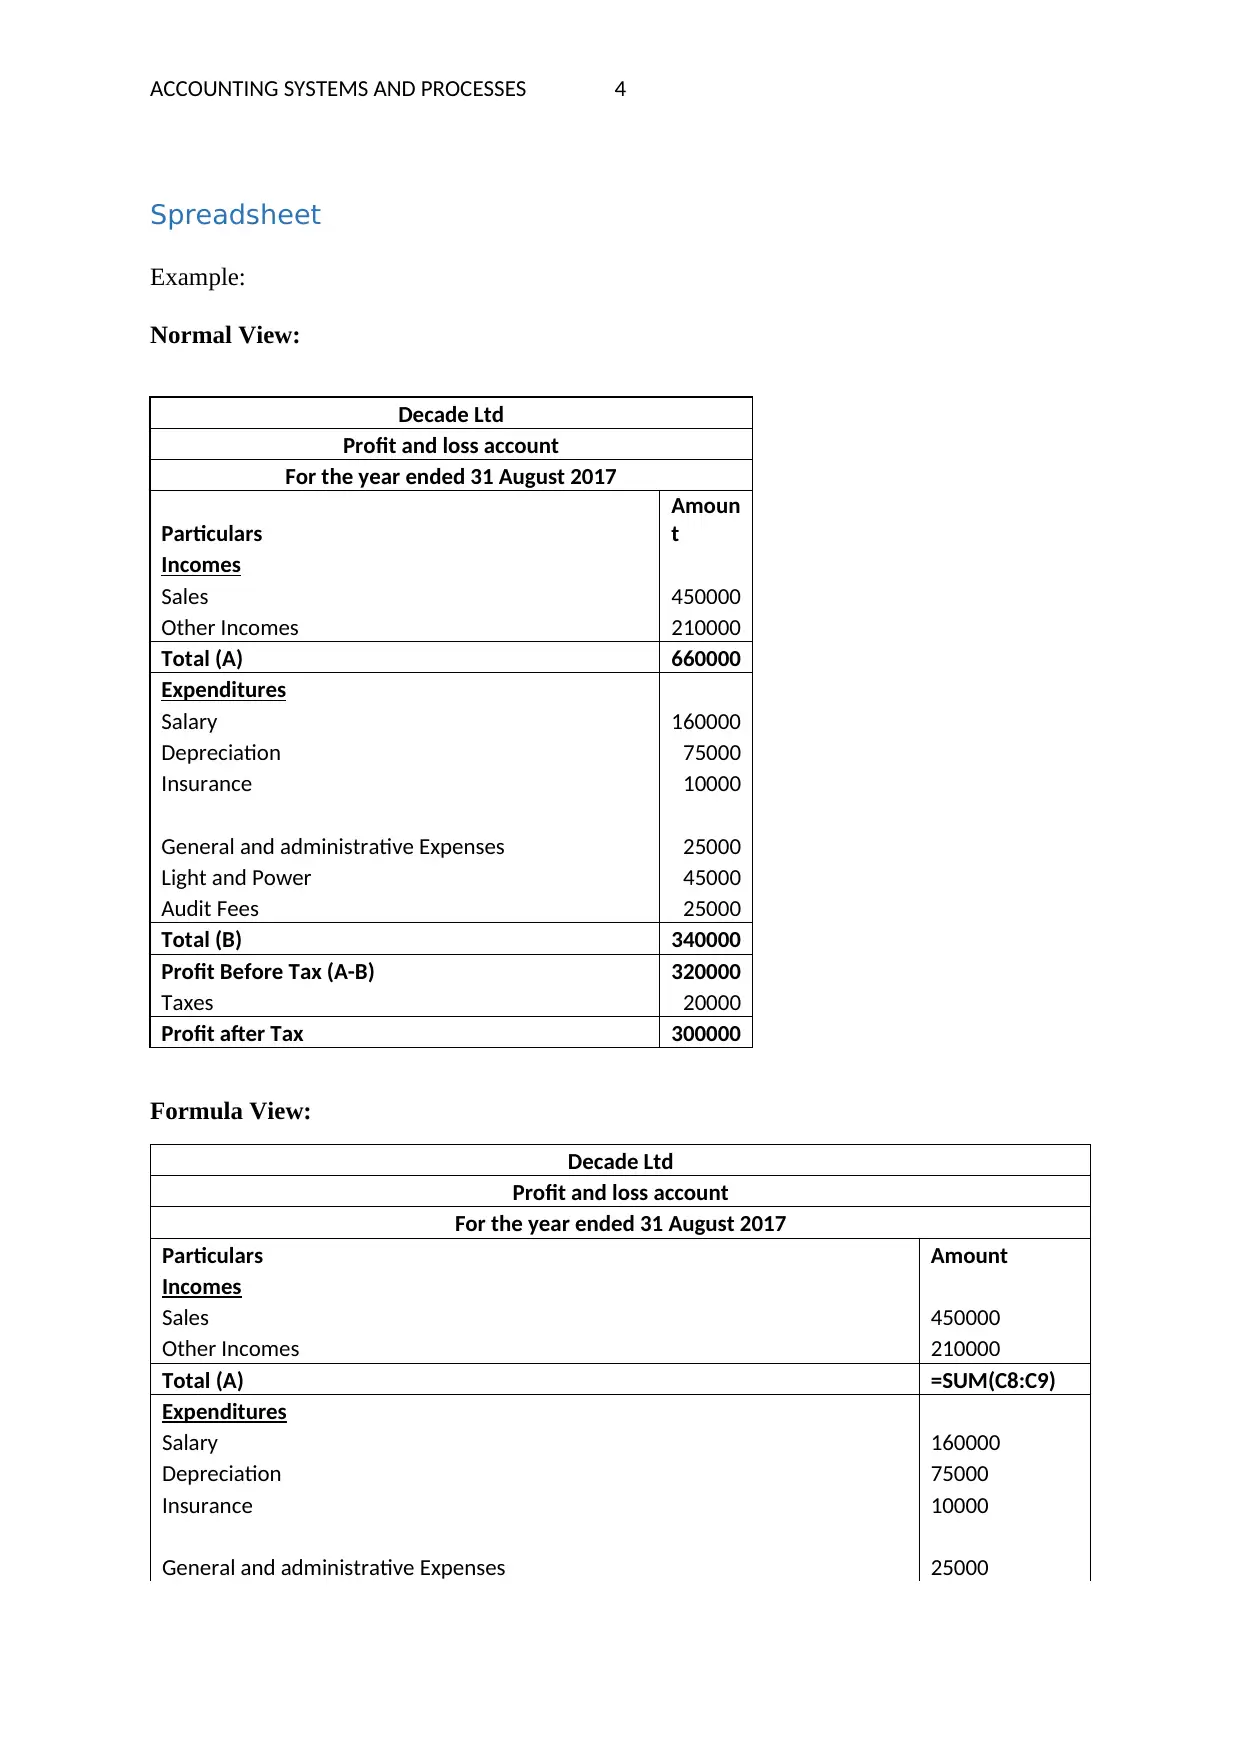
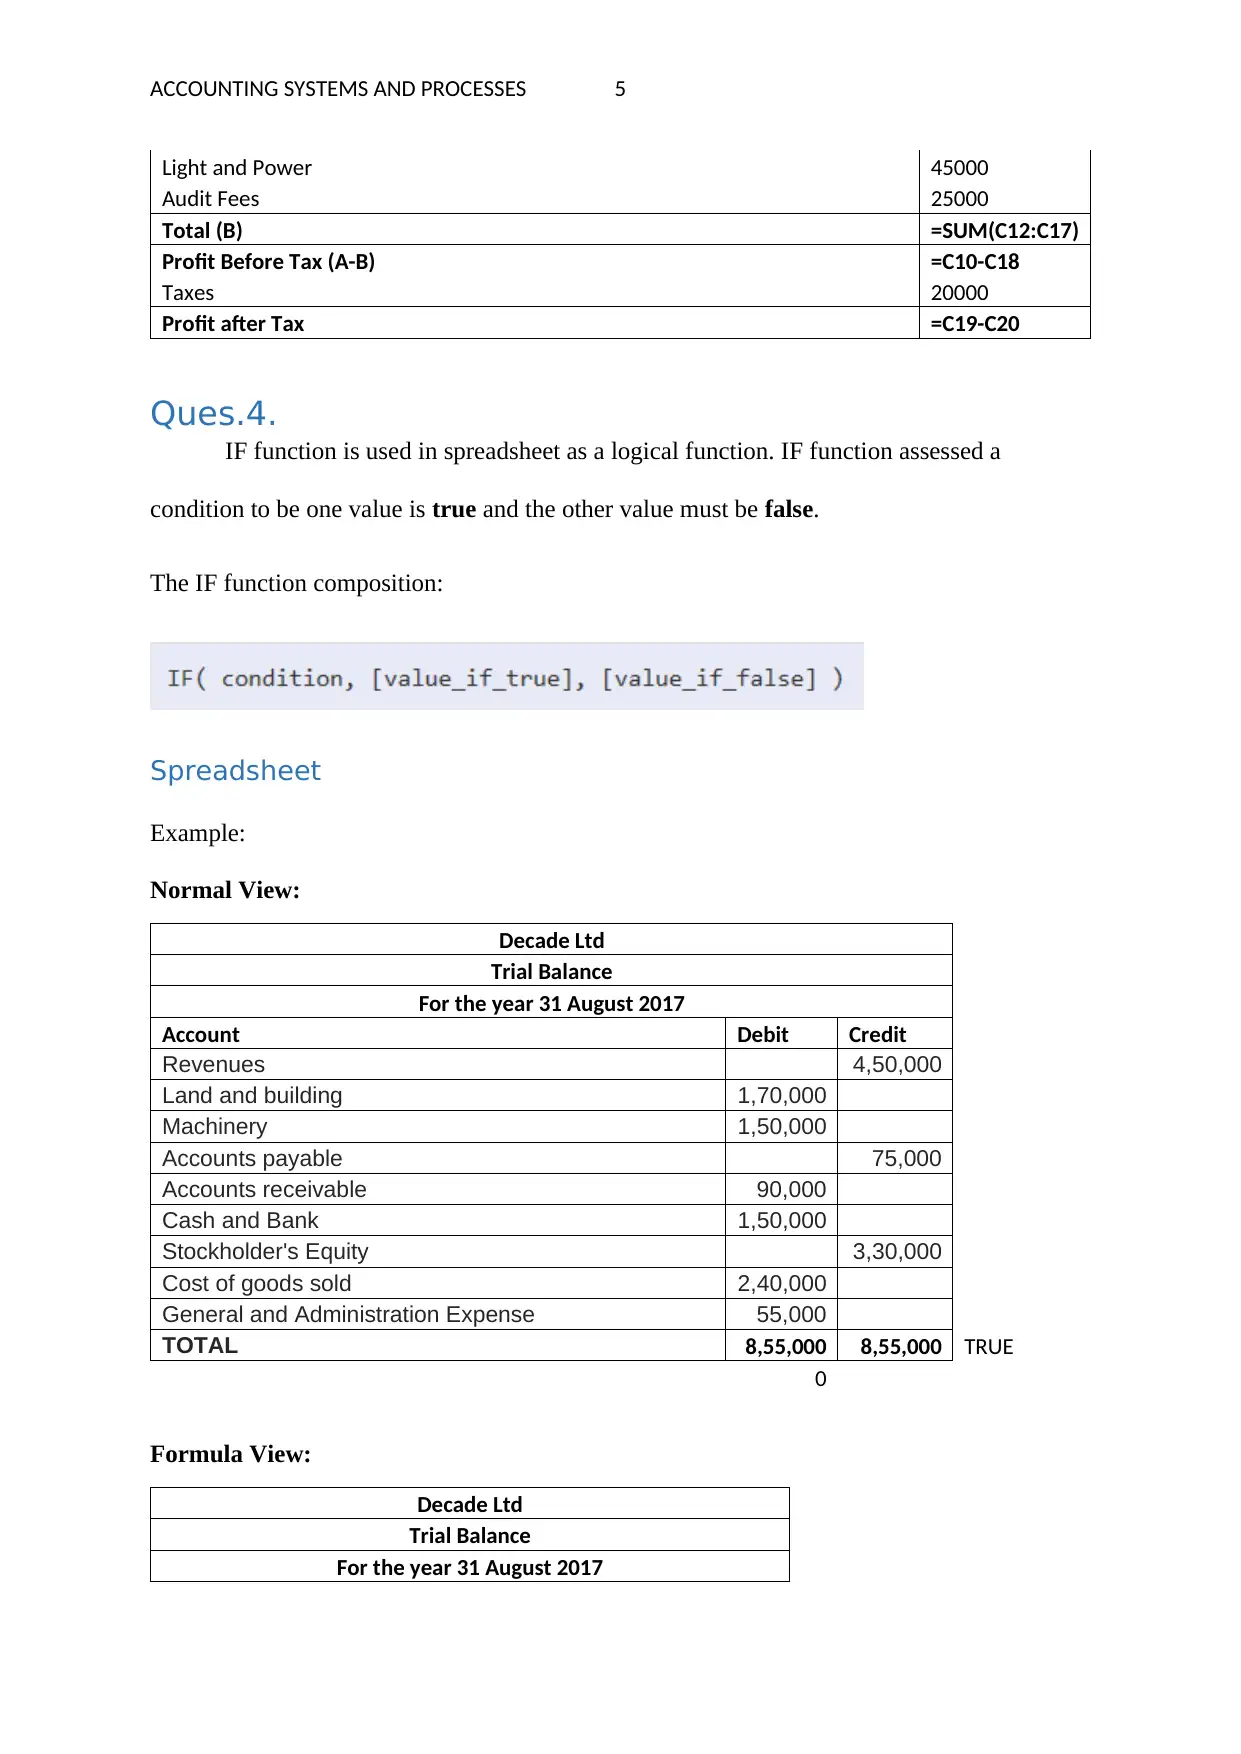
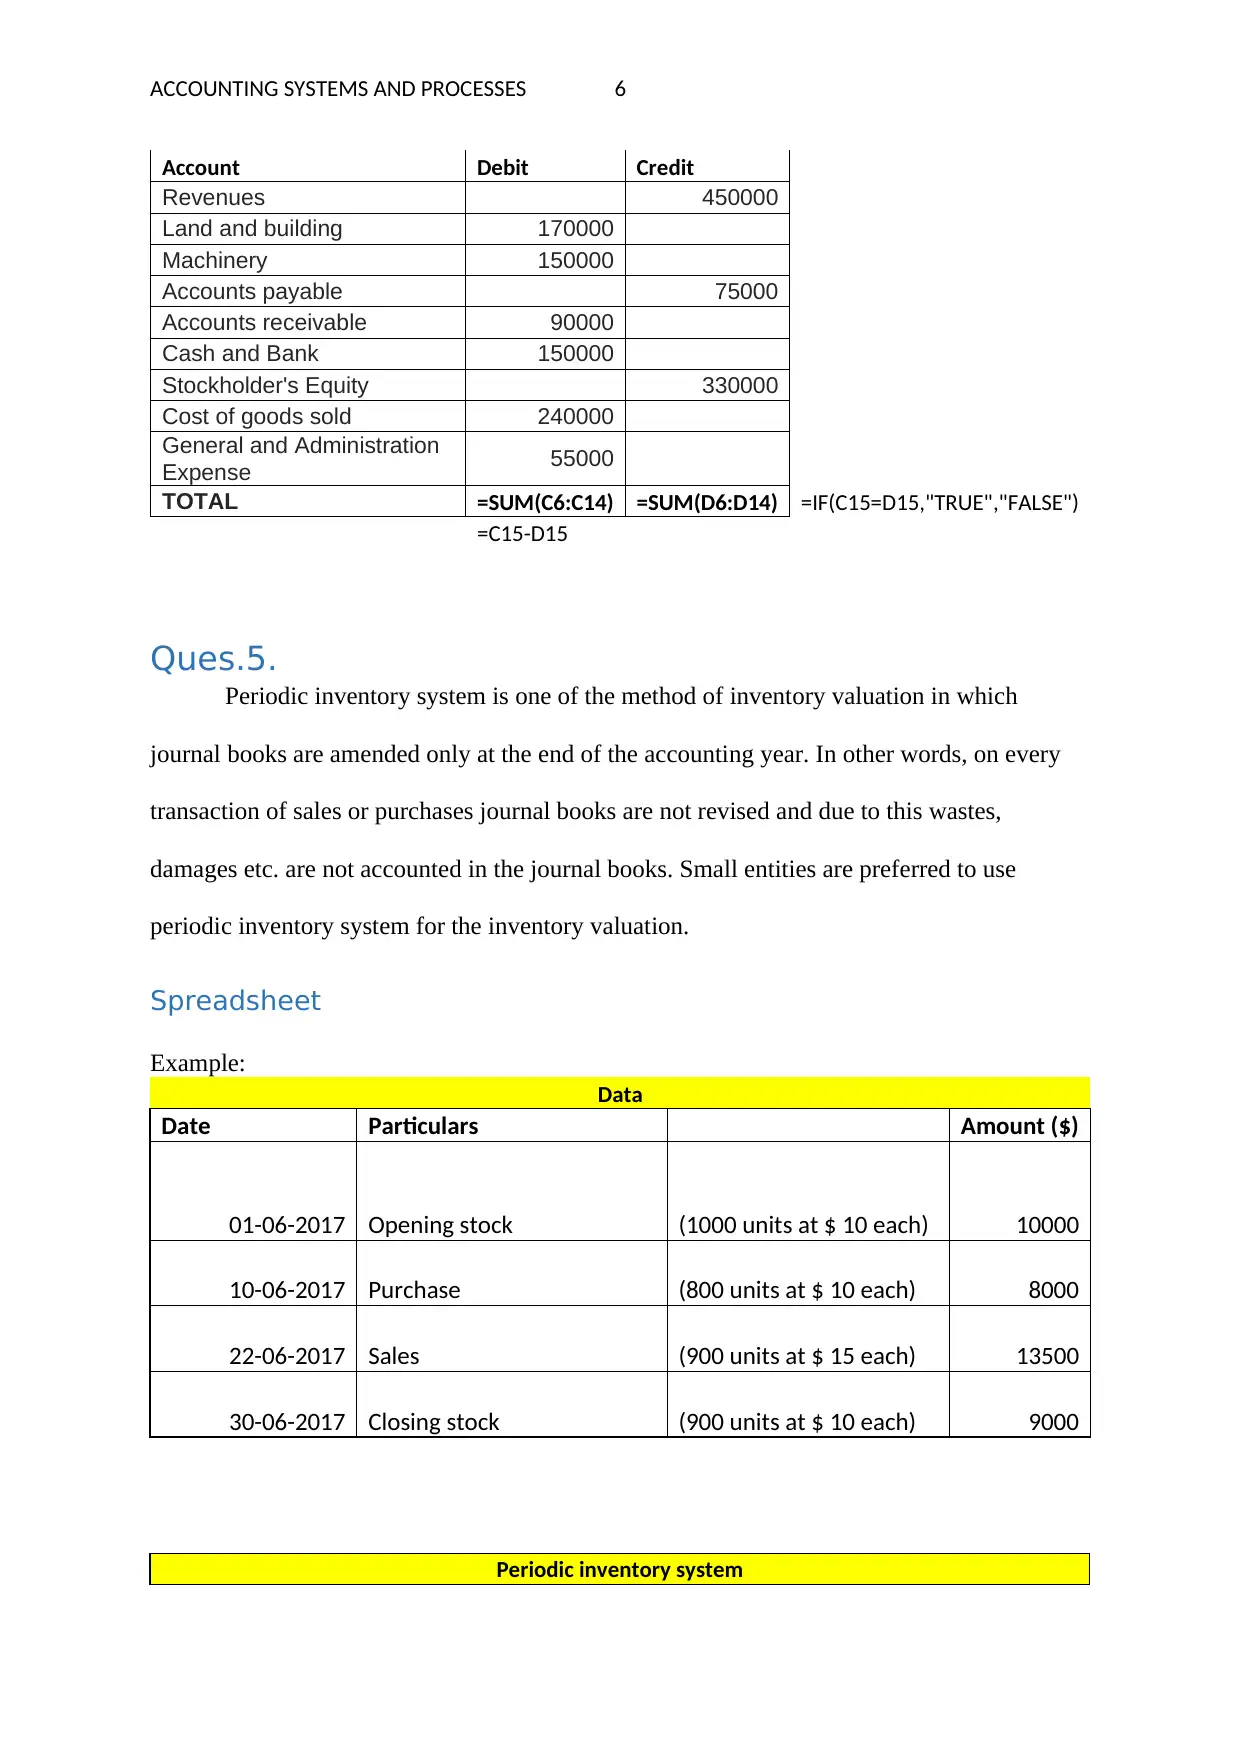
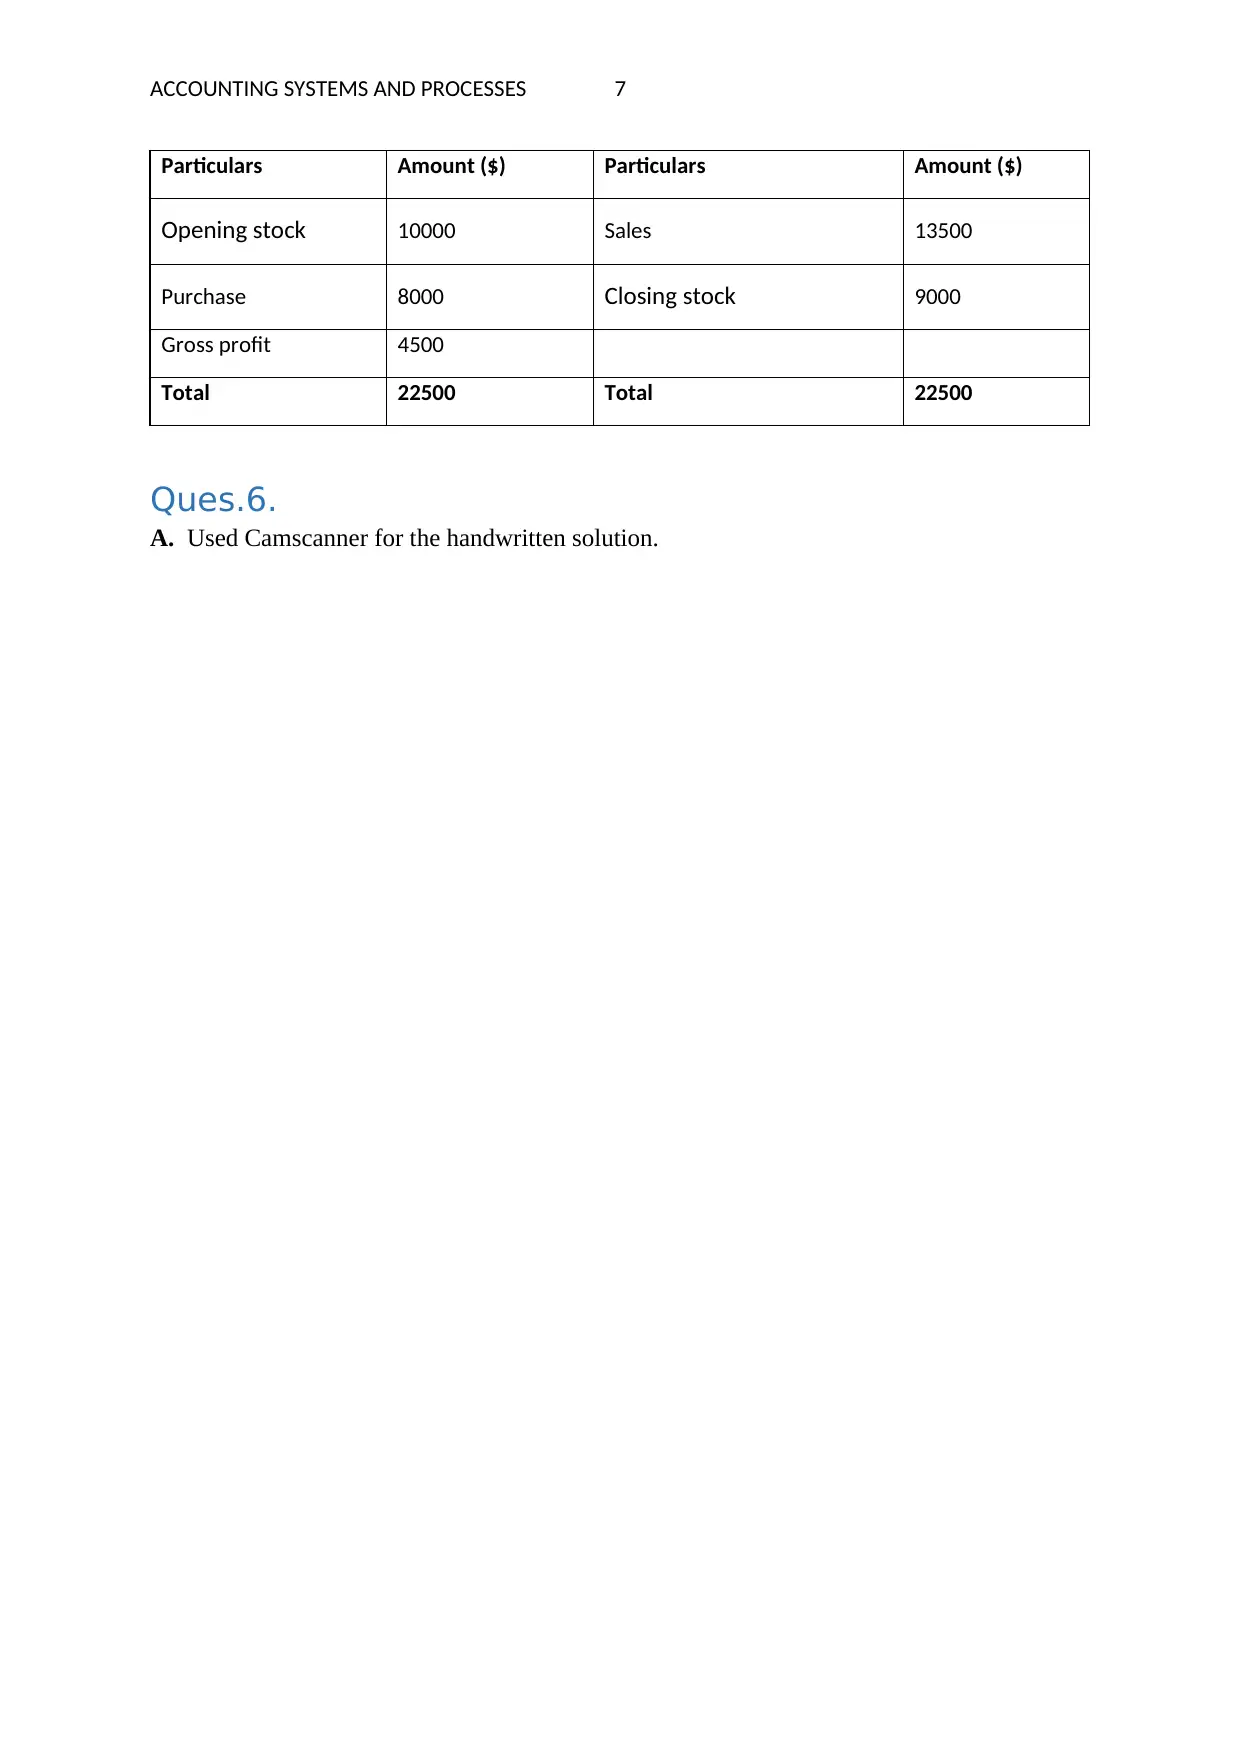
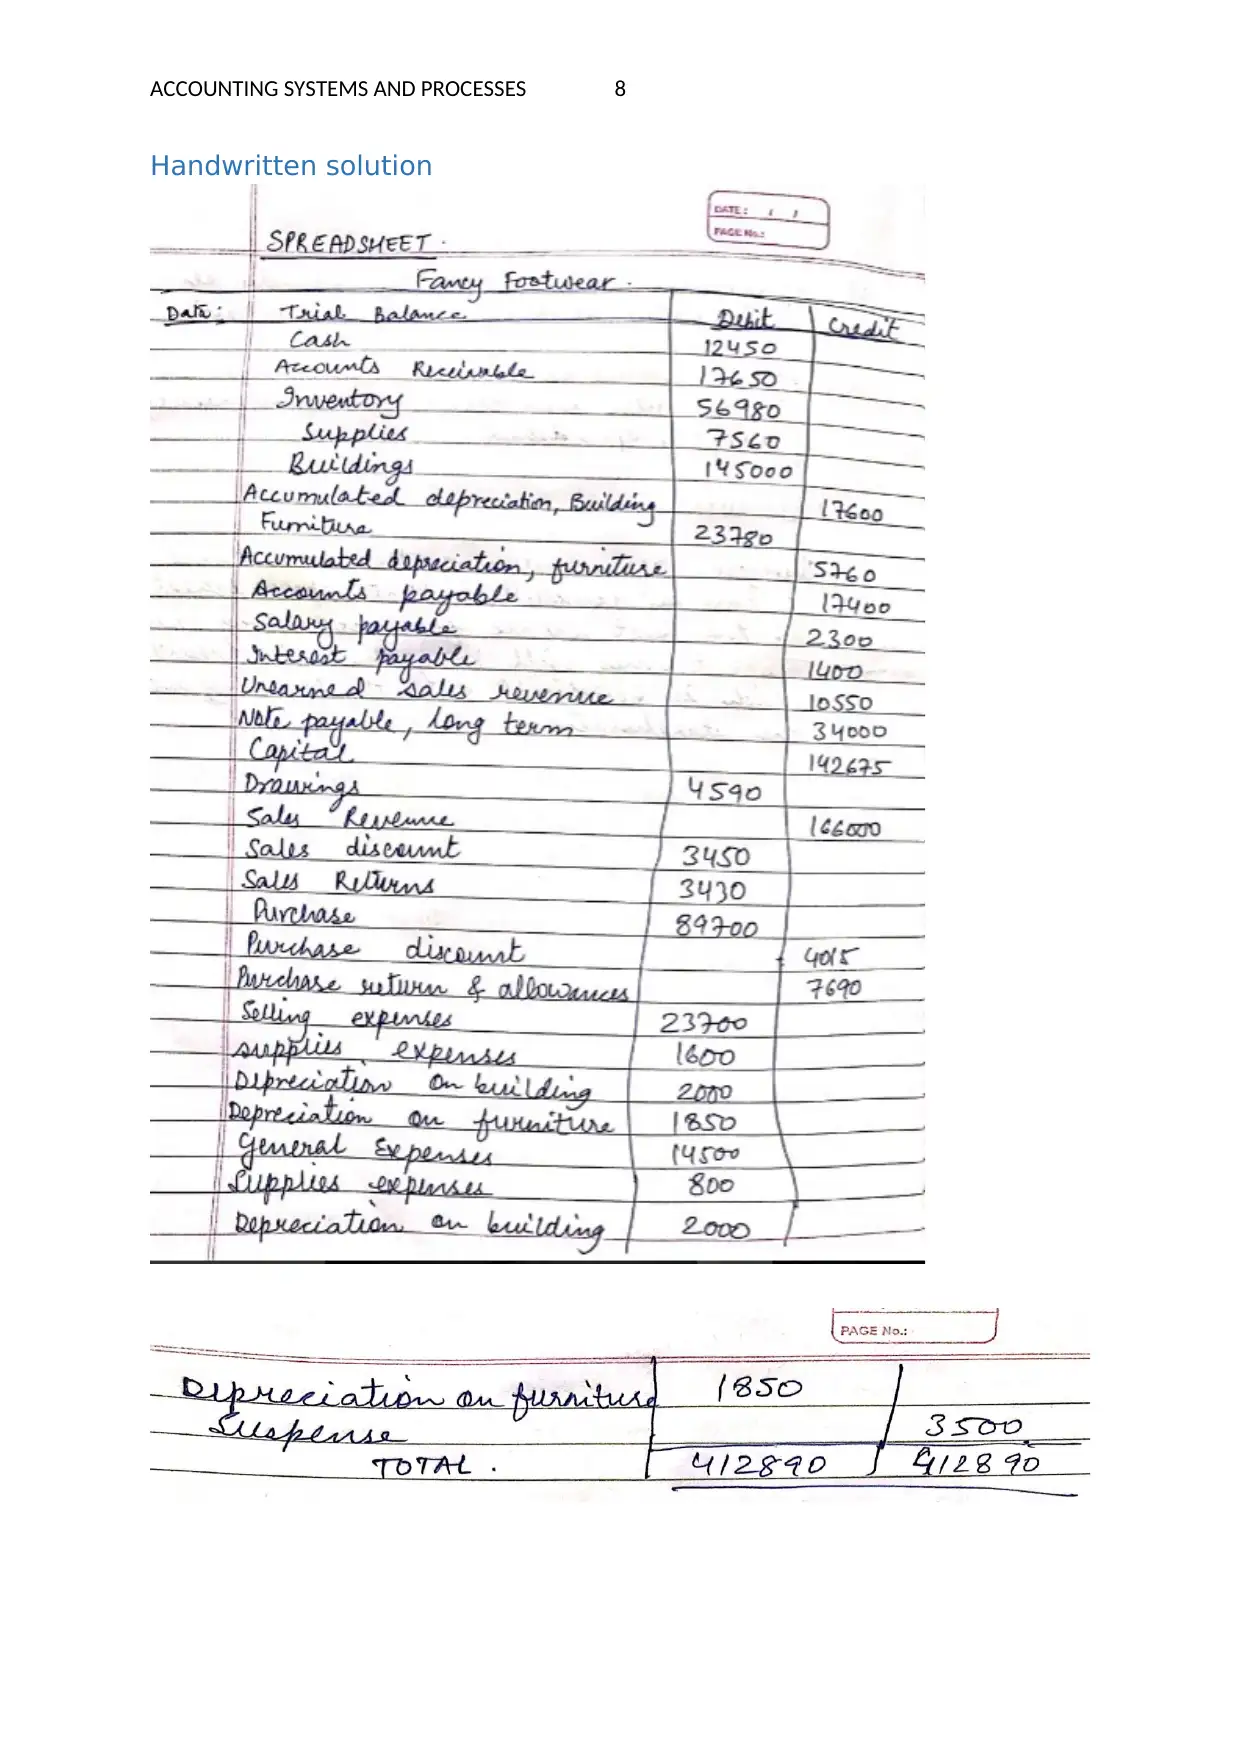
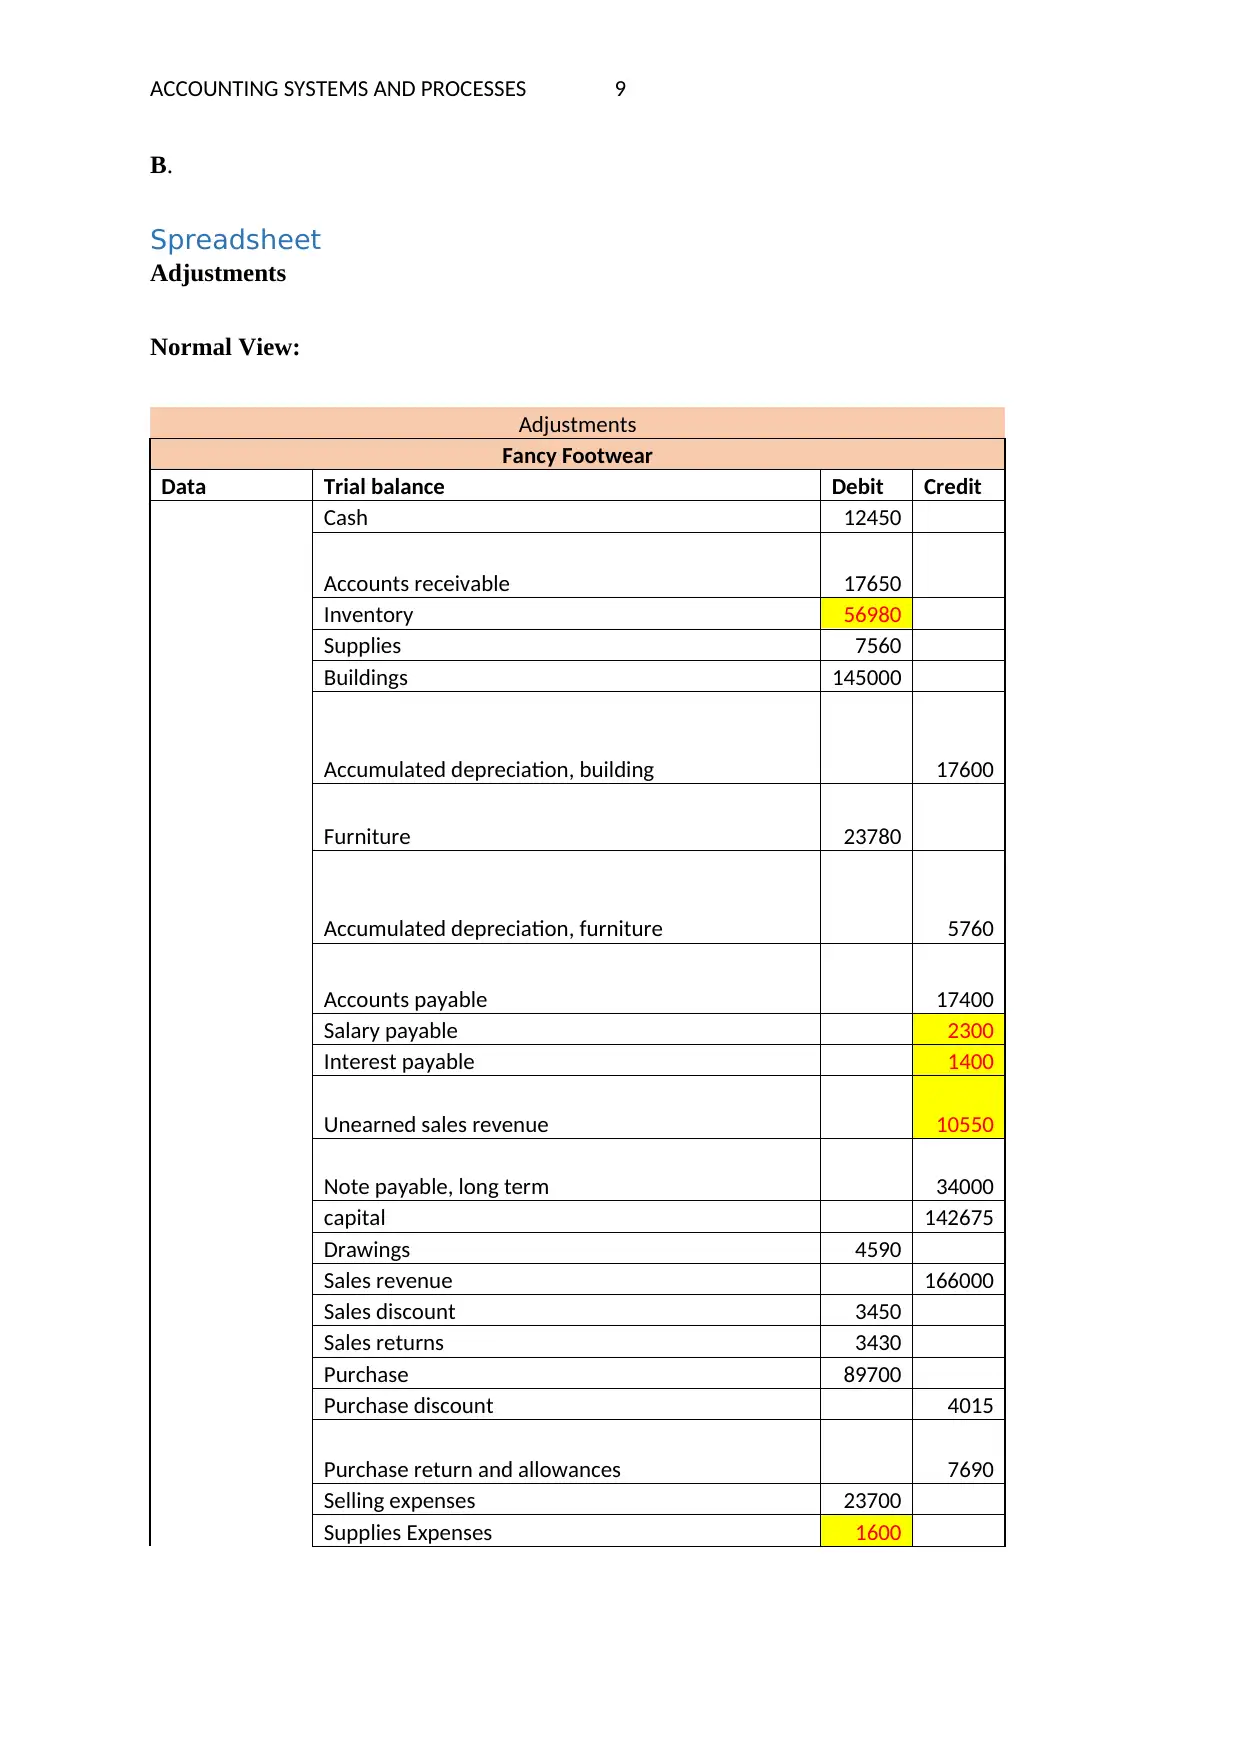
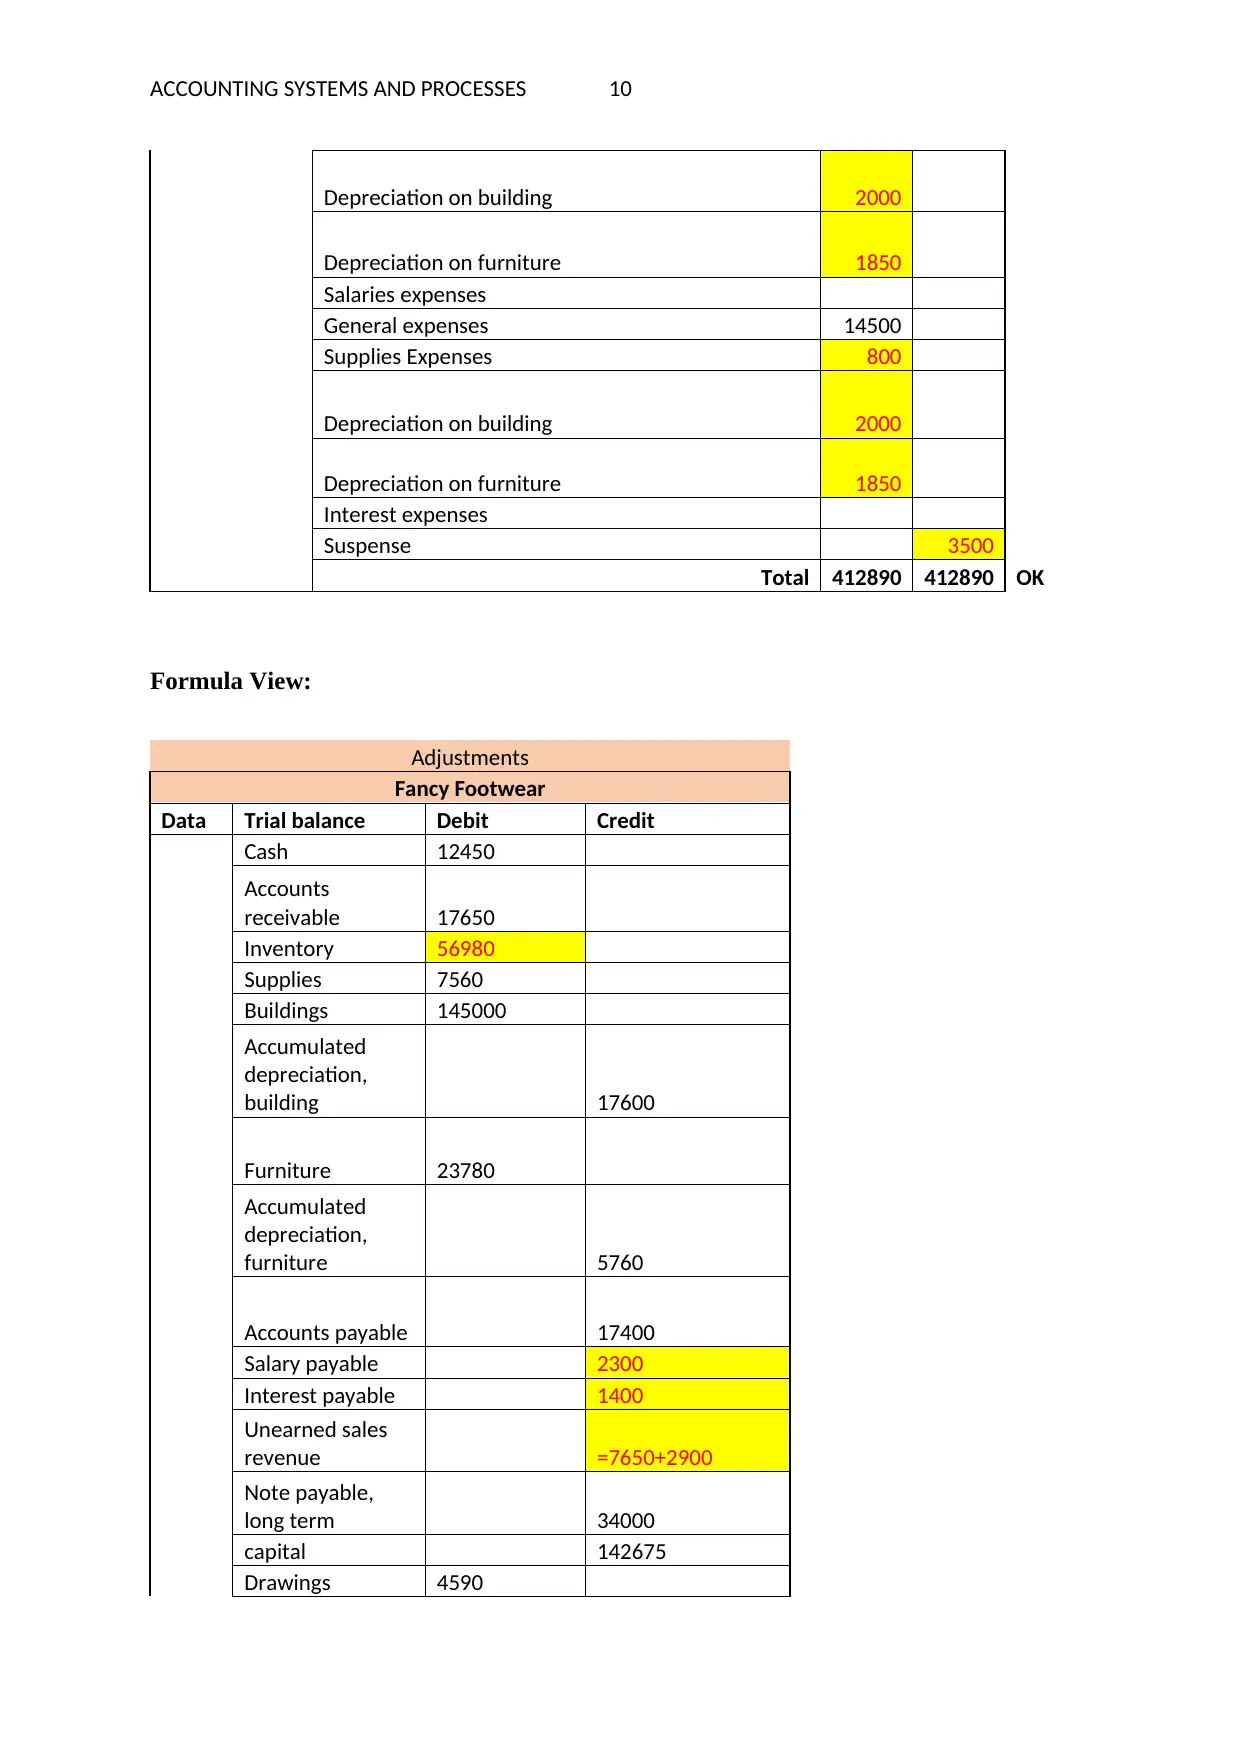
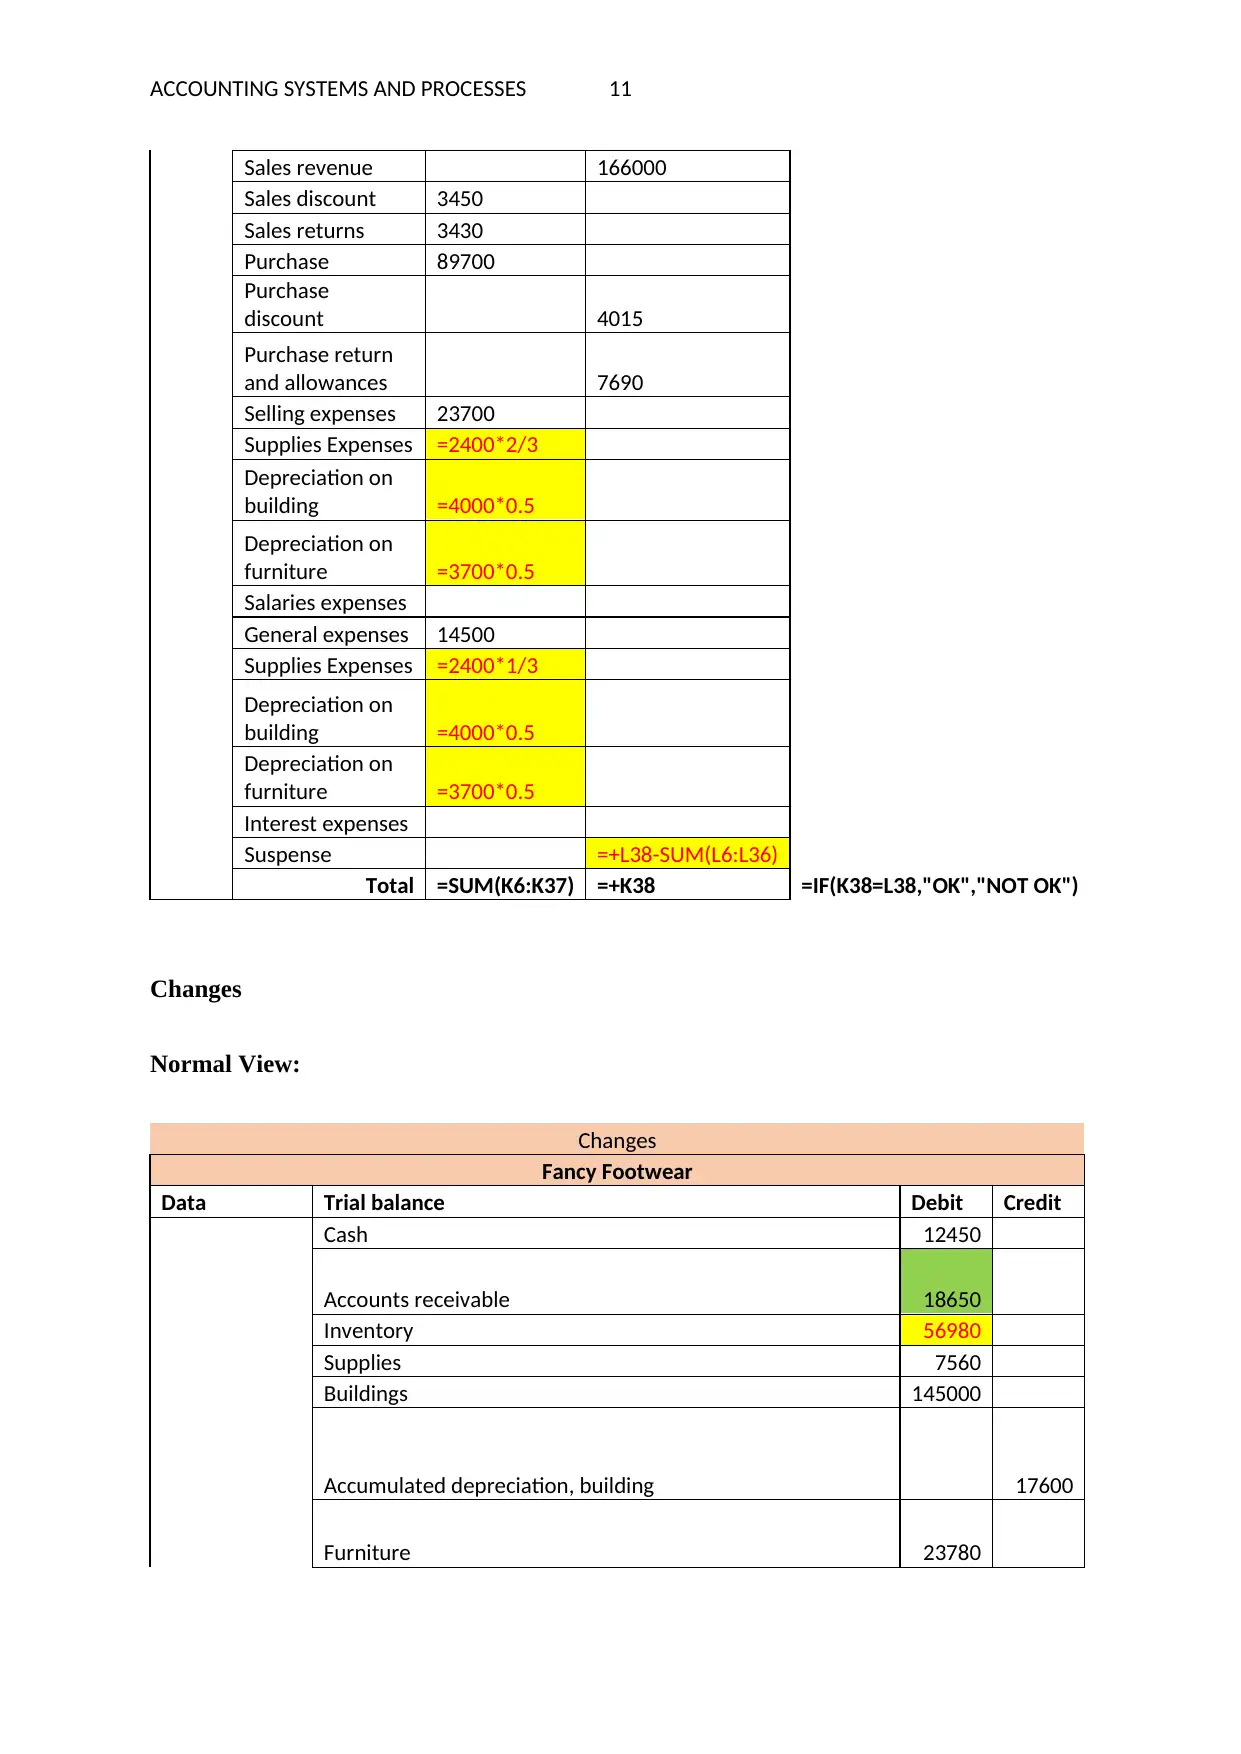
This assignment solution delves into various aspects of accounting systems and processes, utilizing spreadsheets for financial analysis and reporting. It covers topics like cell referencing, displaying negative numbers, separating data entry and report areas, and using the IF function. The solution provides examples and calculations related to periodic inventory systems, trial balances, and adjustments. Furthermore, the assignment includes a report discussing the advantages of spreadsheets in accountancy, such as ease of data manipulation, the use of formulas, and the creation of charts and graphs. The solution also explores inventory valuation methods, including average cost, LIFO, and FIFO, with detailed calculations and comparisons of their impacts on cost of goods sold and gross profit. The assignment highlights the practical application of accounting principles and spreadsheet tools for financial management and analysis.
Document Page
RUNNING HEAD: ACCOUNTING SYSTEMS AND PROCESSES
ACCOUNTING SYSTEMS AND PROCESSES
tabler-icon-diamond-filled.svg

Secure Best Marks with AI Grader

Need help grading? Try our AI Grader for instant feedback on your assignments.
Document Page
ACCOUNTING SYSTEMS AND PROCESSES 1
Contents
Ques.1...................................................................................................................................................2
Spreadsheet.......................................................................................................................................2
Ques.2...................................................................................................................................................2
Spreadsheet.......................................................................................................................................3
Ques.3...................................................................................................................................................3
Spreadsheet.......................................................................................................................................4
Ques.4...................................................................................................................................................5
Spreadsheet.......................................................................................................................................5
Ques.5...................................................................................................................................................6
Spreadsheet.......................................................................................................................................6
Ques.6...................................................................................................................................................7
Handwritten solution.........................................................................................................................8
Spreadsheet.......................................................................................................................................9
Report..............................................................................................................................................14
Ques.7.................................................................................................................................................15
Original Version...............................................................................................................................15
Second Version................................................................................................................................18
Ques.8.................................................................................................................................................20
Ques.9.................................................................................................................................................22
Ques.10...............................................................................................................................................24
Ques.11...............................................................................................................................................25
Ques.12...............................................................................................................................................26
Ques.13...............................................................................................................................................27
Document Page
ACCOUNTING SYSTEMS AND PROCESSES 2
Ques.1.
Replacement of cell reference with names in workbook is used just to make it
understandable to the common man without requiring any knowledge of using excel
functions. Further this function is used to grasp the knowledge of formula used. With the
availability of this function any individual can compact the data as well as scrutinize the data
in a very short span of time. In addition to this, identification of figures or data can also be
done with the naming cells in workbook. Below mentioned is an example of using naming
cells in workbook:
Example No name With name
Table D4:D22 =Halfyearlyexpenditures
Reference =SUM(A1:A22) =SUM(Halfyearlyrevenues)
Spreadsheet
Example:
Normal View:
Owners’ Equity Liabilities Assets
585000 86000 671000
Formula View:
Owners’ Equity Liabilities Assets
585000 86000 =Owners_Equity+Liabilities
Ques.2.
There are many reasons of displaying negative numbers in brackets. These are:
putting minus sign just before figures, applying red colour to the figures, putting brackets to
the figures etc. In spreadsheet, brackets are termed as parentheses and denoted as (). But for
the accountancy purpose, the accountant of the company when prepares financial report he
puts brackets to the figures in order to denote credit amounts. This method is a
Document Page
ACCOUNTING SYSTEMS AND PROCESSES 3
conventional/traditional method of using brackets for denoting credit amounts or negative
amounts. Moreover, any user of financial instruments can easily identify the negative figures
by looking at the brackets.
Spreadsheet
Example:
Particulars Amount ($)
Gross Profit $ 10,00,000.00
Operating Expenses ($5,40,000.00)
EBIT [gross profit –
operating expenses] $ 4,60,000.00
Interest ($2,50,000.00)
EBT [EBIT – Interest] $ 2,10,000.00
Taxes ($50,000.00)
Profit after tax [EBT – Taxes] $ 1,60,000.00
Ques.3.
Separation of data entry area and report area is required because to display the crystal
view about the entity’s financial report and it is very useful for the accountant of the entity to
enter lakhs of data and also for the purpose of extensive computations in a workbook with the
help of using the formulae’s and other function keys in a very short span of time and also the
data entered will be accurate and reliable because of using the inbuilt formulae’s. Further
addition to this, if any wrong data has mistakenly inserted will be easily deleted plus any
proposed data can be easily added without any strain.
Hence for gaining the benefits and advantages, accountant of the company should
always design spreadsheets with a completely separate data entry area and separate report
area.
tabler-icon-diamond-filled.svg

Secure Best Marks with AI Grader

Need help grading? Try our AI Grader for instant feedback on your assignments.
Document Page
ACCOUNTING SYSTEMS AND PROCESSES 4
Spreadsheet
Example:
Normal View:
Decade Ltd
Profit and loss account
For the year ended 31 August 2017
Particulars
Amoun
t
Incomes
Sales 450000
Other Incomes 210000
Total (A) 660000
Expenditures
Salary 160000
Depreciation 75000
Insurance 10000
General and administrative Expenses 25000
Light and Power 45000
Audit Fees 25000
Total (B) 340000
Profit Before Tax (A-B) 320000
Taxes 20000
Profit after Tax 300000
Formula View:
Decade Ltd
Profit and loss account
For the year ended 31 August 2017
Particulars Amount
Incomes
Sales 450000
Other Incomes 210000
Total (A) =SUM(C8:C9)
Expenditures
Salary 160000
Depreciation 75000
Insurance 10000
General and administrative Expenses 25000
Document Page
ACCOUNTING SYSTEMS AND PROCESSES 5
Light and Power 45000
Audit Fees 25000
Total (B) =SUM(C12:C17)
Profit Before Tax (A-B) =C10-C18
Taxes 20000
Profit after Tax =C19-C20
Ques.4.
IF function is used in spreadsheet as a logical function. IF function assessed a
condition to be one value is true and the other value must be false.
The IF function composition:
Spreadsheet
Example:
Normal View:
Decade Ltd
Trial Balance
For the year 31 August 2017
Account Debit Credit
Revenues 4,50,000
Land and building 1,70,000
Machinery 1,50,000
Accounts payable 75,000
Accounts receivable 90,000
Cash and Bank 1,50,000
Stockholder's Equity 3,30,000
Cost of goods sold 2,40,000
General and Administration Expense 55,000
TOTAL 8,55,000 8,55,000 TRUE
0
Formula View:
Decade Ltd
Trial Balance
For the year 31 August 2017
Document Page
ACCOUNTING SYSTEMS AND PROCESSES 6
Account Debit Credit
Revenues 450000
Land and building 170000
Machinery 150000
Accounts payable 75000
Accounts receivable 90000
Cash and Bank 150000
Stockholder's Equity 330000
Cost of goods sold 240000
General and Administration
Expense 55000
TOTAL =SUM(C6:C14) =SUM(D6:D14) =IF(C15=D15,"TRUE","FALSE")
=C15-D15
Ques.5.
Periodic inventory system is one of the method of inventory valuation in which
journal books are amended only at the end of the accounting year. In other words, on every
transaction of sales or purchases journal books are not revised and due to this wastes,
damages etc. are not accounted in the journal books. Small entities are preferred to use
periodic inventory system for the inventory valuation.
Spreadsheet
Example:
Data
Date Particulars Amount ($)
01-06-2017 Opening stock (1000 units at $ 10 each) 10000
10-06-2017 Purchase (800 units at $ 10 each) 8000
22-06-2017 Sales (900 units at $ 15 each) 13500
30-06-2017 Closing stock (900 units at $ 10 each) 9000
Periodic inventory system
tabler-icon-diamond-filled.svg

Paraphrase This Document

Need a fresh take? Get an instant paraphrase of this document with our AI Paraphraser
Document Page
ACCOUNTING SYSTEMS AND PROCESSES 7
Particulars Amount ($) Particulars Amount ($)
Opening stock 10000 Sales 13500
Purchase 8000 Closing stock 9000
Gross profit 4500
Total 22500 Total 22500
Ques.6.
A. Used Camscanner for the handwritten solution.
Document Page
ACCOUNTING SYSTEMS AND PROCESSES 8
Handwritten solution
Document Page
ACCOUNTING SYSTEMS AND PROCESSES 9
B.
Spreadsheet
Adjustments
Normal View:
Adjustments
Fancy Footwear
Data Trial balance Debit Credit
Cash 12450
Accounts receivable 17650
Inventory 56980
Supplies 7560
Buildings 145000
Accumulated depreciation, building 17600
Furniture 23780
Accumulated depreciation, furniture 5760
Accounts payable 17400
Salary payable 2300
Interest payable 1400
Unearned sales revenue 10550
Note payable, long term 34000
capital 142675
Drawings 4590
Sales revenue 166000
Sales discount 3450
Sales returns 3430
Purchase 89700
Purchase discount 4015
Purchase return and allowances 7690
Selling expenses 23700
Supplies Expenses 1600
tabler-icon-diamond-filled.svg

Secure Best Marks with AI Grader

Need help grading? Try our AI Grader for instant feedback on your assignments.
Document Page
ACCOUNTING SYSTEMS AND PROCESSES 10
Depreciation on building 2000
Depreciation on furniture 1850
Salaries expenses
General expenses 14500
Supplies Expenses 800
Depreciation on building 2000
Depreciation on furniture 1850
Interest expenses
Suspense 3500
Total 412890 412890 OK
Formula View:
Adjustments
Fancy Footwear
Data Trial balance Debit Credit
Cash 12450
Accounts
receivable 17650
Inventory 56980
Supplies 7560
Buildings 145000
Accumulated
depreciation,
building 17600
Furniture 23780
Accumulated
depreciation,
furniture 5760
Accounts payable 17400
Salary payable 2300
Interest payable 1400
Unearned sales
revenue =7650+2900
Note payable,
long term 34000
capital 142675
Drawings 4590
Document Page
ACCOUNTING SYSTEMS AND PROCESSES 11
Sales revenue 166000
Sales discount 3450
Sales returns 3430
Purchase 89700
Purchase
discount 4015
Purchase return
and allowances 7690
Selling expenses 23700
Supplies Expenses =2400*2/3
Depreciation on
building =4000*0.5
Depreciation on
furniture =3700*0.5
Salaries expenses
General expenses 14500
Supplies Expenses =2400*1/3
Depreciation on
building =4000*0.5
Depreciation on
furniture =3700*0.5
Interest expenses
Suspense =+L38-SUM(L6:L36)
Total =SUM(K6:K37) =+K38 =IF(K38=L38,"OK","NOT OK")
Changes
Normal View:
Changes
Fancy Footwear
Data Trial balance Debit Credit
Cash 12450
Accounts receivable 18650
Inventory 56980
Supplies 7560
Buildings 145000
Accumulated depreciation, building 17600
Furniture 23780
Document Page
ACCOUNTING SYSTEMS AND PROCESSES 12
Accumulated depreciation, furniture 5760
Accounts payable 18150
Salary payable 2300
Interest payable 1400
Unearned sales revenue 10550
Note payable, long term 34000
capital 142675
Drawings 4590
Sales revenue 166000
Sales discount 3450
Sales returns 3430
Purchase 89700
Purchase discount 4015
Purchase return and allowances 7540
Selling expenses 23700
Supplies Expenses 1600
Depreciation on building 2000
Depreciation on furniture 1850
Salaries expenses
General expenses 14500
Supplies Expenses 800
Depreciation on building 2000
Depreciation on furniture 1850
Interest expenses
Suspense 3900
Total 413890 413890 OK
Formula View:
Changes
Fancy Footwear
Data Trial balance Debit Credit
Cash 12450
tabler-icon-diamond-filled.svg

Paraphrase This Document

Need a fresh take? Get an instant paraphrase of this document with our AI Paraphraser
Document Page
ACCOUNTING SYSTEMS AND PROCESSES 13
Accounts
receivable =17650+1000
Inventory 56980
Supplies 7560
Buildings 145000
Accumulated
depreciation,
building 17600
Furniture 23780
Accumulated
depreciation,
furniture 5760
Accounts
payable =17400+750
Salary payable 2300
Interest
payable 1400
Unearned sales
revenue =7650+2900
Note payable,
long term 34000
capital 142675
Drawings 4590
Sales revenue 166000
Sales discount 3450
Sales returns 3430
Purchase 89700
Purchase
discount 4015
Purchase
return and
allowances =7690-150
Selling
expenses 23700
Supplies
Expenses =2400*2/3
Depreciation
on building =4000*0.5
Depreciation
on furniture =3700*0.5
Salaries
expenses
General
expenses 14500
Supplies
Expenses =2400*1/3
Document Page
ACCOUNTING SYSTEMS AND PROCESSES 14
Depreciation
on building =4000*0.5
Depreciation
on furniture =3700*0.5
Interest
expenses
Suspense
=+R38-
SUM(R6:R36)
Total
=SUM(Q6:Q37
) =+Q38
=IF(Q38=R38,"OK","NOT
OK")
C.
Report
Introduction
This paper will describe the advantages of using a spreadsheet in accountancy.
Accountant can simply allot costs, revenues, products or resources to the diverse divisions
correctly with the application of spreadsheet formulae’s and functions.
Advantages of Spreadsheet in accountancy:
1. Pie-Charts, diagrams and graphs can be drawn through spreadsheet for the motive of
summarising or easy understanding of the data.
2. Using of formulae’s and other function keys will make the computations simpler and
easier and also fetch accurate outcomes.
3. Another advantage of using spreadsheet is that any single entry can be introduced or
erased without modifying the whole entries in spreadsheet.
4. Huge and ample data can be effortlessly imported from other sources into the
spreadsheet.
5. Making notes labelling every entry is another benefit of spreadsheet.
6. Values in the spreadsheet can be interrelated with one another is also an advantage of
using the spreadsheet.
Document Page
ACCOUNTING SYSTEMS AND PROCESSES 15
Conclusion
Hence after studying the above benefits, the conclusion can be drawn is that
spreadsheet is the best tool for accountancy purpose. The results are accurate which shows
the true and fair view about the company’s report which fetch benefits to both company and
the stakeholders.
Ques.7.
Original Version
Normal View:
Bruges Inc
For the month of october
Data Particulars Units Unit cost ($)
Oct-01 Opening Inventory 60 57
Oct-03 Purchase 10 65
Oct-12 Purchase 30 70
Oct-18 Purchase 70 72
Oct-31 Inventory on hand 115
October Sales revenue $ 25,000.00
REPORTS Average Cost ($) LIFO ($) FIFO ($)
Beginning inventory 3420 3420 3420
Net Purchases 7790 7790 7790
Cost of goods available 11210 11210 11210
Ending Inventory 7583.24 6555 8280
Cost of Goods Sold 3626.76 4655.00 2930.00
Calculation of Gross Profit
Particulars Average Cost ($) LIFO ($) FIFO ($)
Sales Revenue 25000.00 25000.00 25000.00
Cost of Goods sold 3626.76 4655.00 2930.00
tabler-icon-diamond-filled.svg

Secure Best Marks with AI Grader

Need help grading? Try our AI Grader for instant feedback on your assignments.
Document Page
ACCOUNTING SYSTEMS AND PROCESSES 16
Gross profit 21373.24 20345.00 22070.00
Working Note
1 Calculation of cost per unit
AVERAGE METHOD
Average cost = Total costs/no. of units
Average cost
per unit 65.94
Cost of goods sold = Cost of goods available - Ending Inventory
2 Calculation of cost per unit
LIFO METHOD
Date Particulars Units
Oct-31 Inventory on hand 115
Less: Oct-18 Purchase 70
Less: Oct-12 Purchase 30
Less: Oct-03 Purchase 10
Less: Oct-01 Purchase 5
Balance 0
Cost per unit 57
3 Calculation of cost per unit
FIFO METHOD
Date Particulars Units
Oct-31 Inventory on hand 115
Less: Oct-01 Purchase 60
Less: Oct-03 Purchase 10
Less: Oct-12 Purchase 30
Less: Oct-18 Purchase 15
Balance 0
Cost per unit 72
Formula View:
Bruges Inc
For the month of October
Data Particulars Units Unit cost ($)
Document Page
ACCOUNTING SYSTEMS AND PROCESSES 17
37165 Opening Inventory 60 57
37897 Purchase 10 65
41185 Purchase 30 70
43376 Purchase 70 72
48124 Inventory on hand 115
October Sales revenue 25000
REPORTS Average Cost ($) LIFO ($) FIFO ($)
Beginning
inventory =D5*E5 =D5*E5 =D5*E5
Net Purchases
=(D6*E6)+(D7*E7)+
(D8*E8)
=(D6*E6)+(D7*E7)+
(D8*E8)
=(D6*E6)+(D7*E7)+
(D8*E8)
Cost of goods
available =SUM(D14:D15) =SUM(E14:E15) =SUM(F14:F15)
Ending Inventory =D9*C32 =D9*D46 =D9*D59
Cost of Goods Sold =D16-D17 =E16-E17 =F16-F17
Calculation of Gross Profit
Particulars Average Cost ($) LIFO ($) FIFO ($)
Sales Revenue =D11 =D11 =D11
Cost of Goods sold =D18 =E18 =F18
Gross profit =D22-D23 =E22-E23 =F22-F23
Working Note
1
Calculation of cost per
unit
AVERAGE METHOD
Average cost = Total costs/no. of units
Average cost =D16/(D5+D6+D7+D8)
Cost of goods sold = Cost of goods available - Ending
Inventory
2
Calculation of cost per
unit
Document Page
ACCOUNTING SYSTEMS AND PROCESSES 18
LIFO METHOD
Date Particulars Units
48124
Inventory on
hand 115
Less: 43376 Purchase =D8
Less: 41185 Purchase =D7
Less: 37897 Purchase =D6
Less: 37165 Purchase 5
Balance
=E39-E40-E41-E42-
E43
Cost per unit =E5
3
Calculation of cost per
unit
FIFO METHOD
Date Particulars Units
48124
Inventory on
hand 115
Less: 37165 Purchase =D5
Less: 37897 Purchase =D6
Less: 41185 Purchase =D7
Less: 43376 Purchase 15
Balance
=E52-E53-E54-E55-
E56
Cost per unit =E8
Second Version
For the month of October
Data Particulars Units Unit cost ($)
Oct-01 Opening Inventory 60 57
Oct-03 Purchase 10 52
Oct-12 Purchase 30 47
Oct-18 Purchase 70 39
Oct-31 Inventory on hand 115
Octobe
r Sales revenue $ 25,000.00
REPORTS Average Cost ($) LIFO ($) FIFO ($)
Beginning inventory 3420 3420 3420
Net Purchases 4660 4660 4660
tabler-icon-diamond-filled.svg

Paraphrase This Document

Need a fresh take? Get an instant paraphrase of this document with our AI Paraphraser
Document Page
ACCOUNTING SYSTEMS AND PROCESSES 19
Cost of goods available 8080 8080 8080
Ending Inventory 5465.88 6555 4485
Cost of Goods Sold 2614.12 1525.00 3595.00
Calculation of Gross Profit
Particulars Average Cost ($) LIFO ($) FIFO ($)
Sales Revenue 25000.00 25000.00 25000.00
Cost of Goods sold 2614.12 1525.00 3595.00
Gross profit 22385.88 23475.00 21405.00
Working Note
1 Calculation of cost per unit
AVERAGE METHOD
Average cost = Total costs/no. of units
Average cost 47.53
Cost of goods sold = Cost of goods available - Ending Inventory
2 Calculation of cost per unit
LIFO METHOD
Date Particulars Units
Oct-31 Inventory on hand 115
Less: Oct-18 Purchase 70
Less: Oct-12 Purchase 30
Less: Oct-03 Purchase 10
Less: Oct-01 Purchase 5
Balance 0
Cost per unit 57
3 Calculation of cost per unit
FIFO METHOD
Date Particulars Units
Oct-31 Inventory on hand 115
Less: Oct-01 Purchase 60
Less: Oct-03 Purchase 10
Less: Oct-12 Purchase 30
Less: Oct-18 Purchase 15
Balance 0
Cost per unit 39
Document Page
ACCOUNTING SYSTEMS AND PROCESSES 20
Comment
Therefore, by decreasing the unit cost in second version it has been observed that
there has been an increment in gross profit in Average cost method and LIFO method
whereas decrement in FIFO method.
Ques.8.
A.
B.
Spreadsheet
Normal View:
Document Page
ACCOUNTING SYSTEMS AND PROCESSES 21
Melania Insurance
Data
Particulars $
Bank balance on 30 April 19670
Adjustments:
EFT Rent receipt -600
EFT Insurance payment 300
NSF Cheque from
customer -1700
Note receivable -1500
Bank error Cheque 1419 340
Bank service charges 40
Deposit in transit 19
outstanding cheque
Cheque no. 1420 1532
Cheque no. 1421 700
Cheque no. 1422 230
Cash account balance as
of 30 April 19031 OK
Formula View:
Melania Insurance
Data
Particulars $
Bank balance on 30 April 19670
Adjustments:
EFT Rent receipt -600
EFT Insurance payment 300
NSF Cheque from customer -1700
Note receivable -1500
Bank error Cheque 1419 340
Bank service charges 40
Deposit in transit =-1543+1562
outstanding cheque
Cheque no. 1420 1532
Cheque no. 1421 700
Cheque no. 1422 230
Cash account balance as of 30 April =SUM(C26:C38) =IF(C20=C39,"OK","NOT OK")
tabler-icon-diamond-filled.svg

Secure Best Marks with AI Grader

Need help grading? Try our AI Grader for instant feedback on your assignments.
Document Page
ACCOUNTING SYSTEMS AND PROCESSES 22
Changes
Normal View:
Melania Insurance
Data
Particulars $
Bank balance on april 30
1967
0
Adjustments:
EFT Rent receipt -800
EFT Insurance payment 500
NSF Cheque from customer
-
1900
Note receivable
-
1600
Bank error Cheque 1419 440
Bank service charges 40
Deposit in transit 1743
outstanding cheque
Cheque no. 1420 532
Cheque no. 1421 200
Cheque no. 1422 206
Cash account balance as of 30 April
1903
1
Ques.9.
Journal Entries
1. For credit sales
Particulars Debit Credit
Accounts Receivable A/c Dr.
To Credit Sales A/c
$ 50,000
$ 50,000
2. Collection
Particulars Debit Credit
Document Page
ACCOUNTING SYSTEMS AND PROCESSES 23
Cash Account A/c Dr.
To Accounts Receivable A/c
$ 45,000
$ 45,000
3. Written Off
Particulars Debit Credit
Allowance for doubtful amount A/c Dr.
To Accounts Receivable A/c
$ 5,000
$ 5,000
4. Reinstatement of the written off amount
Particulars Debit Credit
Accounts Receivable A/c Dr.
To Allowance for doubtful amount A/c
$ 5,000
$ 5,000
5. Full and Final collection
Particulars Debit Credit
Cash Account A/c Dr.
To Accounts Receivable A/c
$ 5,000
$ 5,000
T-Account
Accounts receivable Account
Particulars Amount in $ Particulars Amount in $
To credit sales 50,000 By balance b/d -
By Allowance for
doubtful amount
5,000 By cash 45,000
To balance c/d - By Allowance for
doubtful amount
5,000
By cash 5,500
Document Page
ACCOUNTING SYSTEMS AND PROCESSES 24
Ques.10.
There are 2 methods of valuation of estimating bad debts.
These are as follows:
1. % of credit sales method:
In this method, the bad debt amount is computed from the % of credit sales.
Illustration:
Credit sales = $ 4,00,000
Given that 5% amount is uncollectible.
Bad Debt = $ 4,00,000 * 5% = $ 20,000
Journal Entry:
Particulars Debit Credit
Bad debt Expense A/c Dr.
To Allowance for bad debt A/c
(Estimate of bad debts)
$ 20,000
$ 20,000
2. % of Accounts receivable method:
In this method, the bad debt amount is computed from the % of accounts receivable
balance.
Illustration:
Accounts receivable (closing balance) = $ 12,00,000
Given that 2% amount is uncollectible.
Bad Debt = $ 12,00,000 * 2% = $ 24,000
tabler-icon-diamond-filled.svg

Paraphrase This Document

Need a fresh take? Get an instant paraphrase of this document with our AI Paraphraser
Document Page
ACCOUNTING SYSTEMS AND PROCESSES 25
Journal Entry:
Particulars Debit Credit
Bad debt Expense A/c Dr.
To Allowance for bad debt A/c
(Estimate of bad debts)
$ 24,000
$ 24,000
Ques.11.
There are many ways to evaluate the entity’s performance for example through
internal factors such as profit and loss statement, statement of financial position, statement of
cash flows or through ratios or through external factors such as market positions, share price
fluctuations, foreign market, customer priorities etc.
In addition to this, accounts receivables can also be categorised as a factor to assess
the entity’s financial condition.
Accounts receivables can control the solvency factors of the entity because it discloses the
actual position of cash balances. In other terms, it helps in scrutinising the cash availability in
the business, cash utilisation and cash recoverable position. Hence, Accounts receivable is
also very vital for the analysing entity’s financial stability.
Illustration: Suppose a company has a receivables of amount $ 10,00,000.
This amount can be used to gauge financial performance of the entity on the basis of two
options. These are:
Firstly, receivables amount is very enormous that is it can be concluded that the
company has made huge sales during the year which is favourable for the company.
Secondly, the receivables amount of $ 10,00,000 can be concluded that the collection
policies of the entity from their customers is not strong and effective.
Document Page
ACCOUNTING SYSTEMS AND PROCESSES 26
Hence, it can be concluded that receivables can also be used to evaluate the firm’s financial
stability.
Ques.12.
Scenario:
X Ltd. sells raincoats to Y Ltd. for $ 50,000 (Total credit sales) with the payment due in 45
days. After 45 days of non-payment, X ltd accepted the note receivable from the Y ltd for $
50,000. It has been found that, Y ltd had delayed the payment of $ 35, 000 and balance
$15,000 got dishonour.
The journal entries:
(1). Recording of credit sales:
Particulars Debit Credit
Notes Receivable A/c Dr.
Credit Sales Revenue A/c
$ 50,000
$ 50,000
(2). Conversion of Account receivable to Notes Receivable:
Particulars Debit Credit
Notes Receivable A/c Dr.
Account Receivable A/c
$ 50,000
$ 50,000
(3). Y ltd only paid $ 35,000 after the due date:
Particulars Debit Credit
Account Receivable A/c Dr.
Notes Receivable A/c
$ 35,000
$ 35,000
(4). $ 15, 000 got dishonour. Journal for the dishonour of the note:
Particulars Debit Credit
Document Page
ACCOUNTING SYSTEMS AND PROCESSES 27
Allowance for doubtful amount Dr.
Notes Receivable A/c
$ 15,000
$ 15,000
T-Account
Note receivable Account
Particulars Amount ($) Particulars Amount ($)
To balance b/d - By Account
receivable
35,000
To Account
receivable
50,000 By Allowance for
doubtful amount
15,000
To credit sales
revenue
50,000 To balance c/d 250,000
Total 40,000 Total 40,000
Ques.13.
Refer another Doc-file.
chevron_up_icon
1 out of 28
circle_padding
hide_on_mobile
zoom_out_icon
logo.png

Your All-in-One AI-Powered Toolkit for Academic Success.

Available 24*7 on WhatsApp / Email

[object Object]