LB5212 Accounting: Comparative Financial Analysis of Telstra & Queste
VerifiedAdded on 2023/06/08
|27
|4185
|91
Report
AI Summary
This report presents a comprehensive financial analysis of Telstra Corporation, comparing its performance against Queste Communications from 2015 to 2018. It includes horizontal and vertical analysis of Telstra's income statement, balance sheet, and cash flow statement, highlighting trends in assets, liabilities, equity, sales, and profitability. Key financial ratios, such as liquidity, profitability, efficiency, and capital structure ratios, are calculated and compared for both companies to assess their financial health. The analysis reveals that while Telstra's profits have declined, its profitability and efficiency remain superior to Queste. Despite Queste's better liquidity position, Telstra's higher debt-to-equity ratio indicates greater financial risk. The report concludes with insights into the overall financial standing of both companies, suggesting that Telstra has outperformed Queste in key areas despite recent profit declines. Desklib provides access to similar reports and solved assignments for students.
RUNNING HEAD: ACCOUNTING AND FINANCE FOR MANAGER
System
[Pick the date]
Financial analysis
System
[Pick the date]
Financial analysis
Paraphrase This Document
Need a fresh take? Get an instant paraphrase of this document with our AI Paraphraser
Accounting and finance for manager 2
Executive Summary
The report prepared discusses the overall financial analysis of the Telstra Corporation and
compare its ratios to its competitor Queste Communications Limited. It is also a
telecommunication entity functioning in the same industry and is listed on Australian Securities
Exchange. The report explains the nature of assets, liabilities and net income of the Telstra in
respect to the accounting model as well as analyzes, compare and interpret its financial
performance and position with its competitor Queste.
First part of the report contains horizontal and vertical analysis of Telstra’s financial statements
for the years starting from 2015 to 2018. The analysis interprets the overall performance of
Telstra and shows the percentage change in each item of the statements. It can be observed that
the assets, equities and liabilities of the firm have shown an upward trend in the past four years.
In addition, there were some fluctuations in the sales and profit earned by the company during
the years. Furthermore, the analysis of cash flow statement reflected that there were negative
cash flows in some of the past years.
The second part of the report discusses the key ratio of Telstra including the calculation of
liquidity, profitability, efficiency and capital structure ratios. The same figures are been derived
for Queste Communications also and for the same time period of four years. After that the results
are compared and the performance has been measured. The findings of ratio analysis state that
the liquidity position of Queste is much better than Telstra while on the other side, the company
is not as much profitable as its competitor Telstra. A high debt to equity ratio indicates that
Telstra has high financial risk and relies more on borrowings and liabilities. In the last, all the
findings of the report are summarized in conclusion section which provide insights about the
Accounting and finance for manager 3
overall position of Telstra and Queste. It suggests that though the profits of former company are
declining but it has performed better than its competitor (Queste) in relation to its profitability
and efficiency over the past years.
overall position of Telstra and Queste. It suggests that though the profits of former company are
declining but it has performed better than its competitor (Queste) in relation to its profitability
and efficiency over the past years.
⊘ This is a preview!⊘
Do you want full access?
Subscribe today to unlock all pages.
Trusted by 1+ million students worldwide
Accounting and finance for manager 4
Contents
Introduction.................................................................................................................................................5
Income statement.........................................................................................................................................6
Balance sheet...............................................................................................................................................9
Cash flow statement..................................................................................................................................11
Ratio analysis............................................................................................................................................13
Liquidity ratios......................................................................................................................................13
Profitability ratios..................................................................................................................................14
Efficiency ratios....................................................................................................................................15
Capital structure ratios...........................................................................................................................17
Conclusion.................................................................................................................................................18
References.................................................................................................................................................20
Appendix 1.................................................................................................................................................21
Paraphrase This Document
Need a fresh take? Get an instant paraphrase of this document with our AI Paraphraser
Accounting and finance for manager 5
Introduction
Telstra Corporation Limited is an Australian based telecommunication company operating and
expanding its business all over the country. The core activities of the company include
establishment and distribution of communication services like mobile services, internet access
and many others. It provides 17.7 million retail mobile services, 3.6 million retail fixed
broadband services and 4.9 million retail fixed voice services. The main objective of Telstra is to
offer quality services to its customers and make efforts to connect more and more people across
the world. In order to achieve its goals, the firm produces easy technologies and content
solutions which are user friendly (Telstra. 2018).
Telstra is recognized as the leading communication company of Australia having four major
segments operating across the country. Initially, it was incorporated as a government entity
named as Australia Post but later on the company was fully privatized. It got listed on ASX and
is traded with a ticker symbol ASX: TLS. The CEO of the firm is focused on making Telstra
more consumers oriented by undertaking a change program. After getting privatized, the share
price of the company rose to $5 per share in December 2013 to $6 per share in the same month
of 2014 (Telstra. 2018).
As far as its financials are considered, it earned a net profit of $3.5 billion in 2018 and revenue
worth $29 billion during the same year. As of 2017, the company’s assets were reported at $42.8
billion along with the equity amounted to $15 billion. There were approximately 32000
employees working in the organizations in 2017 and 150 subsidiaries owned by Telstra. Overall,
the company is making efforts and is focused on experiencing growth and success in the coming
future (Telstra. 2018).
Accounting and finance for manager 6
Income statement
It is one of the financial statements prepared by the company at the end of the accounting period.
It reflects the operating performance of the entity by taking into account the figures such as total
revenue generated, net profit earned, operating profit made and many others. The analysis of
statement of performance provides insights to the investors about the profitability position of the
company. The amount of net profit shown is basically the excess of total revenues over total
expenses incurred during the year. However, if the difference turns out to be negative then it is
considered as net loss and the same reflects the decrease in owner’s equity. The term income is
defined as the earnings made from the increase in assets and decrease in liabilities. The following
section shows the overall analysis of Telstra’s income statement for the past four years (Agtarap-
San Juan, 2007).
2015 2016 2017 2018
0
1000
2000
3000
4000
5000
6000
7000
Net income
Net income
Years
$million
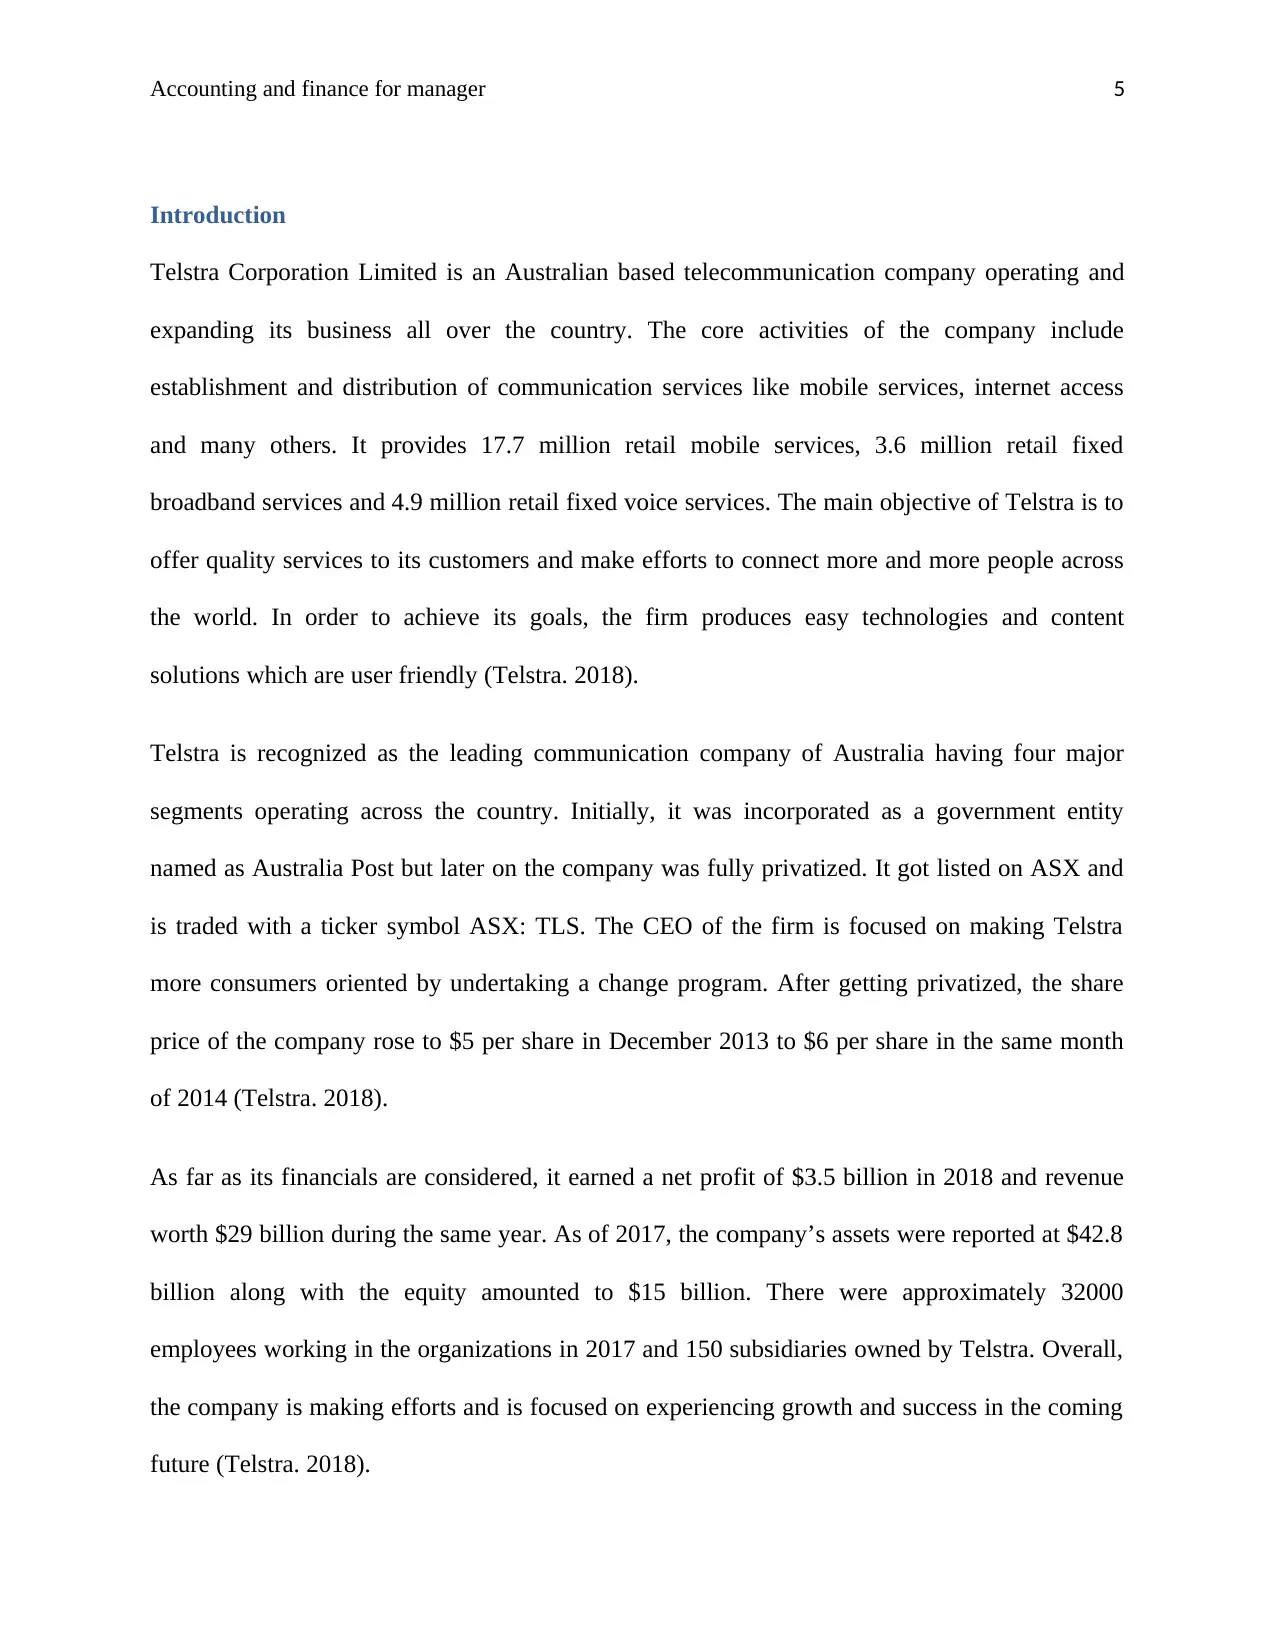
Figure 1: Net income for 2015-2016
Referring to the appendix 1 as well as figure 1, it can be interpreted that the net profit or income
of Telstra has reduced after 2016. During the first two years, an increase of 36.61% was there in
Income statement
It is one of the financial statements prepared by the company at the end of the accounting period.
It reflects the operating performance of the entity by taking into account the figures such as total
revenue generated, net profit earned, operating profit made and many others. The analysis of
statement of performance provides insights to the investors about the profitability position of the
company. The amount of net profit shown is basically the excess of total revenues over total
expenses incurred during the year. However, if the difference turns out to be negative then it is
considered as net loss and the same reflects the decrease in owner’s equity. The term income is
defined as the earnings made from the increase in assets and decrease in liabilities. The following
section shows the overall analysis of Telstra’s income statement for the past four years (Agtarap-
San Juan, 2007).
2015 2016 2017 2018
0
1000
2000
3000
4000
5000
6000
7000
Net income
Net income
Years
$million
Figure 1: Net income for 2015-2016
Referring to the appendix 1 as well as figure 1, it can be interpreted that the net profit or income
of Telstra has reduced after 2016. During the first two years, an increase of 36.61% was there in
⊘ This is a preview!⊘
Do you want full access?
Subscribe today to unlock all pages.
Trusted by 1+ million students worldwide
Accounting and finance for manager 7
the company’s net profit. However, the trend got reversed and the net income started declining
and continuously falls till 2018. In 2016, the profit was highest at $5780 million which fall to
$3563 million in the recent year. This reflected a deteriorating performance of the entity. In
contrast, Queste Communications has made losses in past years. In 2016, the company reported a
loss of $896,730 which increased to $2,248,319 in 2017 (Queste. 2017).
2016 2017 2018
-40.00%
-20.00%
0.00%
20.00%
40.00%
60.00%
80.00%
100.00%
Sales Revenue, Cost of Sales, and Gross
Margin Comparison
Revenue
Cost of revenue
Gross profit
Years
$million
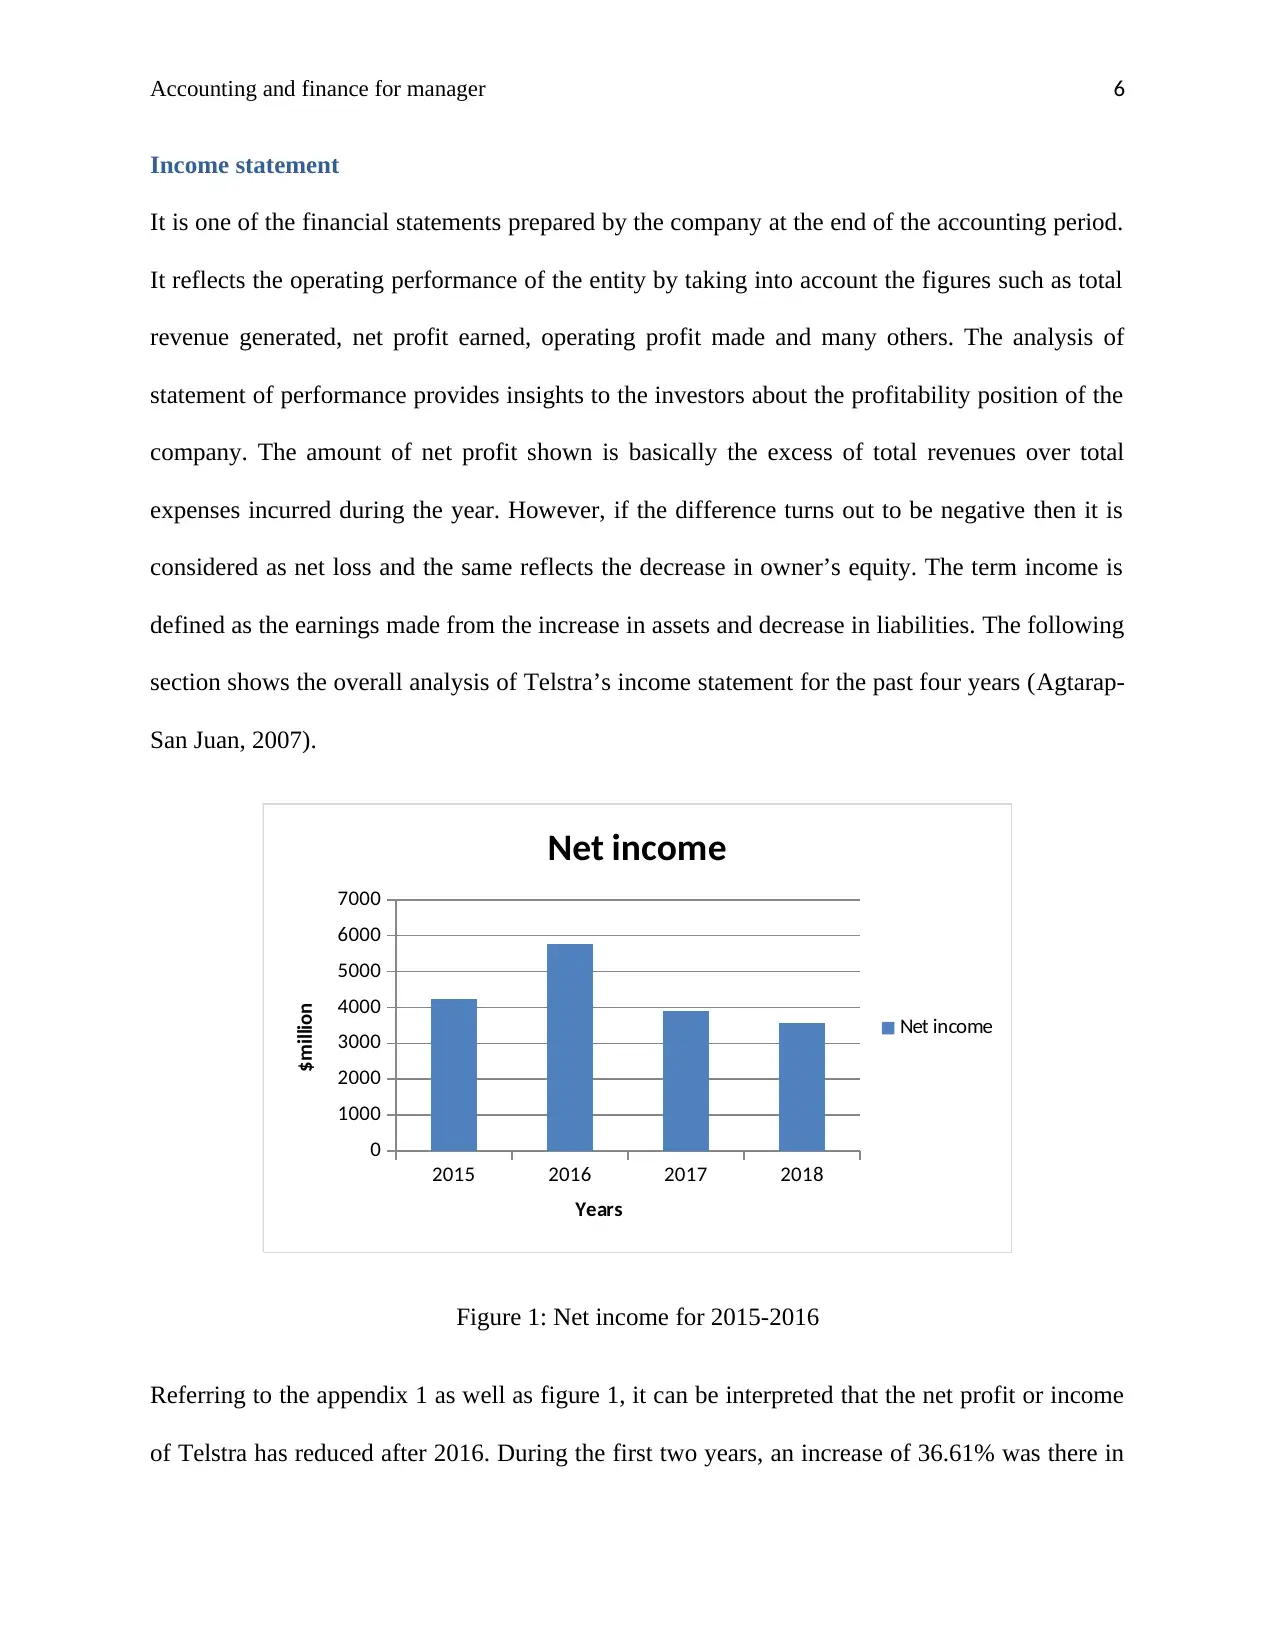
Figure 2: Comparison of sales revenue, COGS and Gross margin
Generally, the company is considered to be profitable when its percentage increase in sales is
more than the percentage increase in its cost of revenue. Referring to Appendix 1.2 and above
figure, it is observed that the revenue has shown a % change from -0.04% to 0.26% in 2017.
However, the same decline by -0.69% in 2018. On the other side, the COGS have reported a
huge upsurge in 2017 that is from 5.49% to 59.51% and it further increased by 79.17% in 2018.
Due to such significant hike in company’s cost of revenue, the gross profit continuously reduces
in the past three years.
the company’s net profit. However, the trend got reversed and the net income started declining
and continuously falls till 2018. In 2016, the profit was highest at $5780 million which fall to
$3563 million in the recent year. This reflected a deteriorating performance of the entity. In
contrast, Queste Communications has made losses in past years. In 2016, the company reported a
loss of $896,730 which increased to $2,248,319 in 2017 (Queste. 2017).
2016 2017 2018
-40.00%
-20.00%
0.00%
20.00%
40.00%
60.00%
80.00%
100.00%
Sales Revenue, Cost of Sales, and Gross
Margin Comparison
Revenue
Cost of revenue
Gross profit
Years
$million
Figure 2: Comparison of sales revenue, COGS and Gross margin
Generally, the company is considered to be profitable when its percentage increase in sales is
more than the percentage increase in its cost of revenue. Referring to Appendix 1.2 and above
figure, it is observed that the revenue has shown a % change from -0.04% to 0.26% in 2017.
However, the same decline by -0.69% in 2018. On the other side, the COGS have reported a
huge upsurge in 2017 that is from 5.49% to 59.51% and it further increased by 79.17% in 2018.
Due to such significant hike in company’s cost of revenue, the gross profit continuously reduces
in the past three years.
Paraphrase This Document
Need a fresh take? Get an instant paraphrase of this document with our AI Paraphraser
Accounting and finance for manager 8
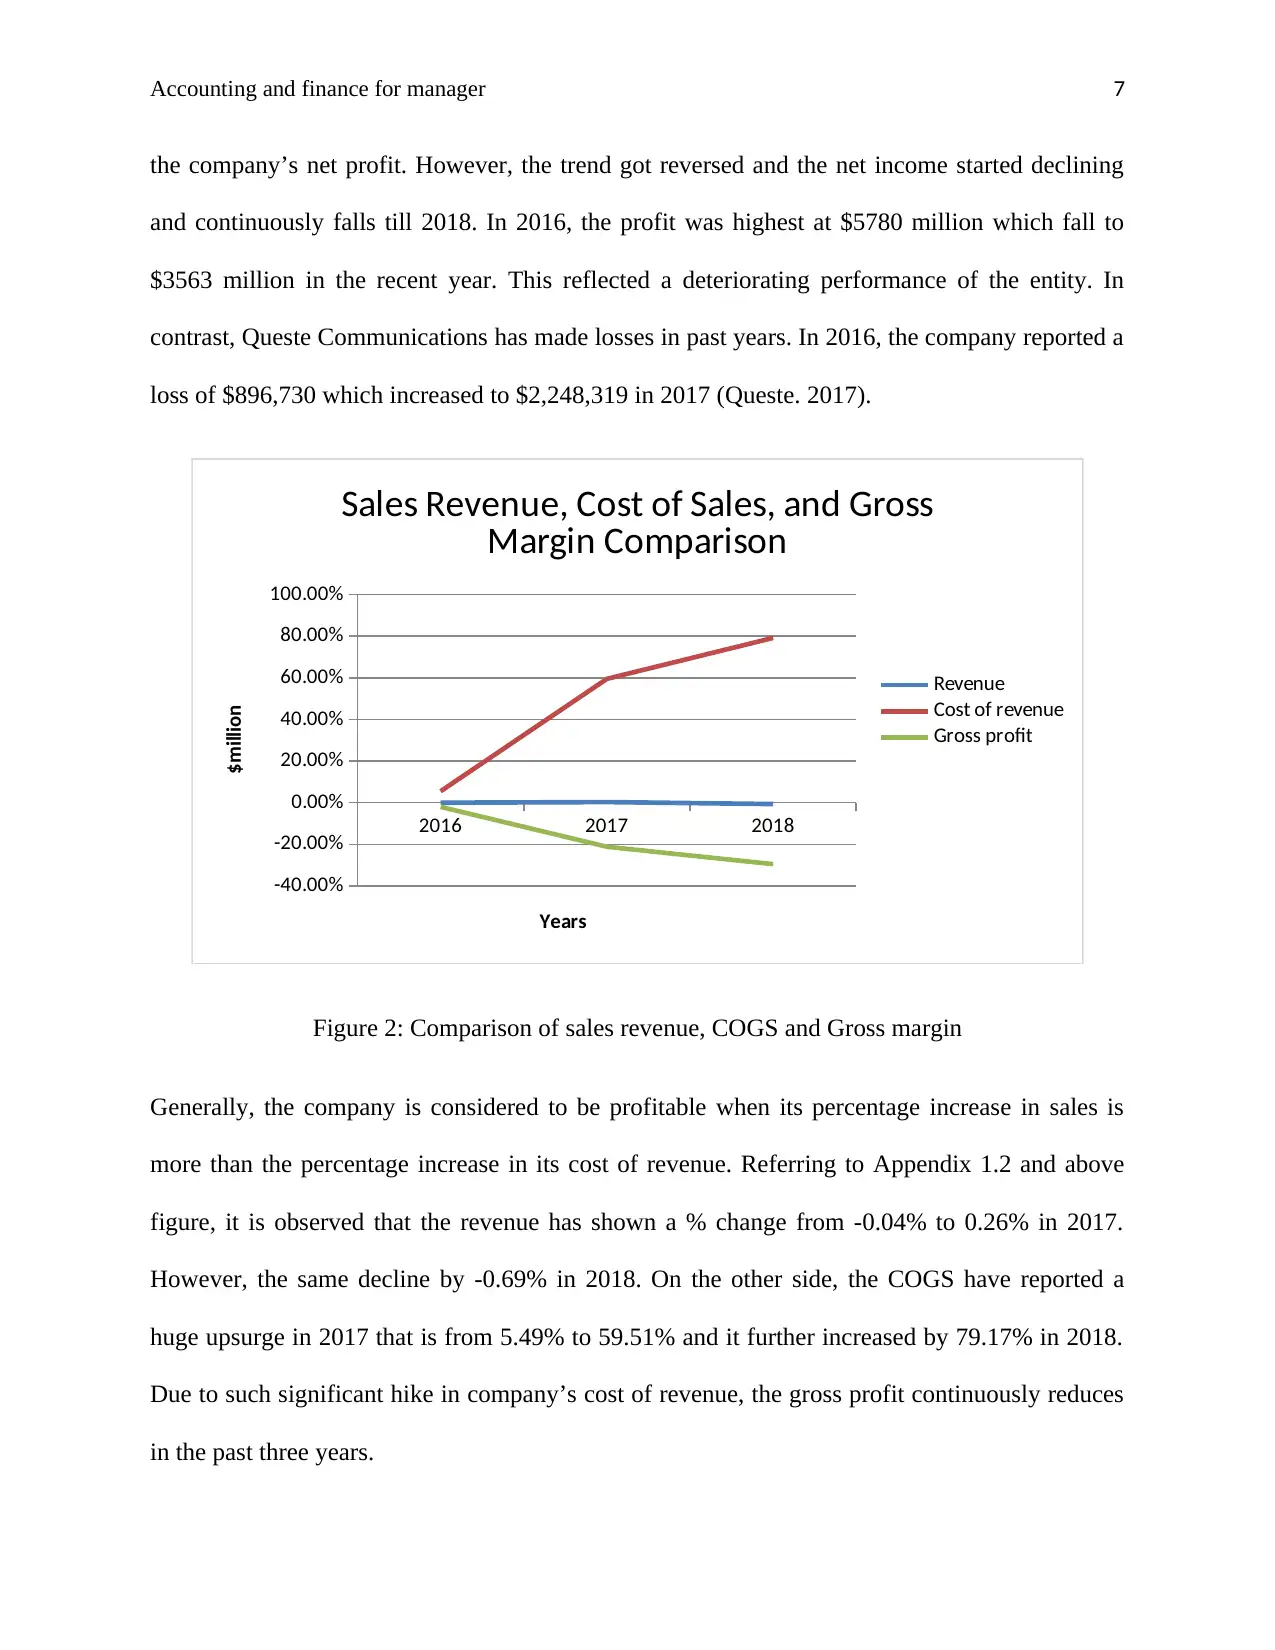
The below figure reflects the results from vertical analysis of the Telstra’s income statement. The
calculations done in Appendix 1.3 and the graph indicate that the gross profit reduced constantly
over the period of four years. In 2015, it was 73.42% of total sales which reduced to 52.04% in
2018. This reduction was due to the increase in company’s administrative cost and other
operating expenses, comprising of 31.26% and 18.47% of total sales respectively. The
percentage further increased in case of operating expenditure.
The net income of Telstra was highest in 2016 at 22.37% and after that it falls to 15.02% and
13.88% in 2017 and 2018 respectively. The major contributing factor for the fall in entity’s profit
was the continuous increase in its cost of revenue over the past years. In 2018, the COGS is
47.96% of total sales and the same was once reported at 26.58% of the revenue. Overall the
profitability of Telstra has reduced during the years.
2015 2016 2017 2018
0.00%
10.00%
20.00%
30.00%
40.00%
50.00%
60.00%
70.00%
80.00%
Sales Revenue, Cost of Sales, and Gross Margin
Comparison
Cost of revenue
Gross profit
Sales, General and administrative
Other operating expenses
Net income
Years
% of sales revenue
Figure 3: Factors as percentage of sales
Accounting and finance for manager 9
Balance sheet
It is also known as statement of financial position which provides the snapshot of company’s all
assets, liabilities and equities. It reflects the financial situation and condition of the entity in a
summarized form. The balance sheet is also prepared at the end of a specific financial year and
the balances of all the assets and liabilities are reported in the statement at that date. On a whole,
it clearly showcases the company’s position in all the aspects including solvency, liquidity and
profitability (Makoujy, 2010). Generally, investors look up to such statements to gather the
information about the amount of assets owned by the firm and the extent of liabilities owed by it.
The following section provides the horizontal and vertical analysis of Telstra’s balance sheet for
the past four years.
2015 2016 2017 2018
0
5,000
10,000
15,000
20,000
25,000
30,000
35,000
40,000
45,000
50,000
Total Assets, liabilities, and equities comparison
TOTAL ASSETS
TOTAL LIABILITIES
Total stockholders' equity
Years
$million
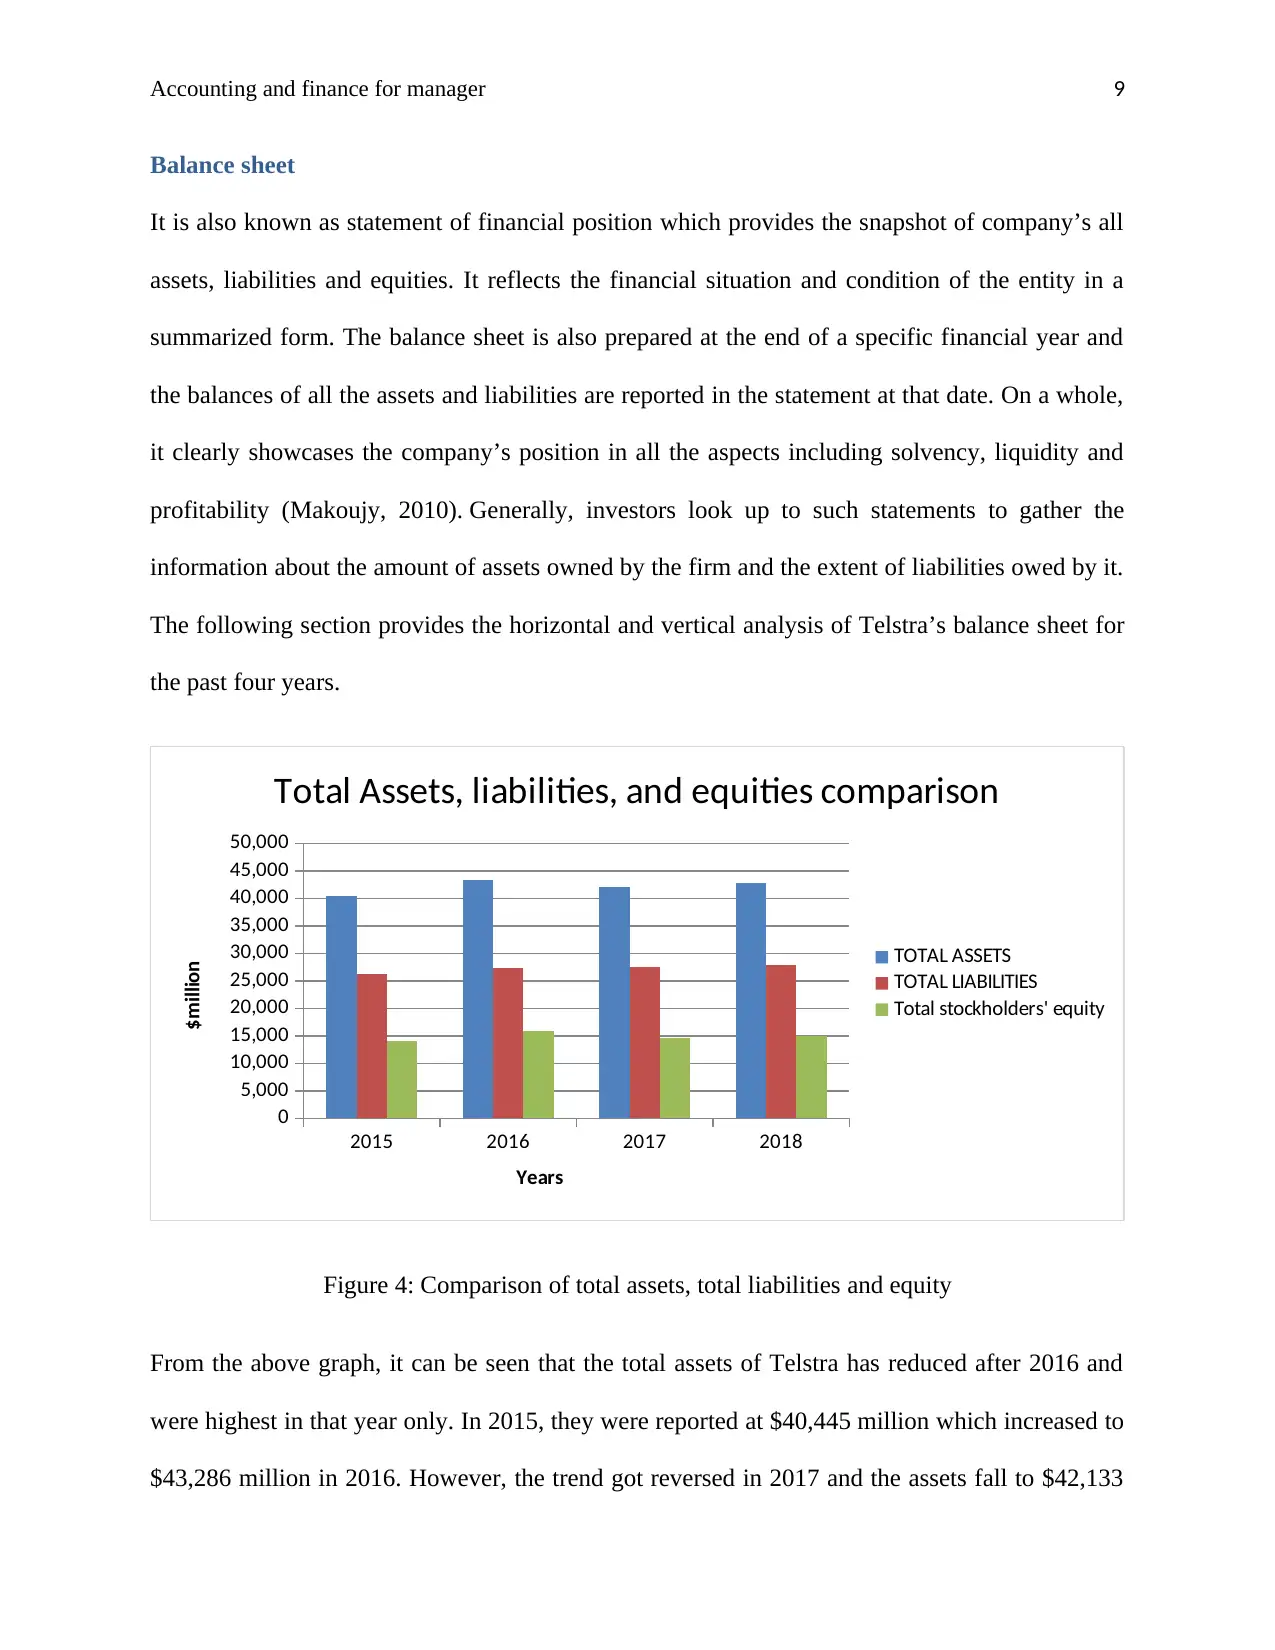
Figure 4: Comparison of total assets, total liabilities and equity
From the above graph, it can be seen that the total assets of Telstra has reduced after 2016 and
were highest in that year only. In 2015, they were reported at $40,445 million which increased to
$43,286 million in 2016. However, the trend got reversed in 2017 and the assets fall to $42,133
Balance sheet
It is also known as statement of financial position which provides the snapshot of company’s all
assets, liabilities and equities. It reflects the financial situation and condition of the entity in a
summarized form. The balance sheet is also prepared at the end of a specific financial year and
the balances of all the assets and liabilities are reported in the statement at that date. On a whole,
it clearly showcases the company’s position in all the aspects including solvency, liquidity and
profitability (Makoujy, 2010). Generally, investors look up to such statements to gather the
information about the amount of assets owned by the firm and the extent of liabilities owed by it.
The following section provides the horizontal and vertical analysis of Telstra’s balance sheet for
the past four years.
2015 2016 2017 2018
0
5,000
10,000
15,000
20,000
25,000
30,000
35,000
40,000
45,000
50,000
Total Assets, liabilities, and equities comparison
TOTAL ASSETS
TOTAL LIABILITIES
Total stockholders' equity
Years
$million
Figure 4: Comparison of total assets, total liabilities and equity
From the above graph, it can be seen that the total assets of Telstra has reduced after 2016 and
were highest in that year only. In 2015, they were reported at $40,445 million which increased to
$43,286 million in 2016. However, the trend got reversed in 2017 and the assets fall to $42,133
⊘ This is a preview!⊘
Do you want full access?
Subscribe today to unlock all pages.
Trusted by 1+ million students worldwide
Accounting and finance for manager 10
million. On the other side, liabilities had constantly increased over the years. They were at
$26,342 million in 2015 which increased to $27,843 million. Along with this, the stockholder’s
equity also rises in 2018 at $15,027 million from $14,541 million (Appendix 1.4). On the other
hand, the total assets of Queste were much higher than that of Telstra. Though, they have
reduced during the past years. In 2016, Queste has assets worth $8,038,176 million which
reduced to $5,677,929 million in 2017. However, the reverse trend was there in company’s total
liabilities as they rise from $375,795 million to $539,149 million in 2017. The amount of equity
had shown a significant decline in the years (Queste. 2017).
2015 2016 2017 2018
0.00%
10.00%
20.00%
30.00%
40.00%
50.00%
60.00%
70.00%
80.00%
90.00%
Selected Factors as % of Total Assets
Current assets Non-current assets current liabilities TOTAL LIABILITIES
Years
% of Total Assets
Figure 5: Selected factors as % of total assets
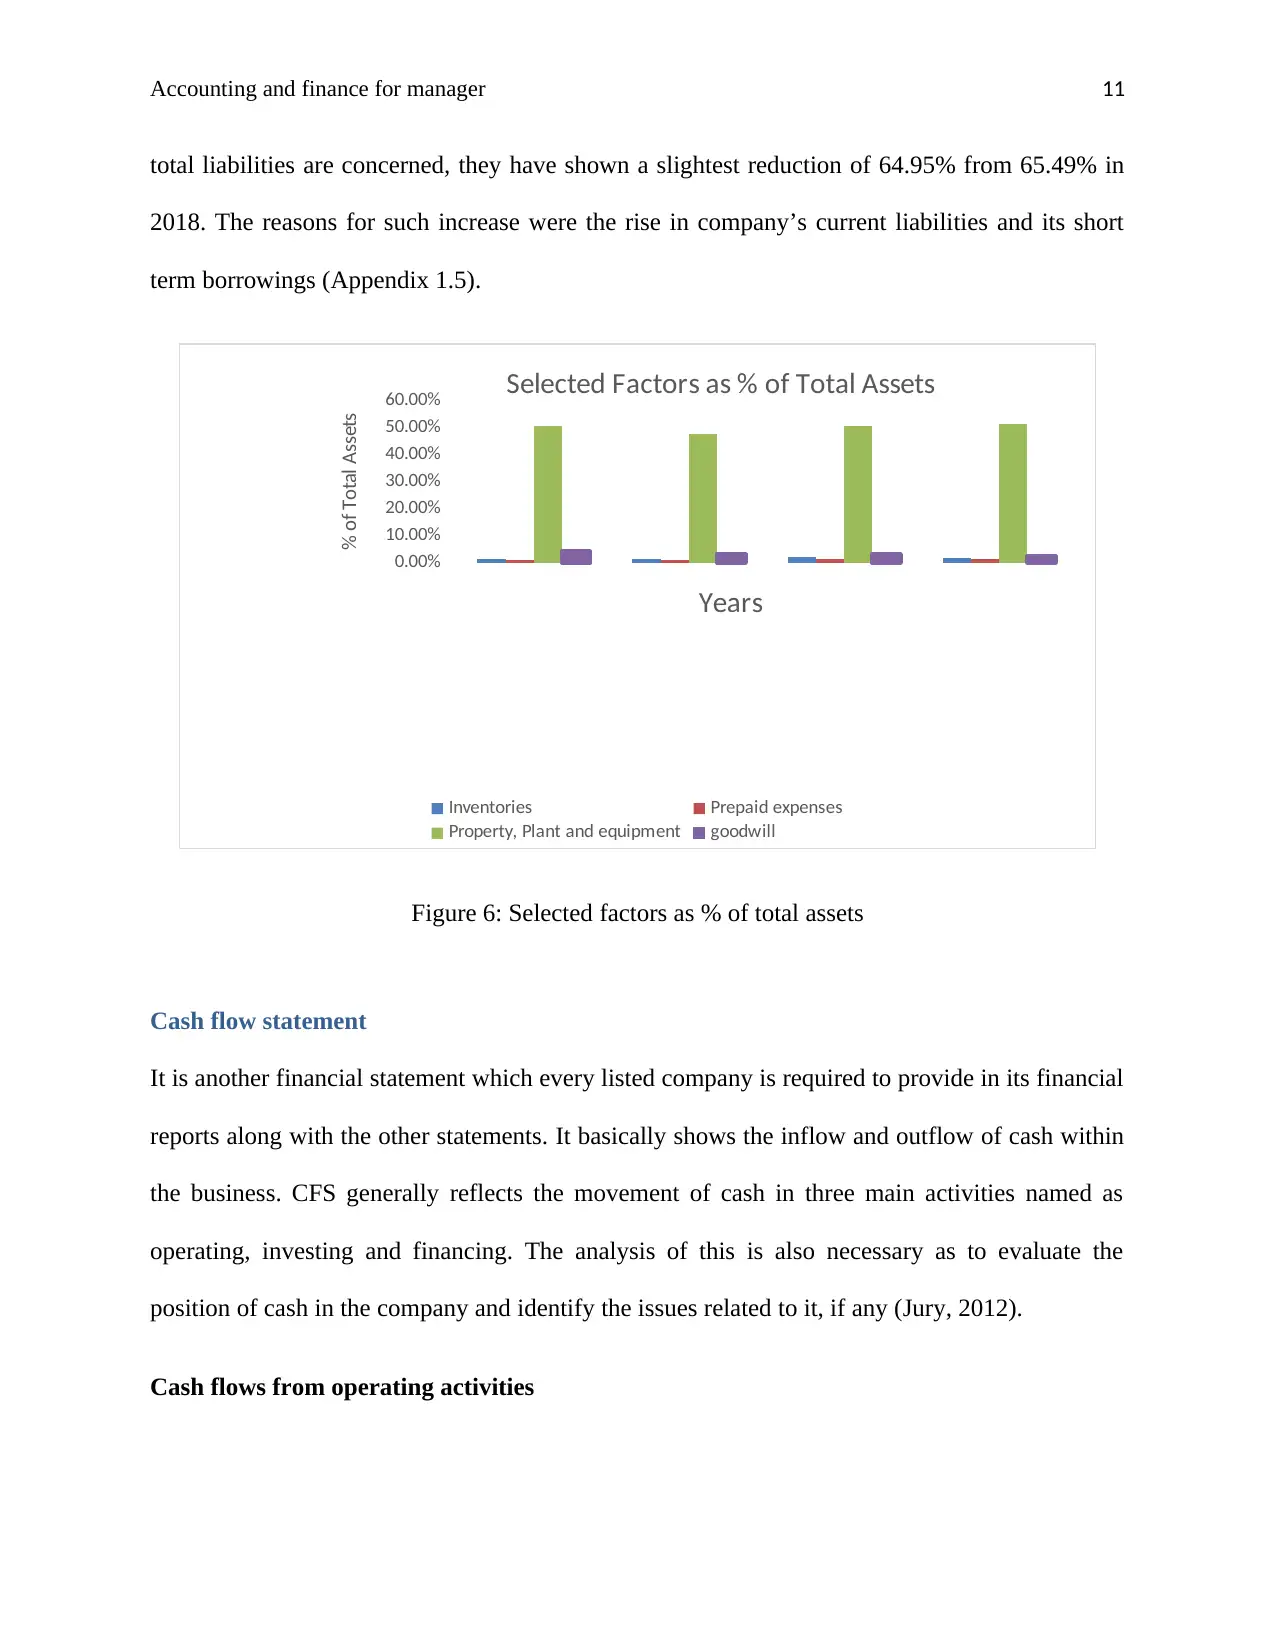
In 2015, the current assets were 17.23% of the total assets which increased to 18.66% in 2017.
However, the same reduced to 16.51% in 2018. On other side, the non-current assets made up
82.77% of total assets which further increased to 83.49% in the recent year. The reason for such
upsurge is the overall increase in Telstra’s property, plant and equipment and goodwill. As far as
million. On the other side, liabilities had constantly increased over the years. They were at
$26,342 million in 2015 which increased to $27,843 million. Along with this, the stockholder’s
equity also rises in 2018 at $15,027 million from $14,541 million (Appendix 1.4). On the other
hand, the total assets of Queste were much higher than that of Telstra. Though, they have
reduced during the past years. In 2016, Queste has assets worth $8,038,176 million which
reduced to $5,677,929 million in 2017. However, the reverse trend was there in company’s total
liabilities as they rise from $375,795 million to $539,149 million in 2017. The amount of equity
had shown a significant decline in the years (Queste. 2017).
2015 2016 2017 2018
0.00%
10.00%
20.00%
30.00%
40.00%
50.00%
60.00%
70.00%
80.00%
90.00%
Selected Factors as % of Total Assets
Current assets Non-current assets current liabilities TOTAL LIABILITIES
Years
% of Total Assets
Figure 5: Selected factors as % of total assets
In 2015, the current assets were 17.23% of the total assets which increased to 18.66% in 2017.
However, the same reduced to 16.51% in 2018. On other side, the non-current assets made up
82.77% of total assets which further increased to 83.49% in the recent year. The reason for such
upsurge is the overall increase in Telstra’s property, plant and equipment and goodwill. As far as
Paraphrase This Document
Need a fresh take? Get an instant paraphrase of this document with our AI Paraphraser
Accounting and finance for manager 11
total liabilities are concerned, they have shown a slightest reduction of 64.95% from 65.49% in
2018. The reasons for such increase were the rise in company’s current liabilities and its short
term borrowings (Appendix 1.5).
0.00%
10.00%
20.00%
30.00%
40.00%
50.00%
60.00% Selected Factors as % of Total Assets
Inventories Prepaid expenses
Property, Plant and equipment goodwill
Years
% of Total Assets
Figure 6: Selected factors as % of total assets
Cash flow statement
It is another financial statement which every listed company is required to provide in its financial
reports along with the other statements. It basically shows the inflow and outflow of cash within
the business. CFS generally reflects the movement of cash in three main activities named as
operating, investing and financing. The analysis of this is also necessary as to evaluate the
position of cash in the company and identify the issues related to it, if any (Jury, 2012).
Cash flows from operating activities
Accounting and finance for manager 12
It can be observed that the cash generated from operating activities has increased from $7775
million to $8606 million in 2018. However, in the starting the same had shown a declining trend
which can be identified by the cash flow in 2015 and the same in 2017. It reduced from $8311
million to $7775 million. Overall, the figures remain positive in all the four years (Refer
appendix 1.6). In contrast, the operating cash flow of Queste was more than Telstra but the same
reduced to $46,220 million from $92,641 million in 2017 (Queste. 2017).
Cash flows from investing activities
Investing activities show the overall cash used in them. In 2015, it was $5692 million which
reduced to $3911 million in 2018. However, some fluctuations are noticed in between and they
were due to the investments made in PP&E and purchase of intangibles. On a whole, the cash
used in investing activities in year 2018 is comparatively less than amount used in 2017 and
2015 (Refer appendix 1.6). The overall net cash used in investing activities of Queste was $1783
million in 2017. The figure was lower than the cash utilized in Telstra’s activities.
Cash flows from financing activities
It also showed the negative cash flow but the amount was less in 2018 as compare to other
periods. In 2015, the net cash used was $6882 million which reduced to $5015 million in the
recent year. This was due to the repayments of company’s debt and the dividends to the
shareholders. Some cash was also used in other financing activities (Refer appendix 1.6).
Overall, the net cash flow from all the three activities turned out to be positive in the four years,
though declining. In 2015, it was $3209 million which increased to $3939 million in 2016.
However, the same reduced to $2454 million in FY2017 but again the trend got reversed and the
cash flow shows a hike at $3674 million in the current year. In a nutshell, Telstra has improved
⊘ This is a preview!⊘
Do you want full access?
Subscribe today to unlock all pages.
Trusted by 1+ million students worldwide
1 out of 27
Related Documents


Your All-in-One AI-Powered Toolkit for Academic Success.
+13062052269
info@desklib.com
Available 24*7 on WhatsApp / Email
![[object Object]](/_next/static/media/star-bottom.7253800d.svg)
Unlock your academic potential
Copyright © 2020–2026 A2Z Services. All Rights Reserved. Developed and managed by ZUCOL.