Group Report: Analysis of Wesfarmers Financial Performance (BUS103)
VerifiedAdded on 2023/04/23
|12
|850
|55
Report
AI Summary
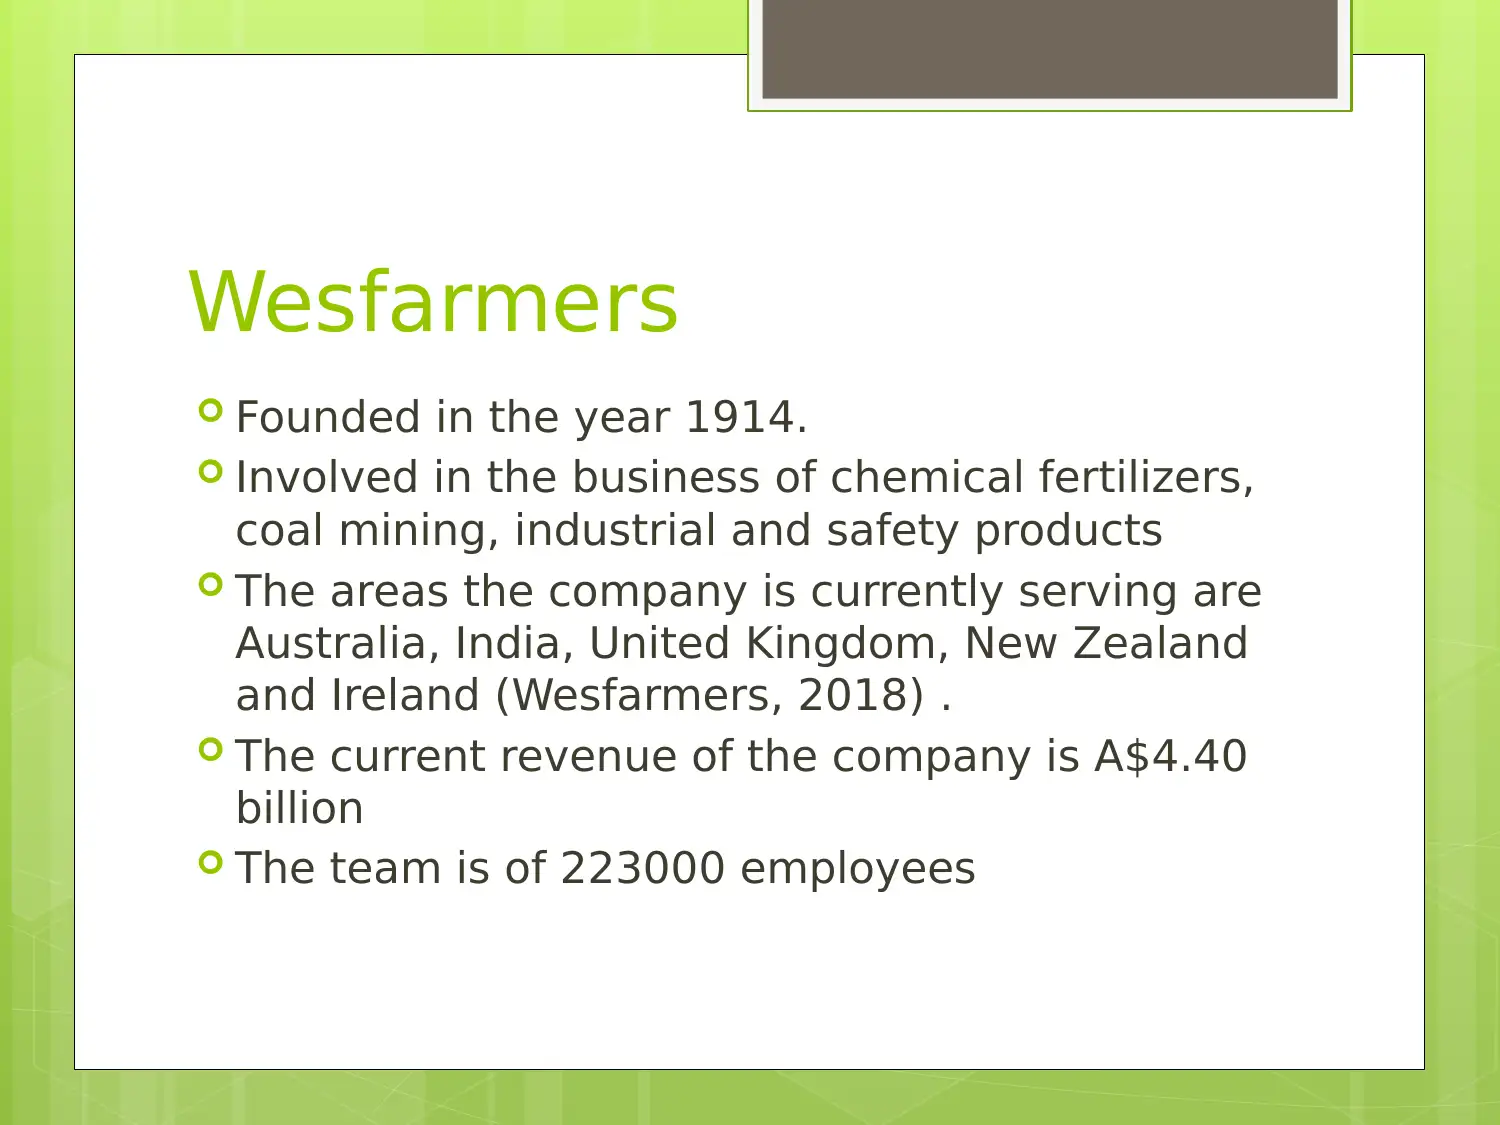
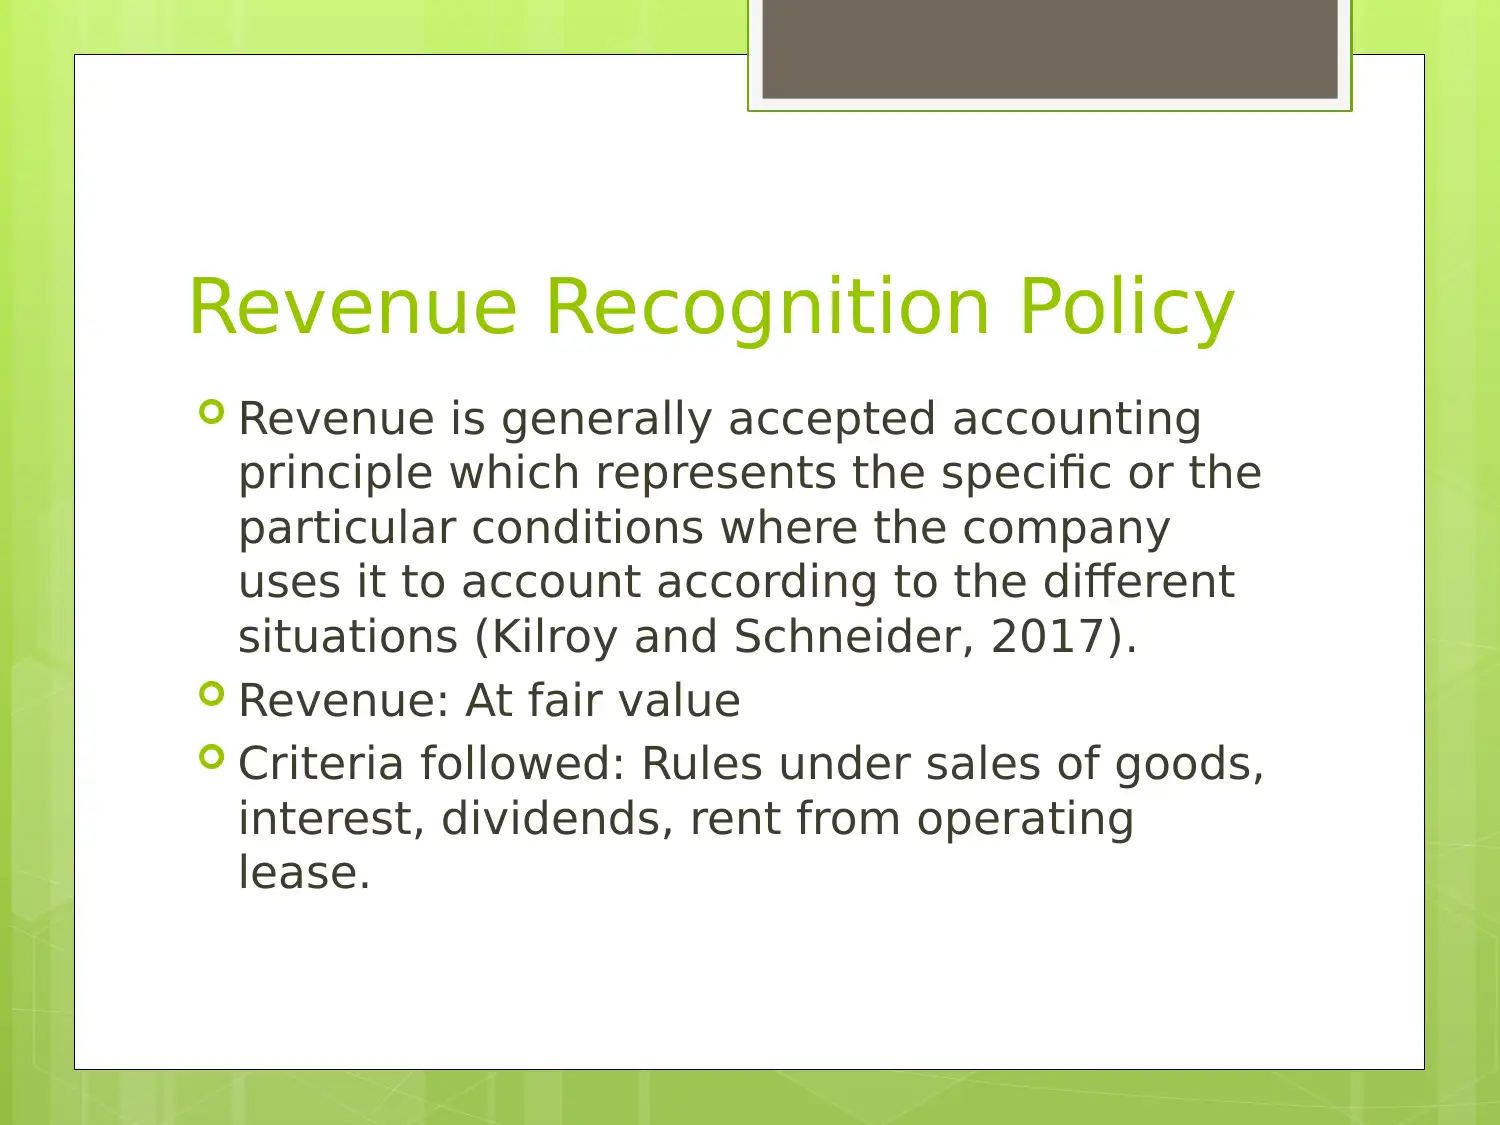
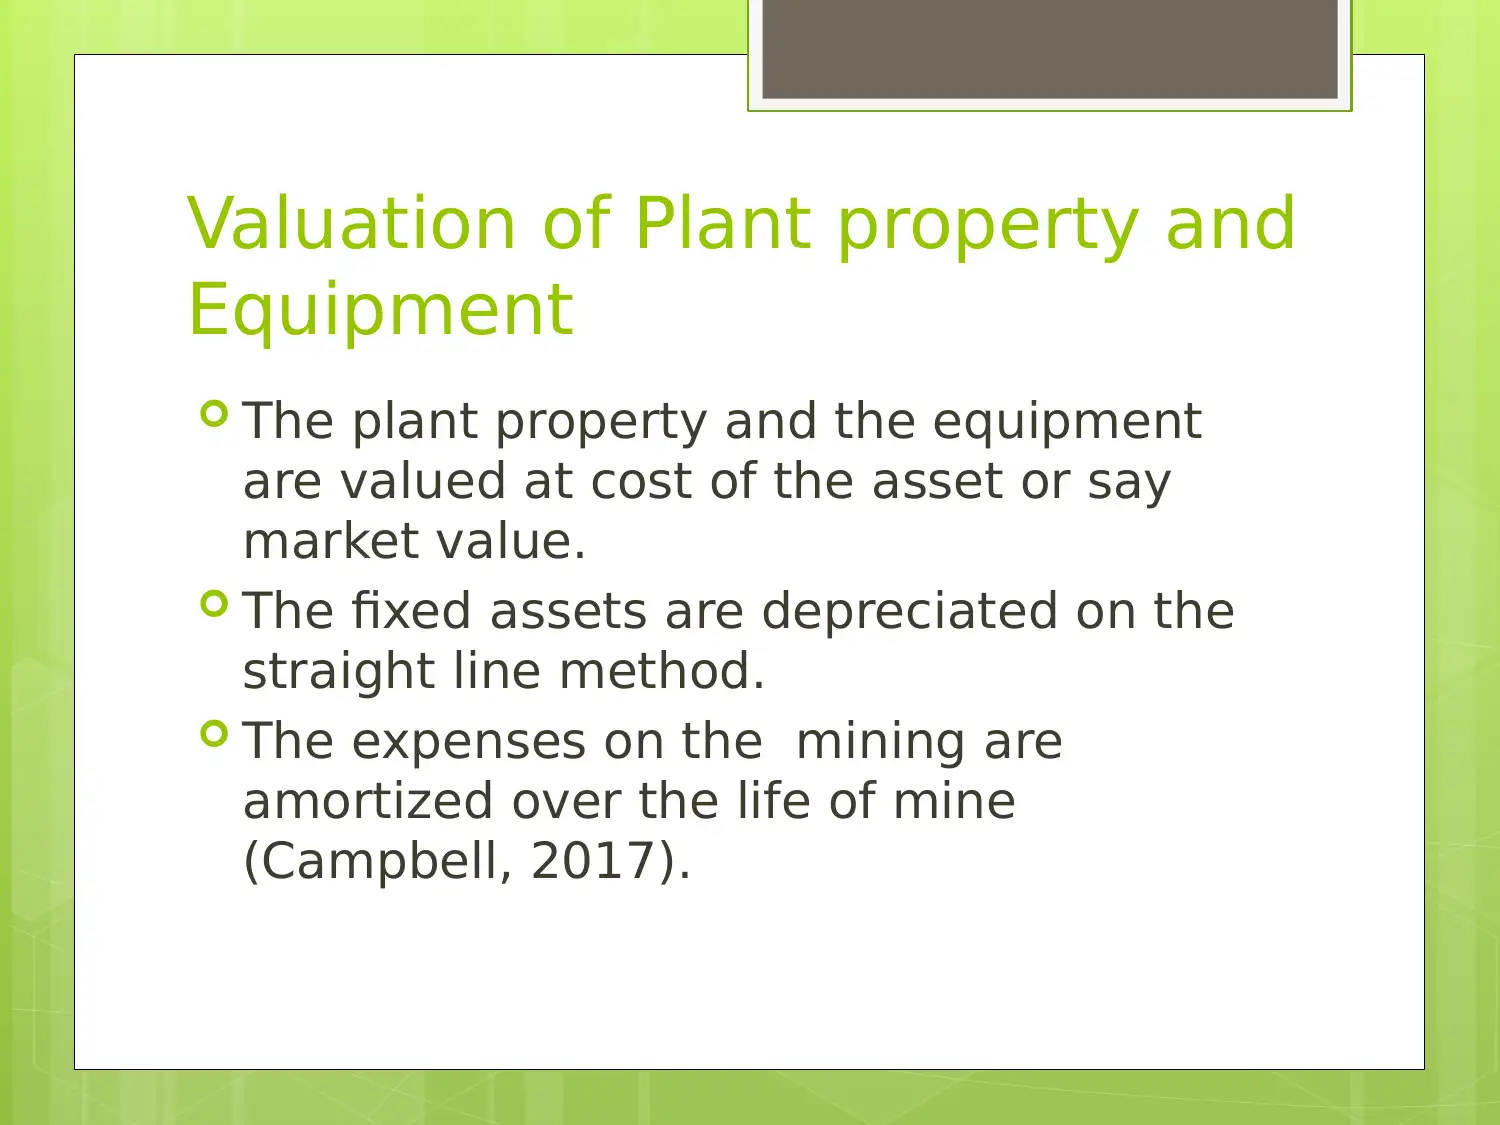
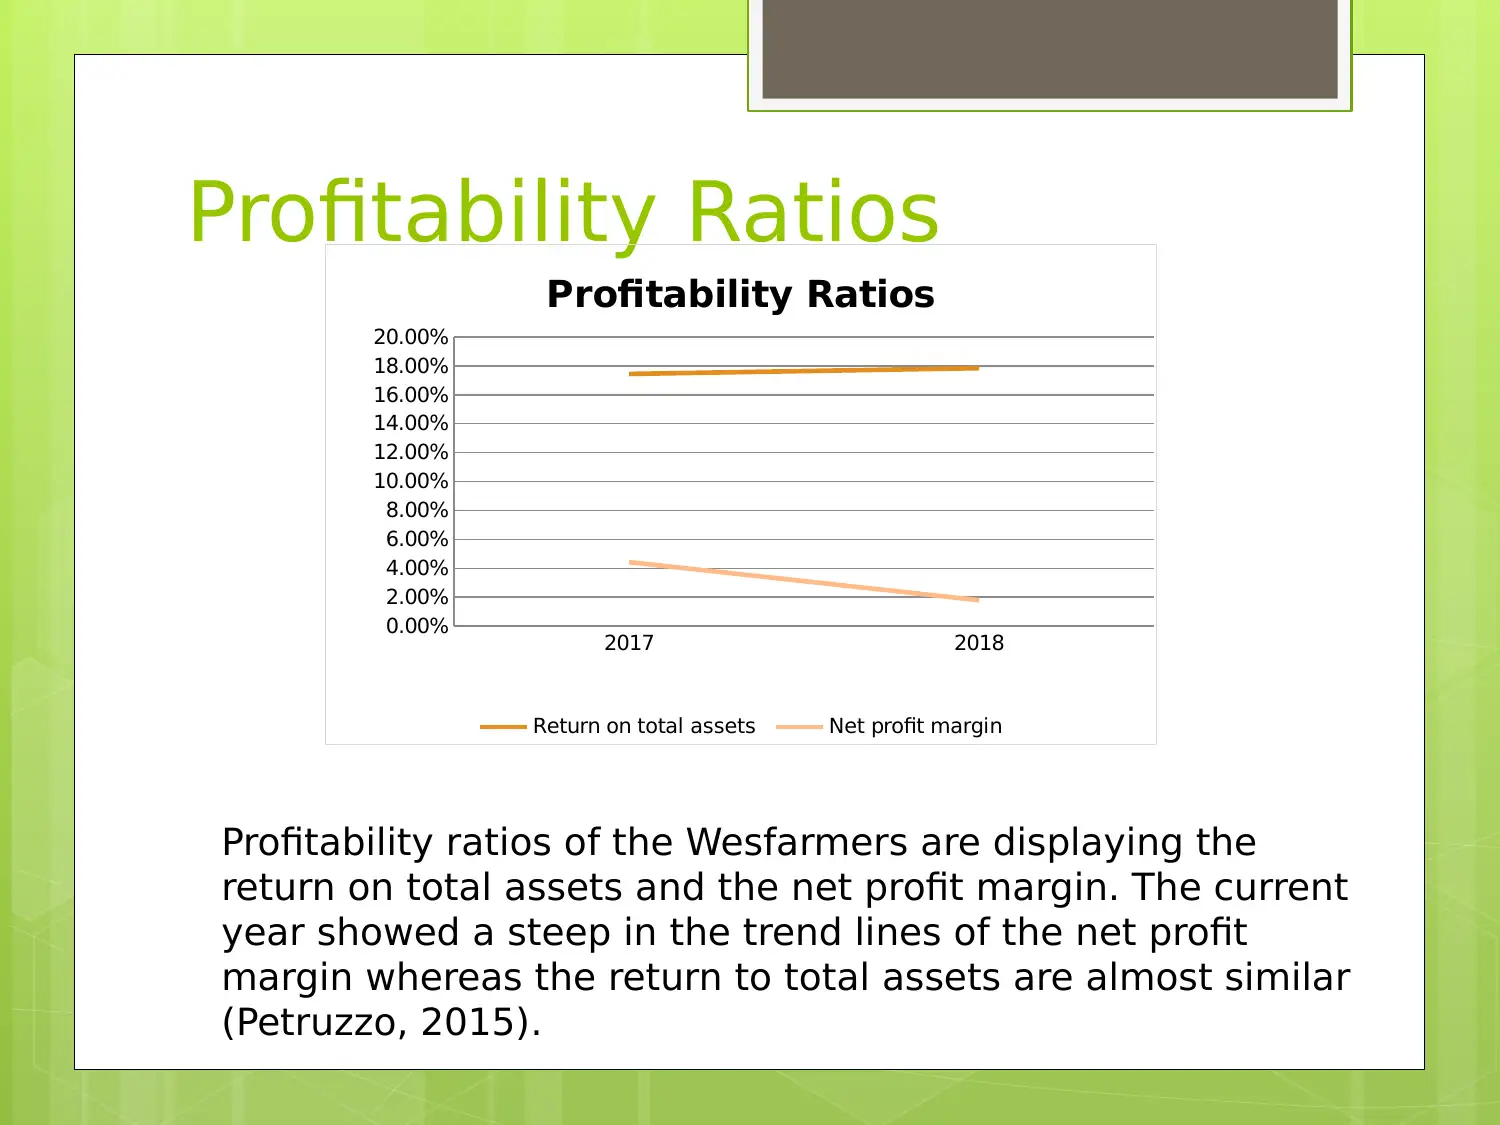
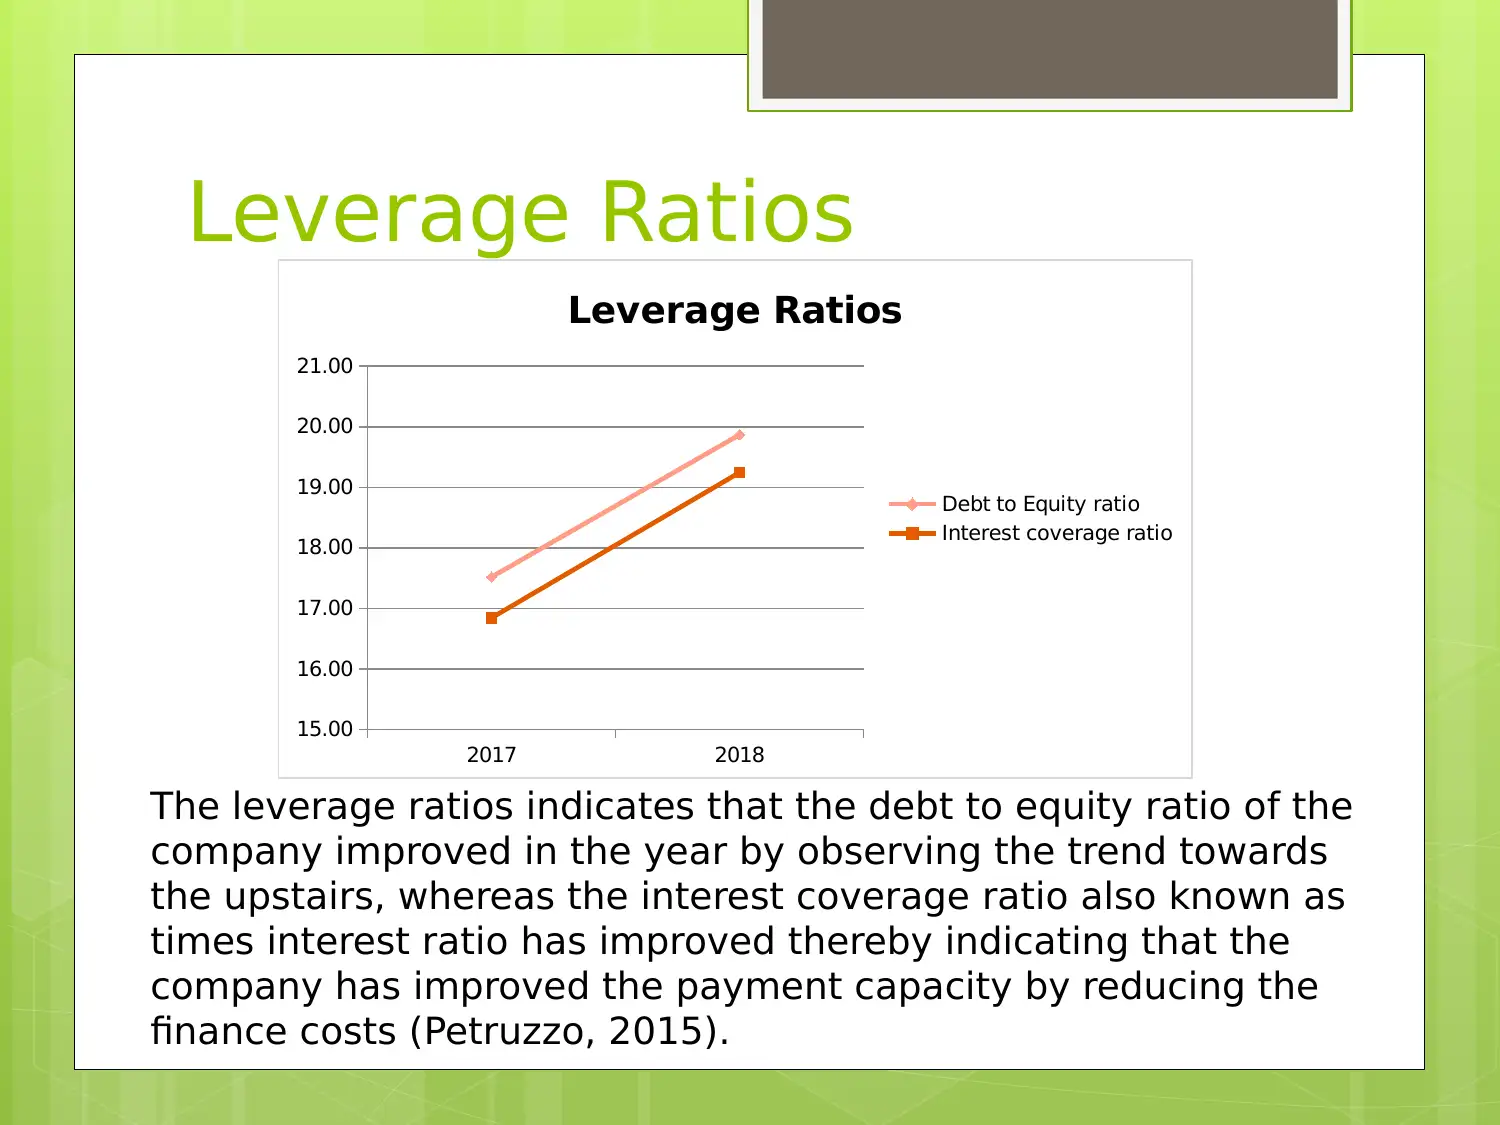
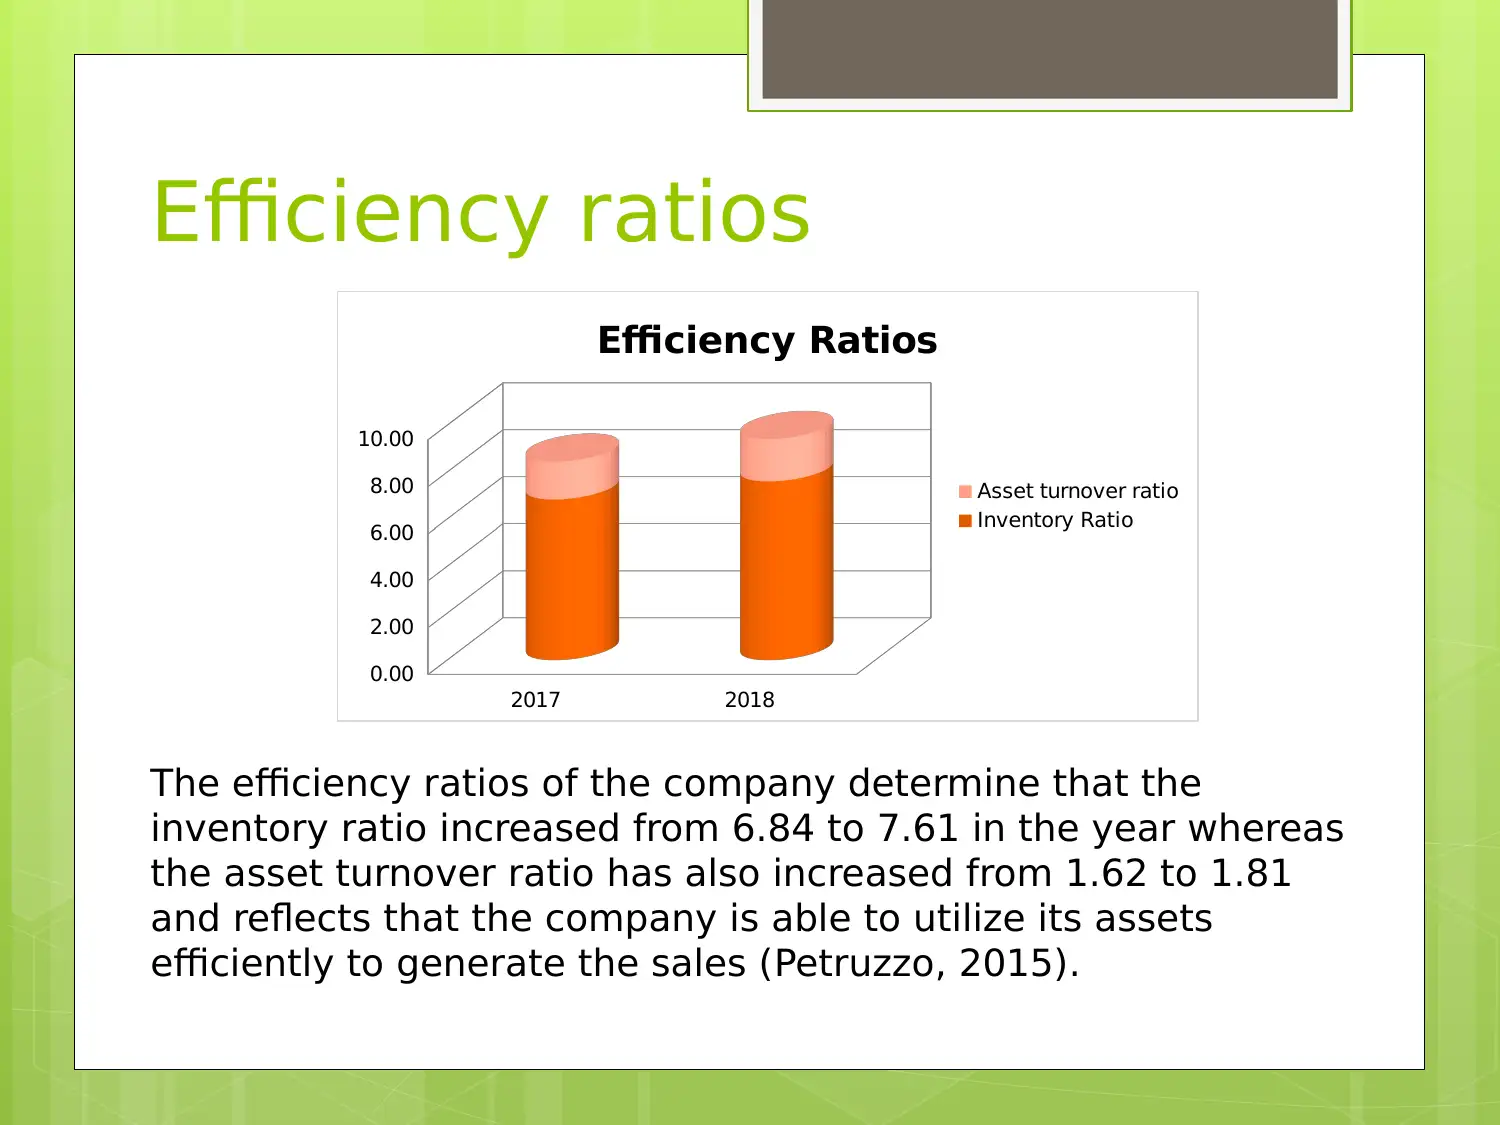
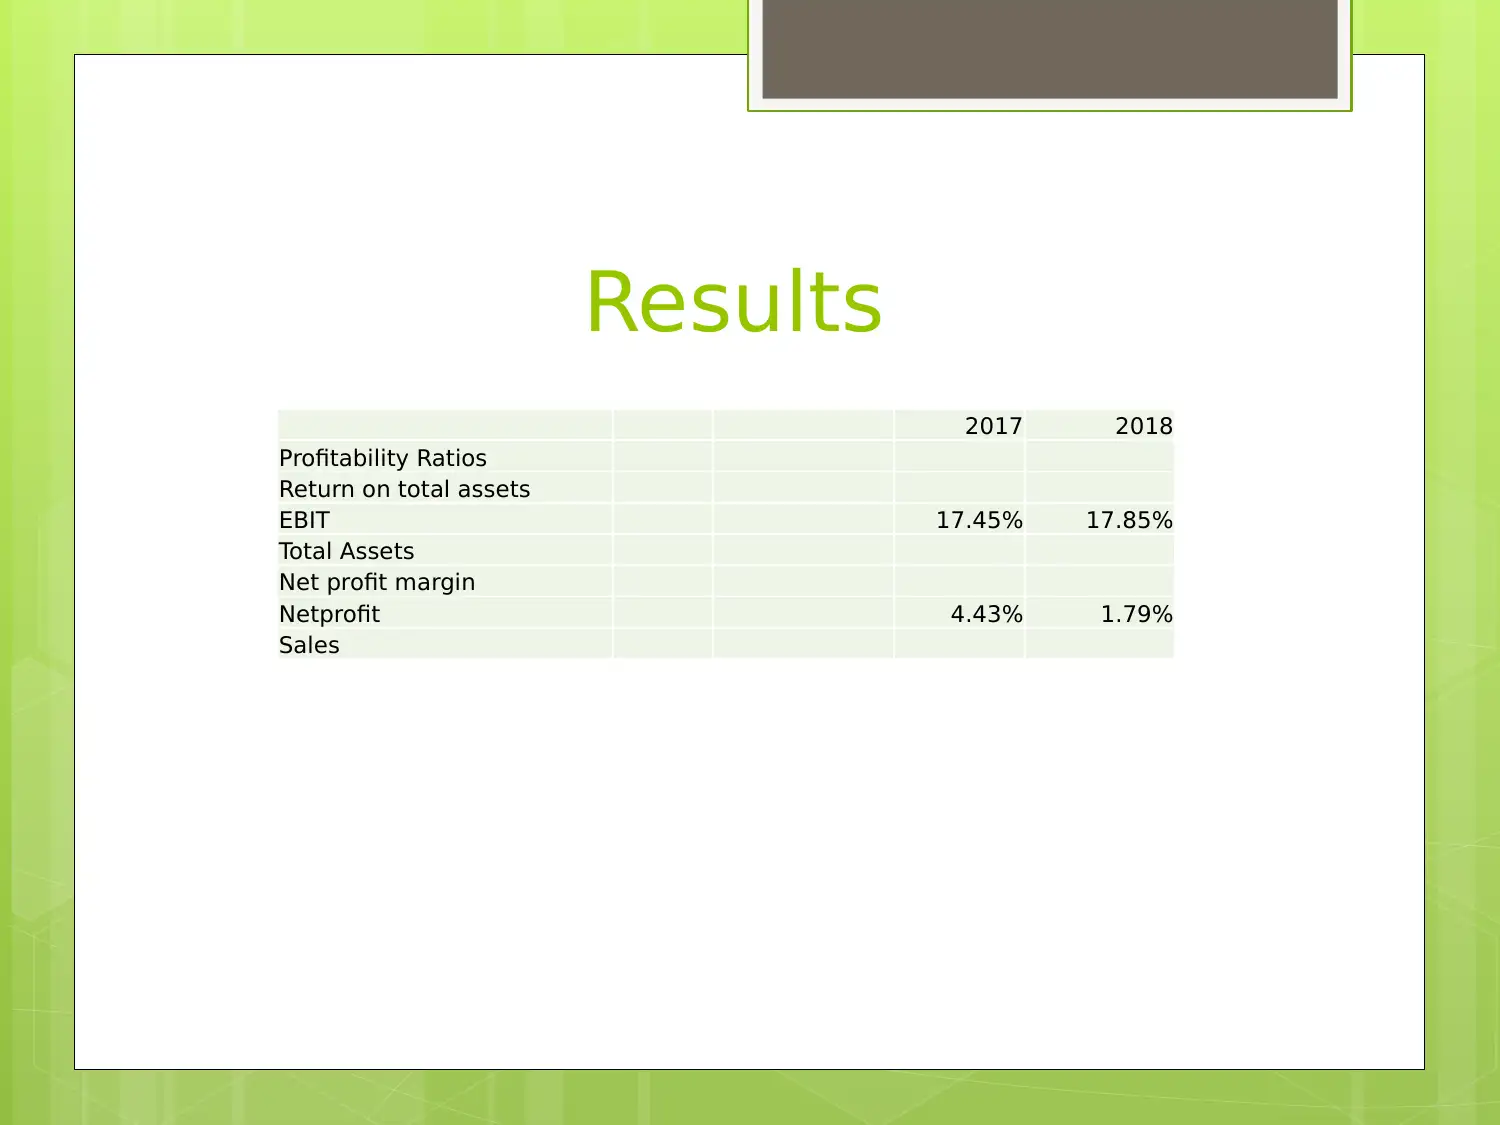
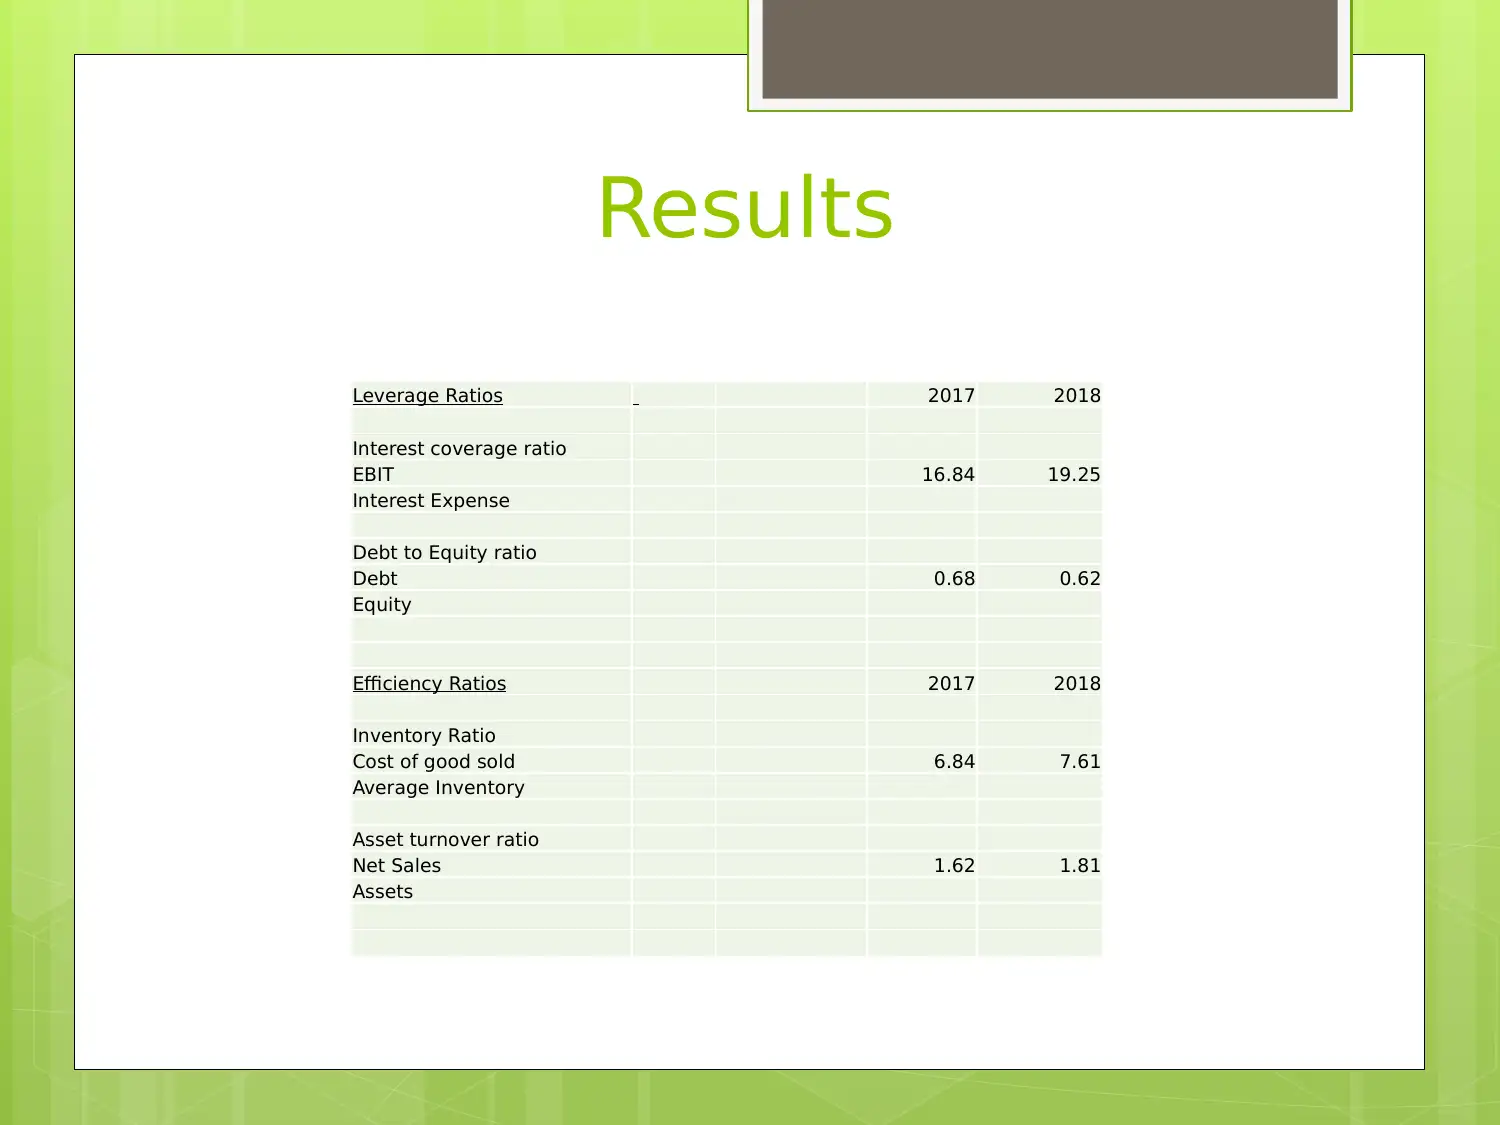
This report presents a comprehensive analysis of Wesfarmers, a major Australian retail company, examining its financial performance based on its annual report. The analysis includes an overview of the company's revenue recognition policy, valuation of plant property and equipment, and the role of its auditors. Key aspects of Wesfarmers' sustainability initiatives are also discussed. The report delves into profitability ratios, leverage ratios, and efficiency ratios, comparing the company's performance between 2017 and 2018. The findings highlight trends in return on total assets, net profit margin, debt-to-equity ratio, interest coverage ratio, asset turnover ratio, and inventory ratio. The analysis incorporates data from the company's annual reports and provides references for further study.

Wesfarmers
Analysis
Analysis
Paraphrase This Document
Need a fresh take? Get an instant paraphrase of this document with our AI Paraphraser

Wesfarmers
Founded in the year 1914.
Involved in the business of chemical fertilizers,
coal mining, industrial and safety products
The areas the company is currently serving are
Australia, India, United Kingdom, New Zealand
and Ireland (Wesfarmers, 2018) .
The current revenue of the company is A$4.40
billion
The team is of 223000 employees

Revenue Recognition Policy
Revenue is generally accepted accounting
principle which represents the specific or the
particular conditions where the company
uses it to account according to the different
situations (Kilroy and Schneider, 2017).
Revenue: At fair value
Criteria followed: Rules under sales of goods,
interest, dividends, rent from operating
lease.
⊘ This is a preview!⊘
Do you want full access?
Subscribe today to unlock all pages.

Trusted by 1+ million students worldwide

Valuation of Plant property and
Equipment
The plant property and the equipment
are valued at cost of the asset or say
market value.
The fixed assets are depreciated on the
straight line method.
The expenses on the mining are
amortized over the life of mine
(Campbell, 2017).
Equipment
The plant property and the equipment
are valued at cost of the asset or say
market value.
The fixed assets are depreciated on the
straight line method.
The expenses on the mining are
amortized over the life of mine
(Campbell, 2017).
Paraphrase This Document
Need a fresh take? Get an instant paraphrase of this document with our AI Paraphraser

Auditors and the Audit
firm
The Ernst and Young is the auditing firm for
the Wesfarmers.
The primary purpose of the audit is to deliver
the opinion on the financial statements so as
to give the true and the fair value of the
financial statements (Chen, Lin and Siregar,
2018).
The third party audits are essential and
required to give the unbiased opinion on the
review of the financial statements.

Initiatives towards the
Sustainability
The sustainability of the company can be
determined by the core values which are
as follows.
Employee ratio: Women's are 54%
Production: 96% of the fresh produces,
lamb, pork and chicken beef
(Wesfarmers, 2018)
Reduced the carbon emission by 6% as
compared to the last year.
Sustainability
The sustainability of the company can be
determined by the core values which are
as follows.
Employee ratio: Women's are 54%
Production: 96% of the fresh produces,
lamb, pork and chicken beef
(Wesfarmers, 2018)
Reduced the carbon emission by 6% as
compared to the last year.
⊘ This is a preview!⊘
Do you want full access?
Subscribe today to unlock all pages.

Trusted by 1+ million students worldwide

Profitability Ratios
2017 2018
0.00%
2.00%
4.00%
6.00%
8.00%
10.00%
12.00%
14.00%
16.00%
18.00%
20.00%
Profitability Ratios
Return on total assets Net profit margin
Profitability ratios of the Wesfarmers are displaying the
return on total assets and the net profit margin. The current
year showed a steep in the trend lines of the net profit
margin whereas the return to total assets are almost similar
(Petruzzo, 2015).
Paraphrase This Document
Need a fresh take? Get an instant paraphrase of this document with our AI Paraphraser

Leverage Ratios
2017 2018
15.00
16.00
17.00
18.00
19.00
20.00
21.00
Leverage Ratios
Debt to Equity ratio
Interest coverage ratio
The leverage ratios indicates that the debt to equity ratio of the
company improved in the year by observing the trend towards
the upstairs, whereas the interest coverage ratio also known as
times interest ratio has improved thereby indicating that the
company has improved the payment capacity by reducing the
finance costs (Petruzzo, 2015).

Efficiency ratios
2017 2018
0.00
2.00
4.00
6.00
8.00
10.00
Efficiency Ratios
Asset turnover ratio
Inventory Ratio
The efficiency ratios of the company determine that the
inventory ratio increased from 6.84 to 7.61 in the year whereas
the asset turnover ratio has also increased from 1.62 to 1.81
and reflects that the company is able to utilize its assets
efficiently to generate the sales (Petruzzo, 2015).
⊘ This is a preview!⊘
Do you want full access?
Subscribe today to unlock all pages.

Trusted by 1+ million students worldwide

Results
2017 2018
Profitability Ratios
Return on total assets
EBIT 17.45% 17.85%
Total Assets
Net profit margin
Netprofit 4.43% 1.79%
Sales
2017 2018
Profitability Ratios
Return on total assets
EBIT 17.45% 17.85%
Total Assets
Net profit margin
Netprofit 4.43% 1.79%
Sales
Paraphrase This Document
Need a fresh take? Get an instant paraphrase of this document with our AI Paraphraser

Results
Leverage Ratios 2017 2018
Interest coverage ratio
EBIT 16.84 19.25
Interest Expense
Debt to Equity ratio
Debt 0.68 0.62
Equity
Efficiency Ratios 2017 2018
Inventory Ratio
Cost of good sold 6.84 7.61
Average Inventory
Asset turnover ratio
Net Sales 1.62 1.81
Assets
Leverage Ratios 2017 2018
Interest coverage ratio
EBIT 16.84 19.25
Interest Expense
Debt to Equity ratio
Debt 0.68 0.62
Equity
Efficiency Ratios 2017 2018
Inventory Ratio
Cost of good sold 6.84 7.61
Average Inventory
Asset turnover ratio
Net Sales 1.62 1.81
Assets

References
Wesfarmers, (2018) Annual report [Online] Available from
https://www.wesfarmers.com.au/docs/default-source/reports/wes18-044-2018-annual-
report.pdf?sfvrsn=4
[Accessed on 21st January 2019]
Wesfarmers, (2018) Sustainability [Online] Available from
https://sustainability.wesfarmers.com.au/media/2467/sustainability_website_2018.pdf
[Accessed on 21st January 2019]
Campbell, J., 2017. Insights from the company monitor: Wesfarmers. Equity, 31(8),
p.16.
Kilroy, D. and Schneider, M., 2017. Valuing the Current Strategy. In Customer Value,
Shareholder Wealth, Community Wellbeing (pp. 109-141). Palgrave Macmillan, Cham.
Chen, K., Lin, A. and Siregar, D., 2018. Auditor Reputation, Auditor Independence and
the Underpricing of IPOs. Journal of Applied Business & Economics, 20(6).
Petruzzo, P., Gazarian, A., Kanitakis, J., Parmentier, H., Guigal, V., Guillot, M., Vial, C.,
Dubernard, J.M., Morelon, E. and Badet, L., 2015. Outcomes after bilateral hand
allotransplantation: a risk/benefit ratio analysis. Annals of surgery, 261(1), pp.213-
220.
⊘ This is a preview!⊘
Do you want full access?
Subscribe today to unlock all pages.

Trusted by 1+ million students worldwide
1 out of 12
Related Documents

Your All-in-One AI-Powered Toolkit for Academic Success.
+13062052269
info@desklib.com
Available 24*7 on WhatsApp / Email
Unlock your academic potential
Copyright © 2020–2025 A2Z Services. All Rights Reserved. Developed and managed by ZUCOL.