ACCT2005 - Financial Analysis: Annual Report Analysis & Interpretation
VerifiedAdded on 2023/06/13
|7
|874
|352
Report
AI Summary
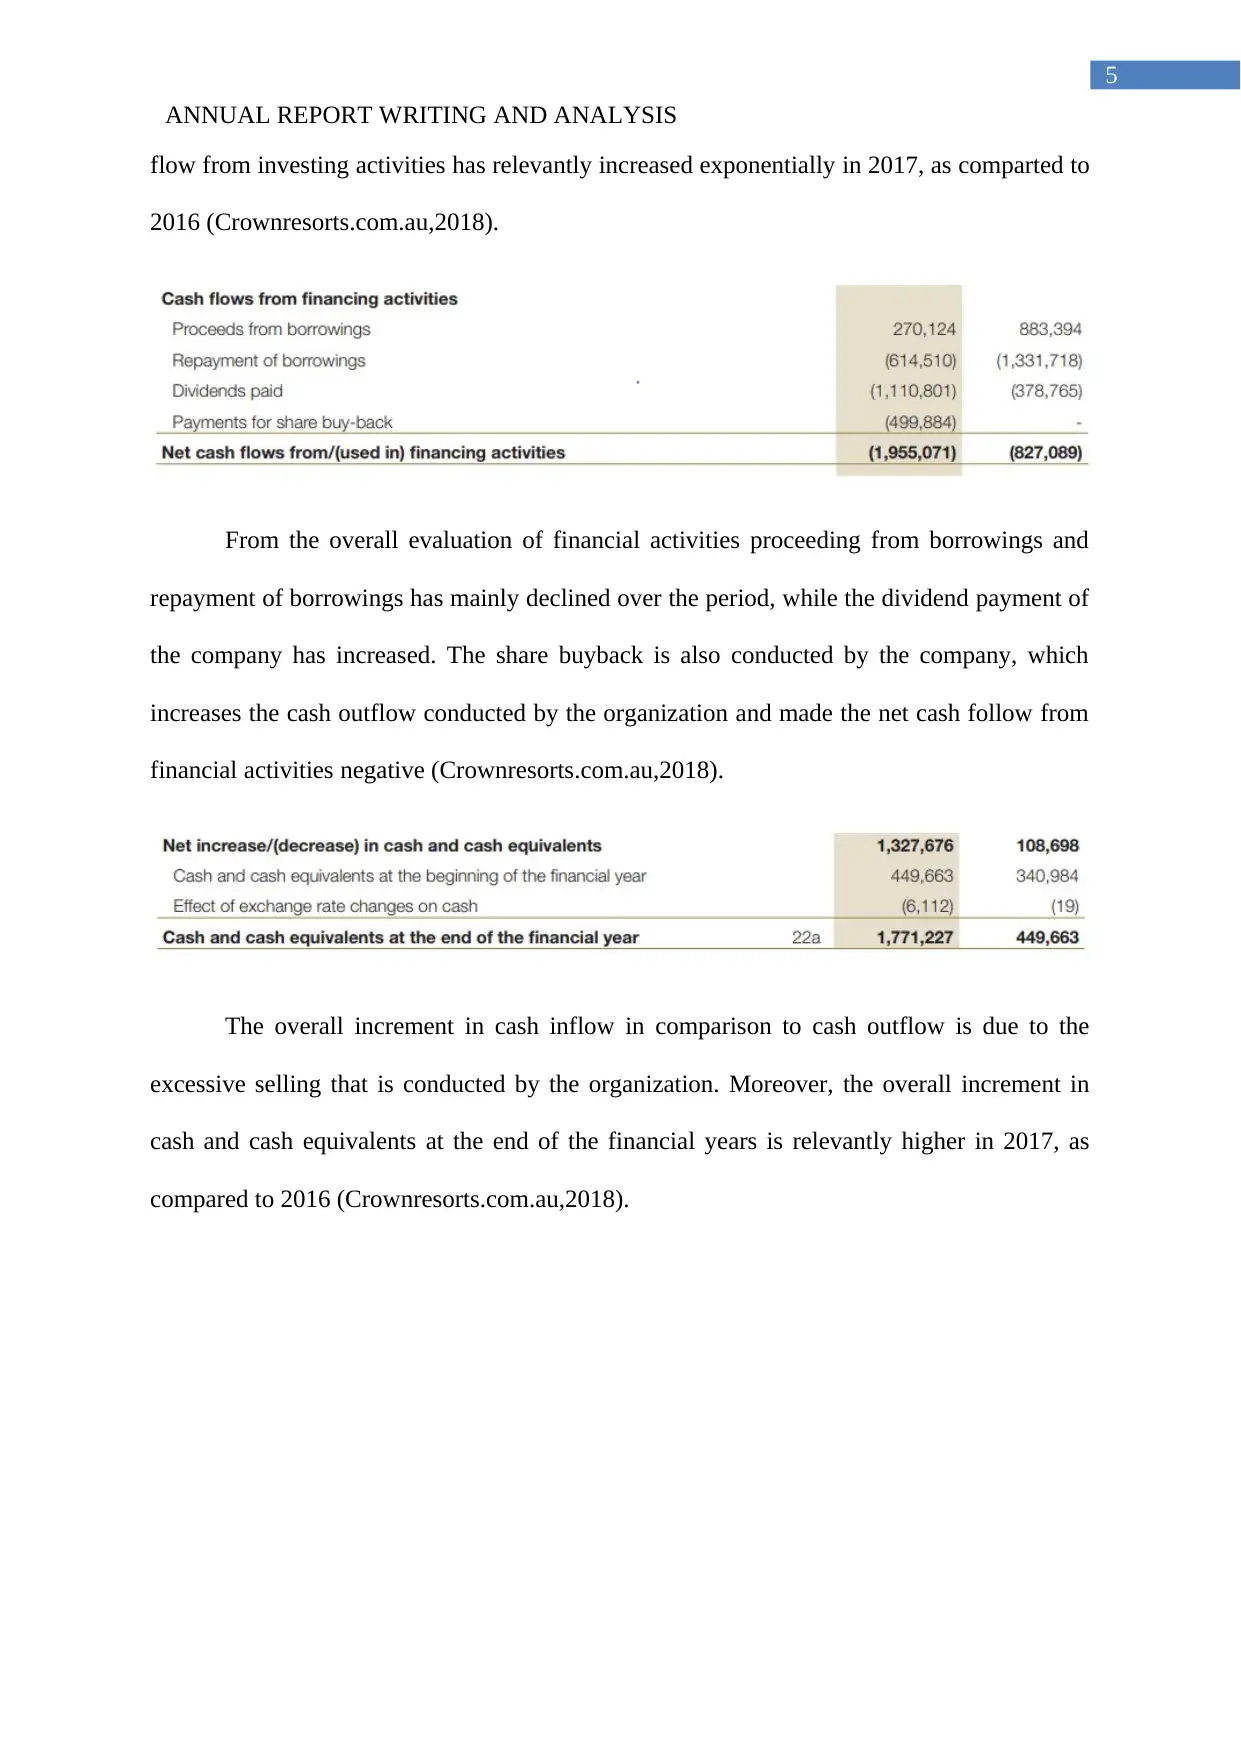
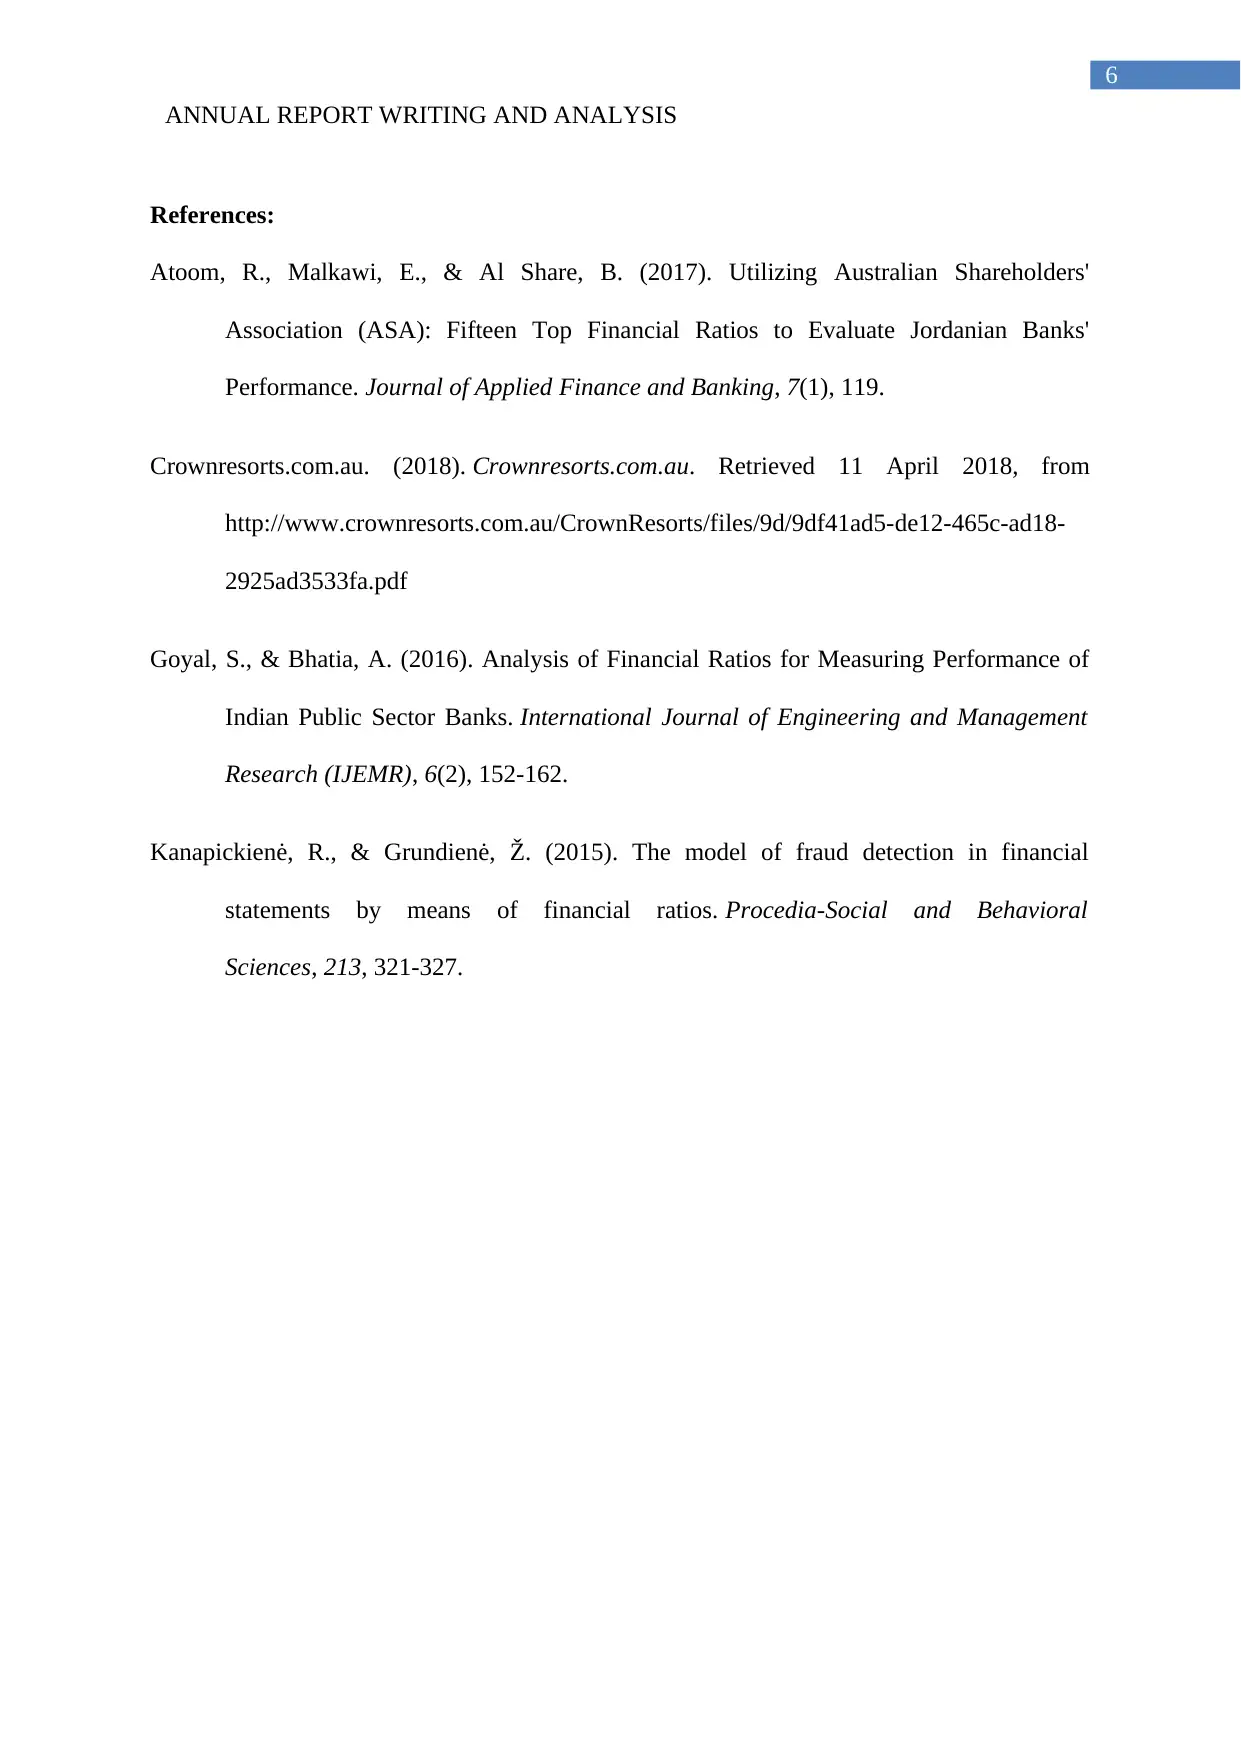
This report provides a detailed financial analysis of a company based on its annual report, focusing on key financial ratios, cash flow analysis, and overall financial performance. The analysis involves selecting key ratios for investment, financing, and operating activities, evaluating trends, and interpreting the company's financial health. The cash flow analysis examines operating, investing, and financing activities to understand the sources and uses of cash. The report aims to provide insights into the company's financial structure, risks, and returns, utilizing information from the annual report to assess its performance and financial position. Desklib offers a wide range of solved assignments and past papers for students.

1 out of 7
Related Documents


Your All-in-One AI-Powered Toolkit for Academic Success.
+13062052269
info@desklib.com
Available 24*7 on WhatsApp / Email
![[object Object]](/_next/static/media/star-bottom.7253800d.svg)
Copyright © 2020–2026 A2Z Services. All Rights Reserved. Developed and managed by ZUCOL.