ACCT20075 Auditing: A Financial Analysis Report on Charter Hall REIT
VerifiedAdded on 2023/06/07
|13
|3085
|182
Report
AI Summary
This report provides a financial analysis of Charter Hall Retail REIT, an Australian property trust, using its 2017 annual report. It assesses materiality concerns, conducts a preliminary analytical review, and analyzes the company's cash flow statement. The report highlights key accounting outcomes, operational performance, and ratio analysis, comparing them with industry benchmarks. It also discusses the company's investment strategies and financial health, concluding that Charter Hall Retail REIT demonstrates strong financial performance and growth potential. Desklib is a great platform to find similar solved assignments and past papers.
Finance Assignment
Paraphrase This Document
Need a fresh take? Get an instant paraphrase of this document with our AI Paraphraser
1
By student name
Professor
University
Date: 25 April 2018.
1 | P a g e
By student name
Professor
University
Date: 25 April 2018.
1 | P a g e
2
Executive Summary
In the given assignment, a report has to be prepared using the annual report of the company. The
company being chosen here is Charter Hall Retail REIT, which is listed on the Australian
Property Trust. Charter Hall Retail REIT introduces in the great standard Australian supermarket
moor area and nearby located regional centres of shopping. The portfolio of Australia is
geologically diverted and the advantages with the subjection to important centres including the
seaboard of the east and covering a count of big expansion areas in the West Australia as well as
Queensland.
Charter Hall Retail REIT is monitored with the Charter Hall Group (ASX:CHC), is among the
lead group property in Australia that actually holds as well as monitors workplaces, retails as
well as properties of industries. Charter Hall possesses greater than 27 years occurrence
monitoring bigger standard workplace, retail as well as property of industry from the side of
institution, wholesalers and retailer buyers, along with the investment under the managing
department that totals to $23.2 billion.
2 | P a g e
⊘ This is a preview!⊘
Do you want full access?
Subscribe today to unlock all pages.
Trusted by 1+ million students worldwide
3
Contents
Executive Summary.....................................................................................................................................2
Section 1: Materiality concern of the entity................................................................................................4
Section 2: Preliminary analytical review of the company............................................................................5
Preliminary..............................................................................................................................................5
Important accounting outcomes.............................................................................................................6
Operational Sumary of the performance.................................................................................................6
Analytical Review.....................................................................................................................................7
Section 3: Analysis of the cash flow statement of the company.................................................................8
References.................................................................................................................................................10
3 | P a g e
Paraphrase This Document
Need a fresh take? Get an instant paraphrase of this document with our AI Paraphraser
4
Section 1: Materiality concern of the entity
The Materiality is a measure in accounting as well as auditing by which an Auditor estimated the
amount of shortfalls, shortcomings, issues in any transactions and deficit in the books of
accounts. The concept of materiality is wider. It is not narrower and have broader aspects as
well. As we know that the primary objective of performing audit is to see if the financial
statements shows true and fair view and if they are free from misstatements or not. This
estimations and bar of the misstatements are measured based on Audit materiality (Erik & Jan,
2017).
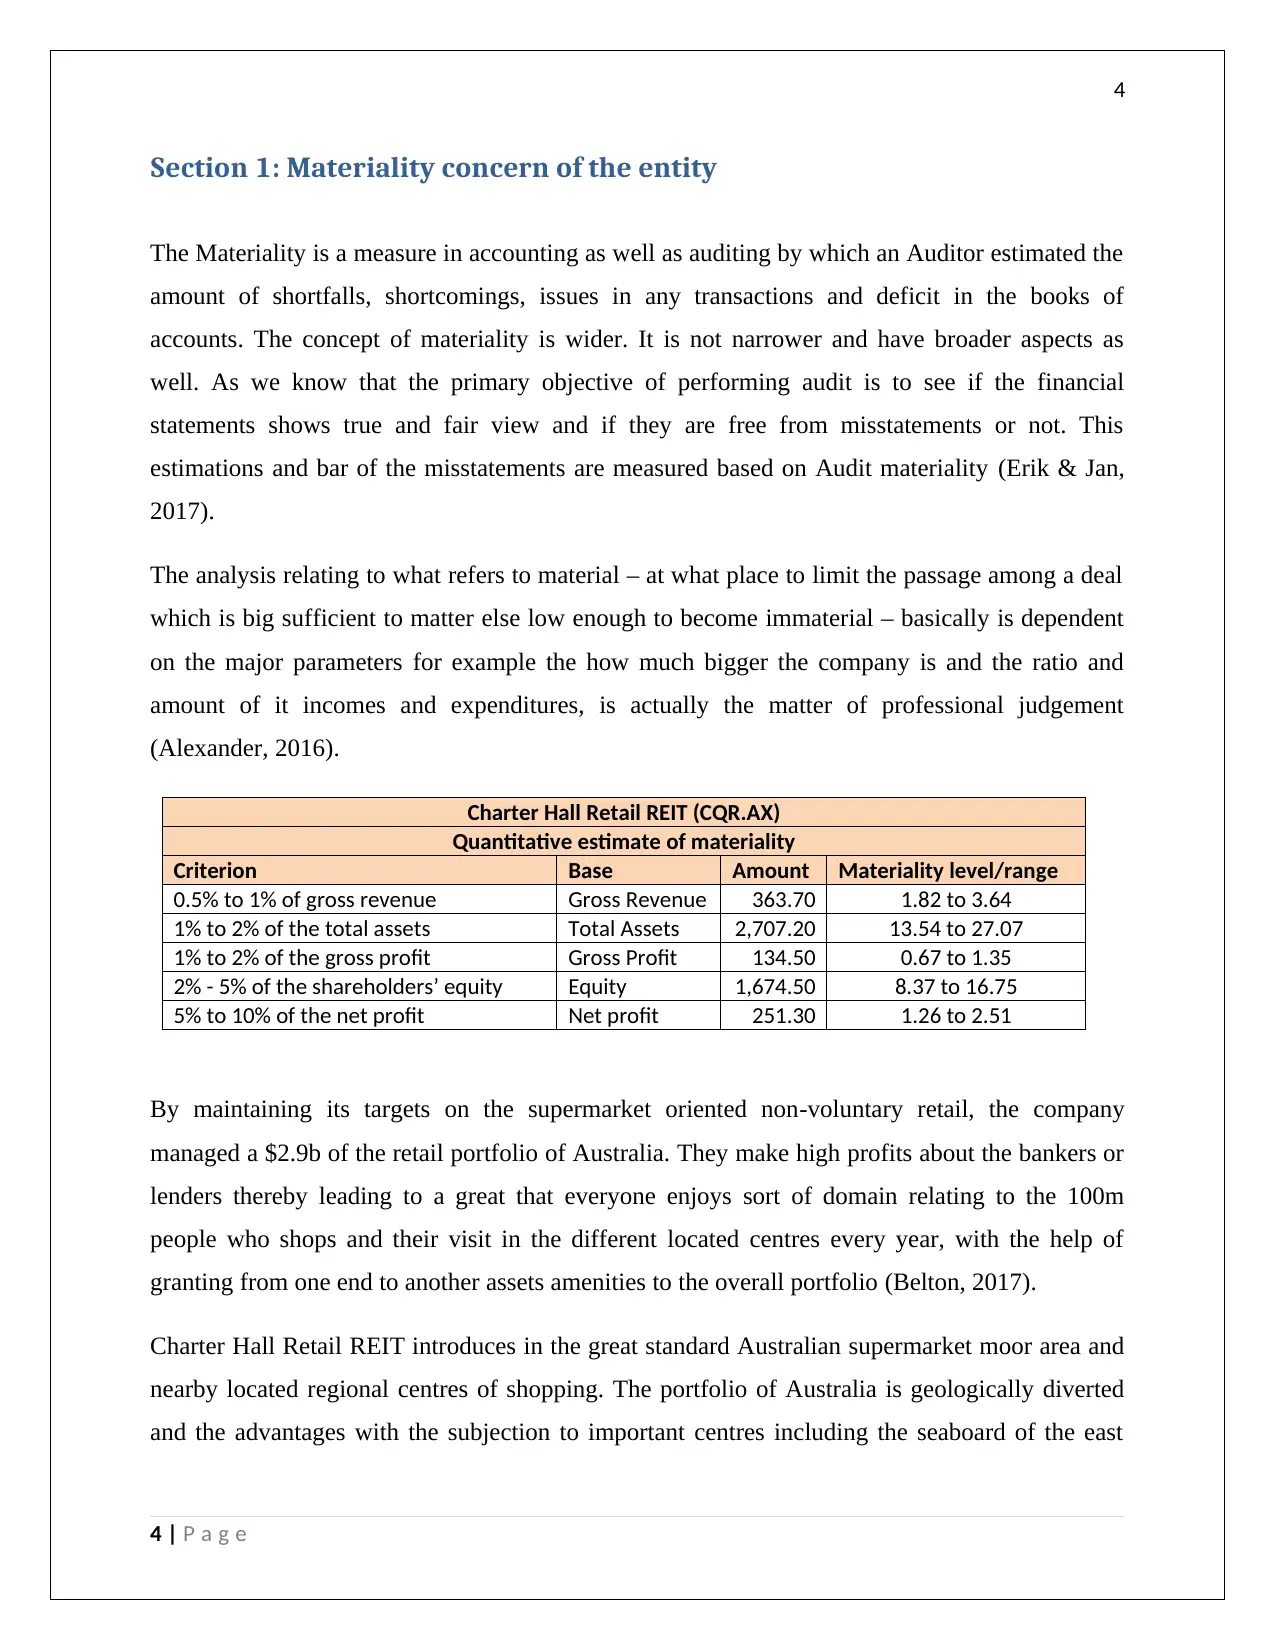
The analysis relating to what refers to material – at what place to limit the passage among a deal
which is big sufficient to matter else low enough to become immaterial – basically is dependent
on the major parameters for example the how much bigger the company is and the ratio and
amount of it incomes and expenditures, is actually the matter of professional judgement
(Alexander, 2016).
Charter Hall Retail REIT (CQR.AX)
Quantitative estimate of materiality
Criterion Base Amount Materiality level/range
0.5% to 1% of gross revenue Gross Revenue 363.70 1.82 to 3.64
1% to 2% of the total assets Total Assets 2,707.20 13.54 to 27.07
1% to 2% of the gross profit Gross Profit 134.50 0.67 to 1.35
2% - 5% of the shareholders’ equity Equity 1,674.50 8.37 to 16.75
5% to 10% of the net profit Net profit 251.30 1.26 to 2.51
By maintaining its targets on the supermarket oriented non-voluntary retail, the company
managed a $2.9b of the retail portfolio of Australia. They make high profits about the bankers or
lenders thereby leading to a great that everyone enjoys sort of domain relating to the 100m
people who shops and their visit in the different located centres every year, with the help of
granting from one end to another assets amenities to the overall portfolio (Belton, 2017).
Charter Hall Retail REIT introduces in the great standard Australian supermarket moor area and
nearby located regional centres of shopping. The portfolio of Australia is geologically diverted
and the advantages with the subjection to important centres including the seaboard of the east
4 | P a g e
Section 1: Materiality concern of the entity
The Materiality is a measure in accounting as well as auditing by which an Auditor estimated the
amount of shortfalls, shortcomings, issues in any transactions and deficit in the books of
accounts. The concept of materiality is wider. It is not narrower and have broader aspects as
well. As we know that the primary objective of performing audit is to see if the financial
statements shows true and fair view and if they are free from misstatements or not. This
estimations and bar of the misstatements are measured based on Audit materiality (Erik & Jan,
2017).
The analysis relating to what refers to material – at what place to limit the passage among a deal
which is big sufficient to matter else low enough to become immaterial – basically is dependent
on the major parameters for example the how much bigger the company is and the ratio and
amount of it incomes and expenditures, is actually the matter of professional judgement
(Alexander, 2016).
Charter Hall Retail REIT (CQR.AX)
Quantitative estimate of materiality
Criterion Base Amount Materiality level/range
0.5% to 1% of gross revenue Gross Revenue 363.70 1.82 to 3.64
1% to 2% of the total assets Total Assets 2,707.20 13.54 to 27.07
1% to 2% of the gross profit Gross Profit 134.50 0.67 to 1.35
2% - 5% of the shareholders’ equity Equity 1,674.50 8.37 to 16.75
5% to 10% of the net profit Net profit 251.30 1.26 to 2.51
By maintaining its targets on the supermarket oriented non-voluntary retail, the company
managed a $2.9b of the retail portfolio of Australia. They make high profits about the bankers or
lenders thereby leading to a great that everyone enjoys sort of domain relating to the 100m
people who shops and their visit in the different located centres every year, with the help of
granting from one end to another assets amenities to the overall portfolio (Belton, 2017).
Charter Hall Retail REIT introduces in the great standard Australian supermarket moor area and
nearby located regional centres of shopping. The portfolio of Australia is geologically diverted
and the advantages with the subjection to important centres including the seaboard of the east
4 | P a g e
5
and covering a count of big expansion areas in the West Australia as well as Queensland
(Goldmann, 2016).
Charter Hall Retail REIT is monitored with the Charter Hall Group (ASX:CHC), is among the
lead group property in Australia that actually holds as well as monitors workplaces, retails as
well as properties of industries. Charter Hall possesses greater than 27 years occurrence
monitoring bigger standard workplace, retail as well as property of industry from the side of
institution, wholesalers and retailer buyers, along with the investment under the managing
department that totals to $23.2 billion (Trieu, 2017).
In the auditor’s report, the auditors have mentioned that the materiality being considered by them
is 5% of the operating earnings as the benchmark for deciding on the materiality as it is the
benchmark, which should reflect the performance of the group, and it is a commonly used
benchmark in the property industry (Grenier, 2017).
5 | P a g e
⊘ This is a preview!⊘
Do you want full access?
Subscribe today to unlock all pages.
Trusted by 1+ million students worldwide
6
Section 2: Preliminary analytical review of the company
Preliminary
The Charter Hall Retail REIT (ASX:CQR) (CQR or the REIT) when broadcasted the reports
about it half year 31 December 2017.
Important accounting outcomes
It earnings of operation of $61.9m or 15.30% each unit, and an enhancement of 0.6% on
the previous related time.
Distributing of 14% each quantity, and maintenance of a continuous give away ratio
range among 90% to 95% (Farmer, 2018).
The tangible assets after all deductions and exclusions (i.e. NTA) by 1.5% until $4.19
each quantity.
A well-formatted ad presented balance sheet yielding a 33.9% after asset sales left in the
central of the 30-40% ambit.
The value of portfolio that is of $2.9 billion, increased by 5.2%, which is from $2.8
billion at June 2017.
Repayment and cancellation $50 million facility of credit. None of the credits now
matures until Financial Year 21 (Das, 2017).
Operational Summary of the performance
Acquiring of Salamander Bay, NSW and Highfields, QLD for $215.5 million yielding a
return of 6.0%. Sold off 11 lower growth properties for $229.8 million1 at a mean return
of 6.9%.
Started $70 million2 of overhauling work at Lake Macquarie, NSW and Wanneroo, WA
Similar actual income of property (NPI) growth of 1.3% pcp
Bigger MAT growth in 4.1% for retails in sales (Choy, 2018)
6 | P a g e
Paraphrase This Document
Need a fresh take? Get an instant paraphrase of this document with our AI Paraphraser
7
Investment MAT growth of 2.3%
Finished 118 renewals of lease and fresh leases in the count of 74 that shows continuity
in the target on the efficient leases.
Firm tenancy at 97.8%.
Hager WALE at 10.8 years as well as investment WALE at 6.7 years (Arnott, Lizama, &
Song, 2017)
Charter Hall’s Retail CEO, Greg Chubb said: “We have repositioned the portfolio for growth a
process that began 18 months ago. The focus of the portfolio continues to remain on convenience
based non- discretionary retail uses driven by Australia’s leading major supermarket brands who
have delivered a combined MAT growth of 2.9%.”
Analytical Review
Charter Hall Retail REIT (CQR.AX)
Ratio Analysis
Particulars Company Industry Sector
P/E Ratio 11.73 31.33 19.21
Price to Sales 7.54 10.97 6.38
Dividend Yield 6.64 3.81 2.35
Dividend Payout Ratio 77.66% 99.30% 34.23%
Current Ratio 1.25 0.90 2.00
Total Debt to Equity 54.82% 98.56% 67.09%
Gross Margin Ratio 67.56% 65.09% 2.94%
Net Profit Margin 64.52% 52.18% 32.20%
Receivable Turnover Ratio 19.82 129.98 9,971.37
Return on Assets 5.35 3.54 2.71
Return on Investment 5.54 3.83 0.42
Return on Equity 8.69 8.75 16.41
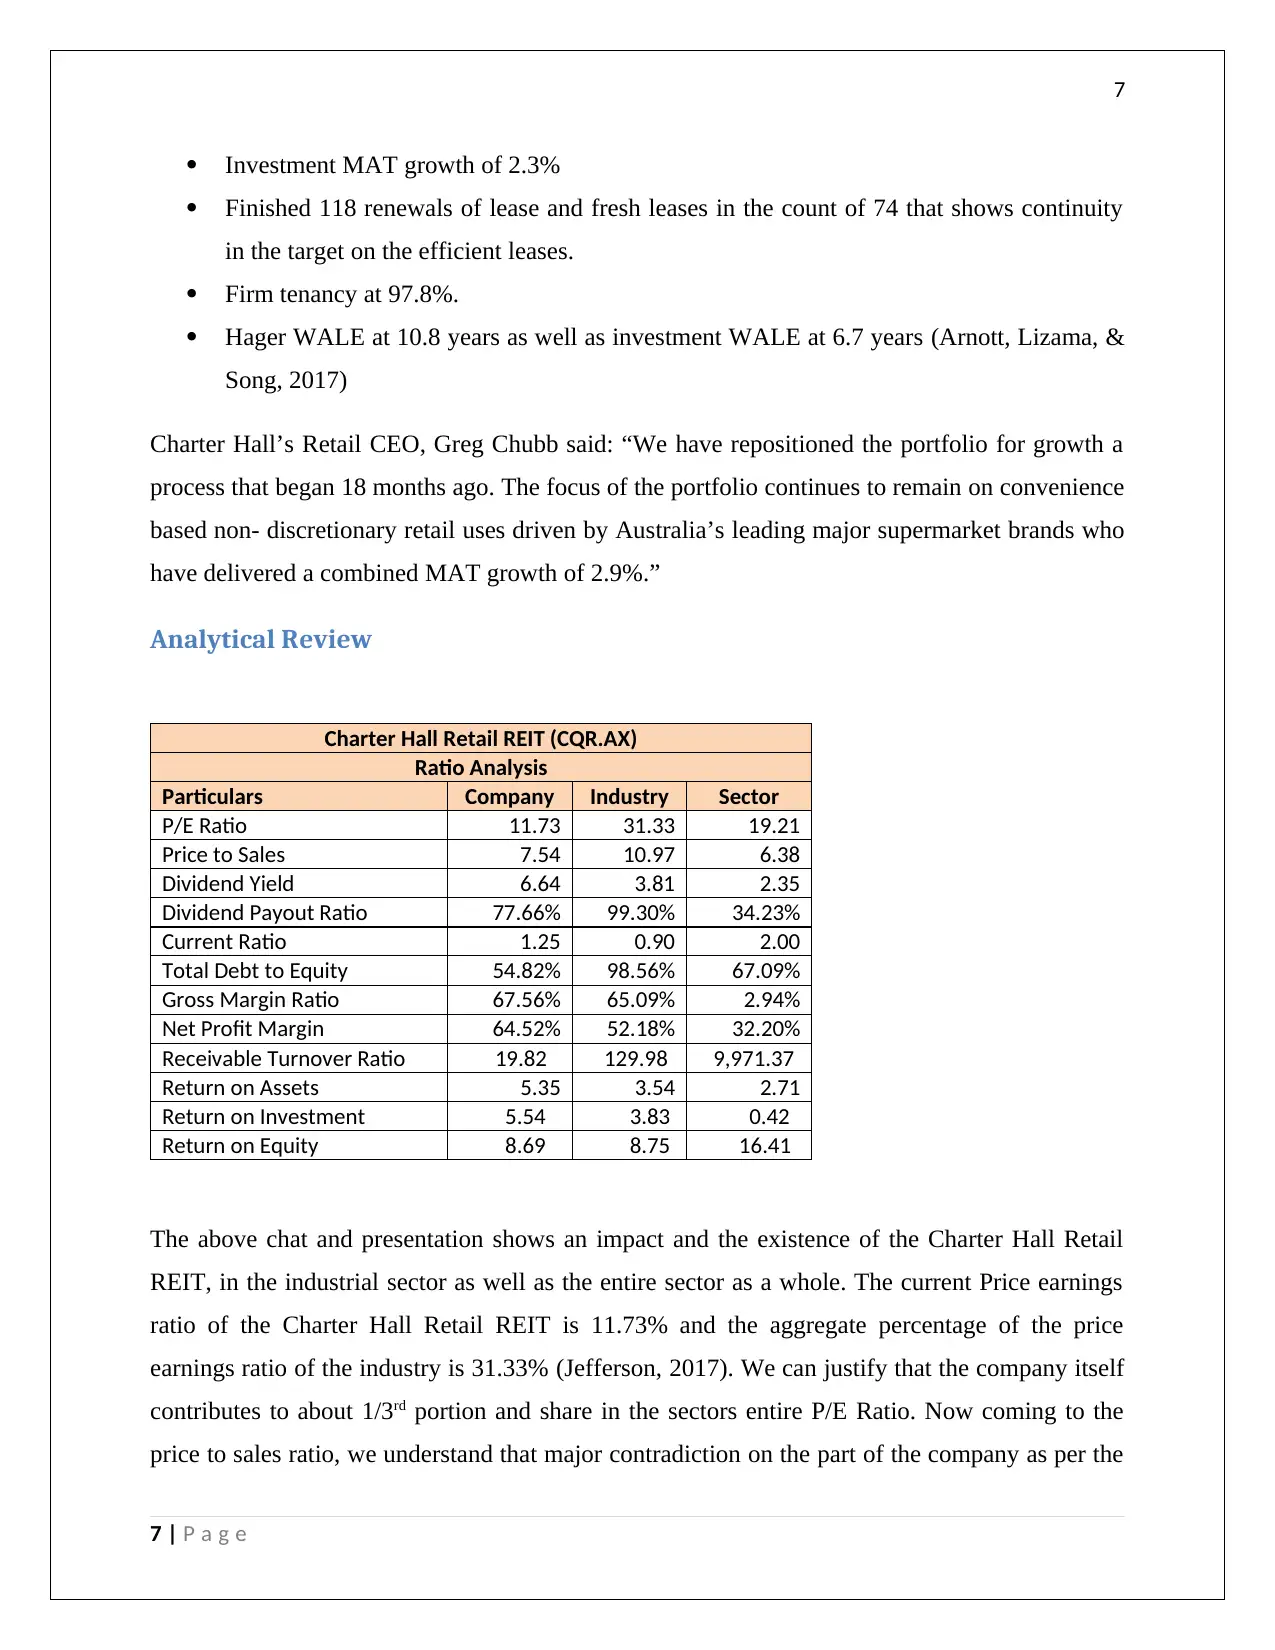
The above chat and presentation shows an impact and the existence of the Charter Hall Retail
REIT, in the industrial sector as well as the entire sector as a whole. The current Price earnings
ratio of the Charter Hall Retail REIT is 11.73% and the aggregate percentage of the price
earnings ratio of the industry is 31.33% (Jefferson, 2017). We can justify that the company itself
contributes to about 1/3rd portion and share in the sectors entire P/E Ratio. Now coming to the
price to sales ratio, we understand that major contradiction on the part of the company as per the
7 | P a g e
Investment MAT growth of 2.3%
Finished 118 renewals of lease and fresh leases in the count of 74 that shows continuity
in the target on the efficient leases.
Firm tenancy at 97.8%.
Hager WALE at 10.8 years as well as investment WALE at 6.7 years (Arnott, Lizama, &
Song, 2017)
Charter Hall’s Retail CEO, Greg Chubb said: “We have repositioned the portfolio for growth a
process that began 18 months ago. The focus of the portfolio continues to remain on convenience
based non- discretionary retail uses driven by Australia’s leading major supermarket brands who
have delivered a combined MAT growth of 2.9%.”
Analytical Review
Charter Hall Retail REIT (CQR.AX)
Ratio Analysis
Particulars Company Industry Sector
P/E Ratio 11.73 31.33 19.21
Price to Sales 7.54 10.97 6.38
Dividend Yield 6.64 3.81 2.35
Dividend Payout Ratio 77.66% 99.30% 34.23%
Current Ratio 1.25 0.90 2.00
Total Debt to Equity 54.82% 98.56% 67.09%
Gross Margin Ratio 67.56% 65.09% 2.94%
Net Profit Margin 64.52% 52.18% 32.20%
Receivable Turnover Ratio 19.82 129.98 9,971.37
Return on Assets 5.35 3.54 2.71
Return on Investment 5.54 3.83 0.42
Return on Equity 8.69 8.75 16.41
The above chat and presentation shows an impact and the existence of the Charter Hall Retail
REIT, in the industrial sector as well as the entire sector as a whole. The current Price earnings
ratio of the Charter Hall Retail REIT is 11.73% and the aggregate percentage of the price
earnings ratio of the industry is 31.33% (Jefferson, 2017). We can justify that the company itself
contributes to about 1/3rd portion and share in the sectors entire P/E Ratio. Now coming to the
price to sales ratio, we understand that major contradiction on the part of the company as per the
7 | P a g e
8
turnover. Higher the contribution, higher the gross profits and thereby higher the returns. This
has an impactful element in the turnover of sector when taken as a whole.
The dividend yield is the ratio taken based on capital. It is that share of profit that is given away
on the form of dividends to the shareholder or the stakeholder, so that they are rest assured that
their investment earns a good return. If we assume the 100%, EPS i.e. earnings per share, then
some part of the EPS is distributed as dividends and the rest becomes the retention ratio. That is
retained in the company as a reserve or for re-investment purposes. We can study from the above
table that this company gives away a share of 77.66% of the EPS to its stakeholders. The current
ratio refers to the ratio between the current assets and the current liabilities, the difference which
shows the working capital requirement as well as available within any company. The company
carries a current ratio of 1.25, which means that the current assets are 1.25 times bigger than the
current liabilities. It is a good sign, which shows that there are sufficient funds and assets to pay
off the existing liabilities within any organisation. The gross profit ratio as well as the net profit
ratios are more than 50% of the turnover; it reflects a higher profitability of the company in the
entire sector (Kim, Schmidgall, & Damitio, 2017). The remaining ratios like receivables to
turnover ratio return on Assets ratio, and return on Investment ratio as well as return on equities
are moderately high. Since we can analyse the fact based because the company is doing pretty
well in the current margins and reserves of its own. The ratios are moderately classified and
resulted in a manner that reflects that the company has enough funds to pay off its liabilities. It
shows the credibility, growth, market status and the development on the part of the company that
it operates in any environment. It gives away more returns to its investors, thereby enacting their
trust and confidence to invest more in the company.
The REIT shall carry on its groomed and well implemented investment plan to increase portfolio
incomes via worth that increases the overhauling methods, initiatives , and the selection of
acquiring of the properties possessing the capability of higher growth, buyback of share as well
as the resale of less growth assets (Sithole, Chandler, Abeysekera, & Paas, 2017).
8 | P a g e
⊘ This is a preview!⊘
Do you want full access?
Subscribe today to unlock all pages.
Trusted by 1+ million students worldwide
9
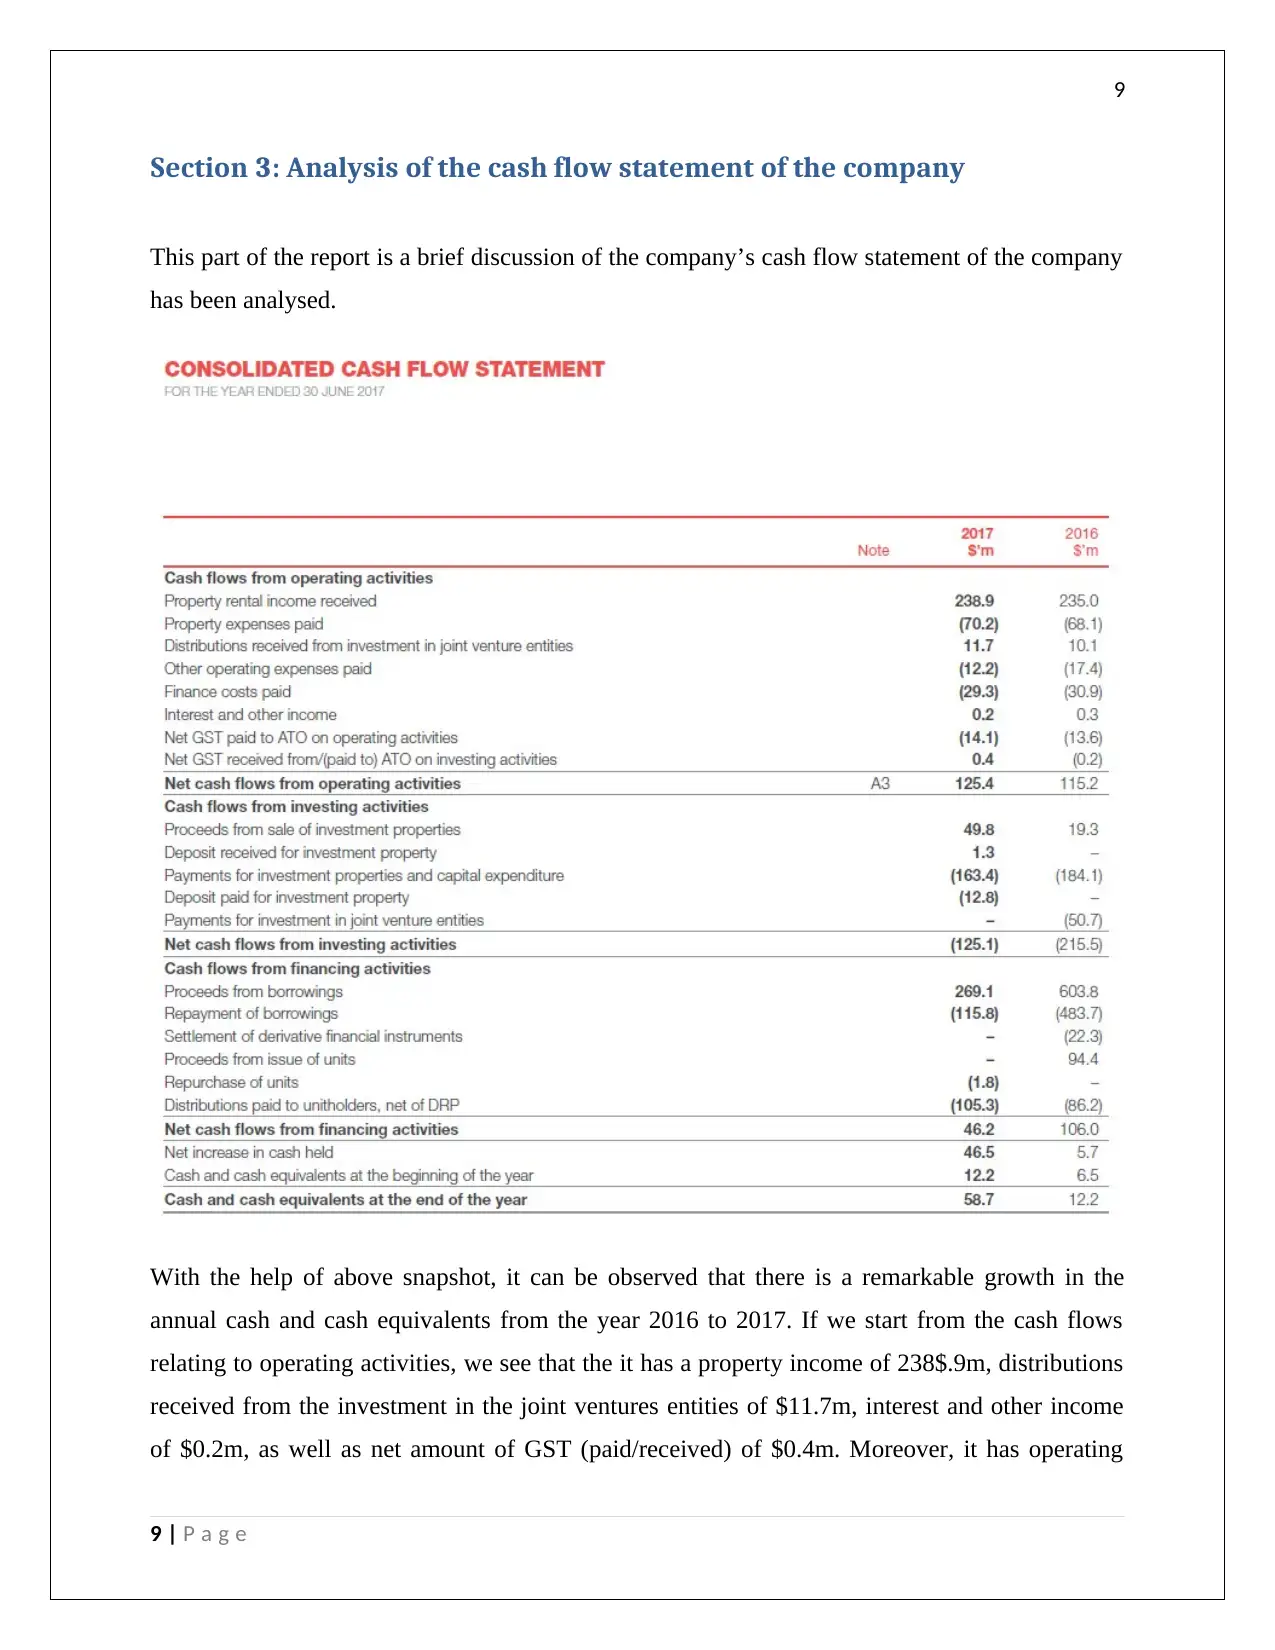
Section 3: Analysis of the cash flow statement of the company
This part of the report is a brief discussion of the company’s cash flow statement of the company
has been analysed.
With the help of above snapshot, it can be observed that there is a remarkable growth in the
annual cash and cash equivalents from the year 2016 to 2017. If we start from the cash flows
relating to operating activities, we see that the it has a property income of 238$.9m, distributions
received from the investment in the joint ventures entities of $11.7m, interest and other income
of $0.2m, as well as net amount of GST (paid/received) of $0.4m. Moreover, it has operating
9 | P a g e
Paraphrase This Document
Need a fresh take? Get an instant paraphrase of this document with our AI Paraphraser
10
expenses as well. These are the expenses of $70.2m paid on properties, the operating expenses of
$12.2m, finance cost of $29.3m, and net GST payment of $14.1m. If we compare the same with
that of 2016 year, we can see that the cash flows from operating activities have increased from
$115.2m to $125.4m (Werner, 2017).
Secondly, we shall discuss about the investing activities. The major proceeds from the investing
activities are from the sale of investment properties of $49.8m, which was $19.3m in 2016. We
can actually analyse the growth here itself (Kuhn & Morris, 2016). Other positive cash flows are
deposit receipt of investment property of $1.3m. However, in 2016 there was not any deposit
receipt. It is a good practice introduced in the 2017 year that decreases the probabilities of loss of
property sale and binds the customers to purchase the property. The major outflows in this
investment activity are the payments upon investing property and the major capital expenditures.
We can see this in the cash flow statement itself that this expenditure has reduced a lot from
$184.1m to $163.4m. The only additional expenses incurred is of $12.8m, which is related to the
deposit paid for the investment done in other joint ventures.
Thirdly, the activities to be discussed herewith is the financing activities. The cash flows from
the finance sector has reduced a lot. i.e. from $106m to $46.2m. Even we can observe that the
financing borrowings and its proceed has declined from the past year. It also has an additional
expenditure of $1.8m, which is related to the repurchase of units.
In all, the cash flow statement reflects the true worth of the company that is related to its
liquidity structure when it comes to operating, investment as well as finance structure. The cash
and cash equivalents from 2016 to 2017 has increased to $46.5m. This is a positive sign as it
results in more liquidity flows in an organisation.
From the above analysis and discussion, it can be said that the entity meets the going concern
assumption. In addition, the auditors of the company PWC have given a clear opinion on the
financial statements as the same has been prepared in compliance with the Australian
Accounting Standards, the Corporation Act, 2001 and that all the relevant aspects have been
covered. The auditors have mentioned few critical or key audit matters for which they had to
take additional steps. Some of these key audit issues include the valuation of the investment
property and the valuation of the derivative financial instrument.
10 | P a g e
11
References
Alexander, F. (2016). The Changing Face of Accountability. The Journal of Higher Education, 71(4), 411-
431.
Arnott, D., Lizama, F., & Song, Y. (2017). Patterns of business intelligence systems use in organizations.
Decision Support Systems, 97, 58-68.
Belton, P. (2017). Competitive Strategy: Creating and Sustaining Superior Performance. London: Macat
International ltd.
Choy, Y. K. (2018). Cost-benefit Analysis, Values, Wellbeing and Ethics: An Indigenous Worldview
Analysis. Ecological Economics, 145. Retrieved from
https://doi.org/10.1016/j.ecolecon.2017.08.005
Das, P. (2017). Financing Pattern and Utilization of Fixed Assets - A Study. Asian Journal of Social Science
Studies, 2(2), 10-17.
Erik, H., & Jan, B. (2017). Supply chain management and activity-based costing: Current status and
directions for the future. International Journal of Physical Distribution & Logistics Management,
47(8), 712-735.
Farmer, Y. (2018). Ethical Decision Making and Reputation Management in Public Relations. Journal of
Media Ethics, 1-12.
Goldmann, K. (2016). Financial Liquidity and Profitability Management in Practice of Polish Business.
Financial Environment and Business Development, 4, 103-112.
Grenier, J. (2017). Encouraging Professional Skepticism in the Industry Specialization Era. Journal of
Business Ethics, 142(2), 241-256.
Jefferson, M. (2017). Energy, Complexity and Wealth Maximization, R. Ayres. Springer, Switzerland .
Technological Forecasting and Social Change, 353-354.
Kim, M., Schmidgall, R., & Damitio, J. (2017). Key Managerial Accounting Skills for Lodging Industry
Managers: The Third Phase of a Repeated Cross-Sectional Study. International Journal of
Hospitality & Tourism Administration, , 18(1), 23-40.
Kuhn, J., & Morris, B. (2016). IT internal control weaknesses and the market value of firms. Journal of
Enterprise Information Management, 30(6).
Sithole, S., Chandler, P., Abeysekera, I., & Paas, F. (2017). Benefits of guided self-management of
attention on learning accounting. Journal of Educational Psychology, 109(2), 220. Retrieved from
http://psycnet.apa.org/buy/2016-21263-001
11 | P a g e
⊘ This is a preview!⊘
Do you want full access?
Subscribe today to unlock all pages.
Trusted by 1+ million students worldwide
1 out of 13
Related Documents


Your All-in-One AI-Powered Toolkit for Academic Success.
+13062052269
info@desklib.com
Available 24*7 on WhatsApp / Email
![[object Object]](/_next/static/media/star-bottom.7253800d.svg)
Unlock your academic potential
Copyright © 2020–2026 A2Z Services. All Rights Reserved. Developed and managed by ZUCOL.