ACCT20077: Cash Flow Analysis of Harvey Norman and JB HiFi
VerifiedAdded on 2020/02/18
|11
|2834
|48
Report
AI Summary
This report provides a comprehensive analysis of the cash flow statements of Harvey Norman Holdings and JB HiFi for the year 2016. The analysis includes an examination of the methods used by each company to prepare their cash flow statements, specifically focusing on the direct method employed by both. The report delves into the operating, investing, and financing activities of each company, highlighting key cash flows and trends. Furthermore, it calculates and interprets several financial ratios, including working capital ratio, cash flow adequacy ratio, debt to total asset ratio, debt coverage ratio, and cash flow to sales ratio, to assess the financial health and performance of both companies. The findings are supported by data extracted from the annual reports of the respective companies. The report concludes with recommendations based on the financial analysis, offering insights into the companies' cash management and overall financial positions.
ACCT20077: Practical and written assessment
Page 1 of 12
Page 1 of 12
Paraphrase This Document
Need a fresh take? Get an instant paraphrase of this document with our AI Paraphraser
Contents
Introduction................................................................................................................................3
Part 1: Method used by each company for preparing the cash flow statements........................3
Part 2: Analysis of the cash flow statements of both the companies.........................................4
Comment on the cash flow statement of the Harvey Norman Holding Limited....................4
Working Capital Ratio............................................................................................................5
Cash Flow Adequacy Ratio....................................................................................................5
Debt to Total Asset Ratio.......................................................................................................6
Debt Coverage Ratio..............................................................................................................6
Cash Flow to Sales Ratio........................................................................................................7
Comment on the cash flow statement of the JB HiFi.............................................................7
Cash Flow Adequacy Ratio....................................................................................................8
Debt to Total Asset Ratio.......................................................................................................9
Debt Coverage Ratio..............................................................................................................9
Cash Flow to Sales Ratio......................................................................................................10
Part 3: Conclusion and recommendations................................................................................10
References................................................................................................................................12
Page 2 of 12
Introduction
Financial statements are the most important of the annual report and users of the
annual report uses financial statements to predict the financial performance of the company.
The financial statements are mainly divided into four main parts namely, statement of
comprehensive income, statement of financial position, statement of change in equity and
statement of cash flows. Among them statement of cash flow the most important as it helps
in providing the actual cash flows take place in the company through the operating activity,
investing activity and financing activity.
In this report, cash flow statements of Harvey Norman Holdings and JB Hi Fi for year
2016 are analyzed to report on the cash position of the company. Financial ratios are also
calculated to support the findings.
Part 1: Method used by each company for preparing the cash flow statements
There are two methods to prepare the statement of cash flows, namely direct method
and indirect method. Mainly there is difference for preparing the cash flow from operating
activity. Cash flow from investing activity and financing are calculated in the similar manner
under both the options.
It has been analyzed from the annual report of the Harvey Norman Holdings that
company has implied direct method to prepare the statement of cash flows. The statement of
cash flows in annual report of Harvey Norman Holding Limited is presented on the page 65
and reconciliation of profit after income tax to net operating cash flows has been incorporated
in the notes to account in section 28 (b) on page 112 (Annual report 2016: Harvey Norman
Holding Limited). Under direct method for preparing the cash flow statement, it is important
to disclose the reconciliation statement under notes to accounts in order to facilitate the better
understanding of cash flows under the operating activity. On looking at the annual report of
the JB HiFi for the year 2016 it has been noted that this has also used direct method to
prepare the cash flow statement. The reconciliation of profit after income tax to net operating
cash flows has been incorporated in notes to accounts at note number 14 (Annual report
2016: JB HiFi).
Page 3 of 12
⊘ This is a preview!⊘
Do you want full access?
Subscribe today to unlock all pages.
Trusted by 1+ million students worldwide
Part 2: Analysis of the cash flow statements of both the companies
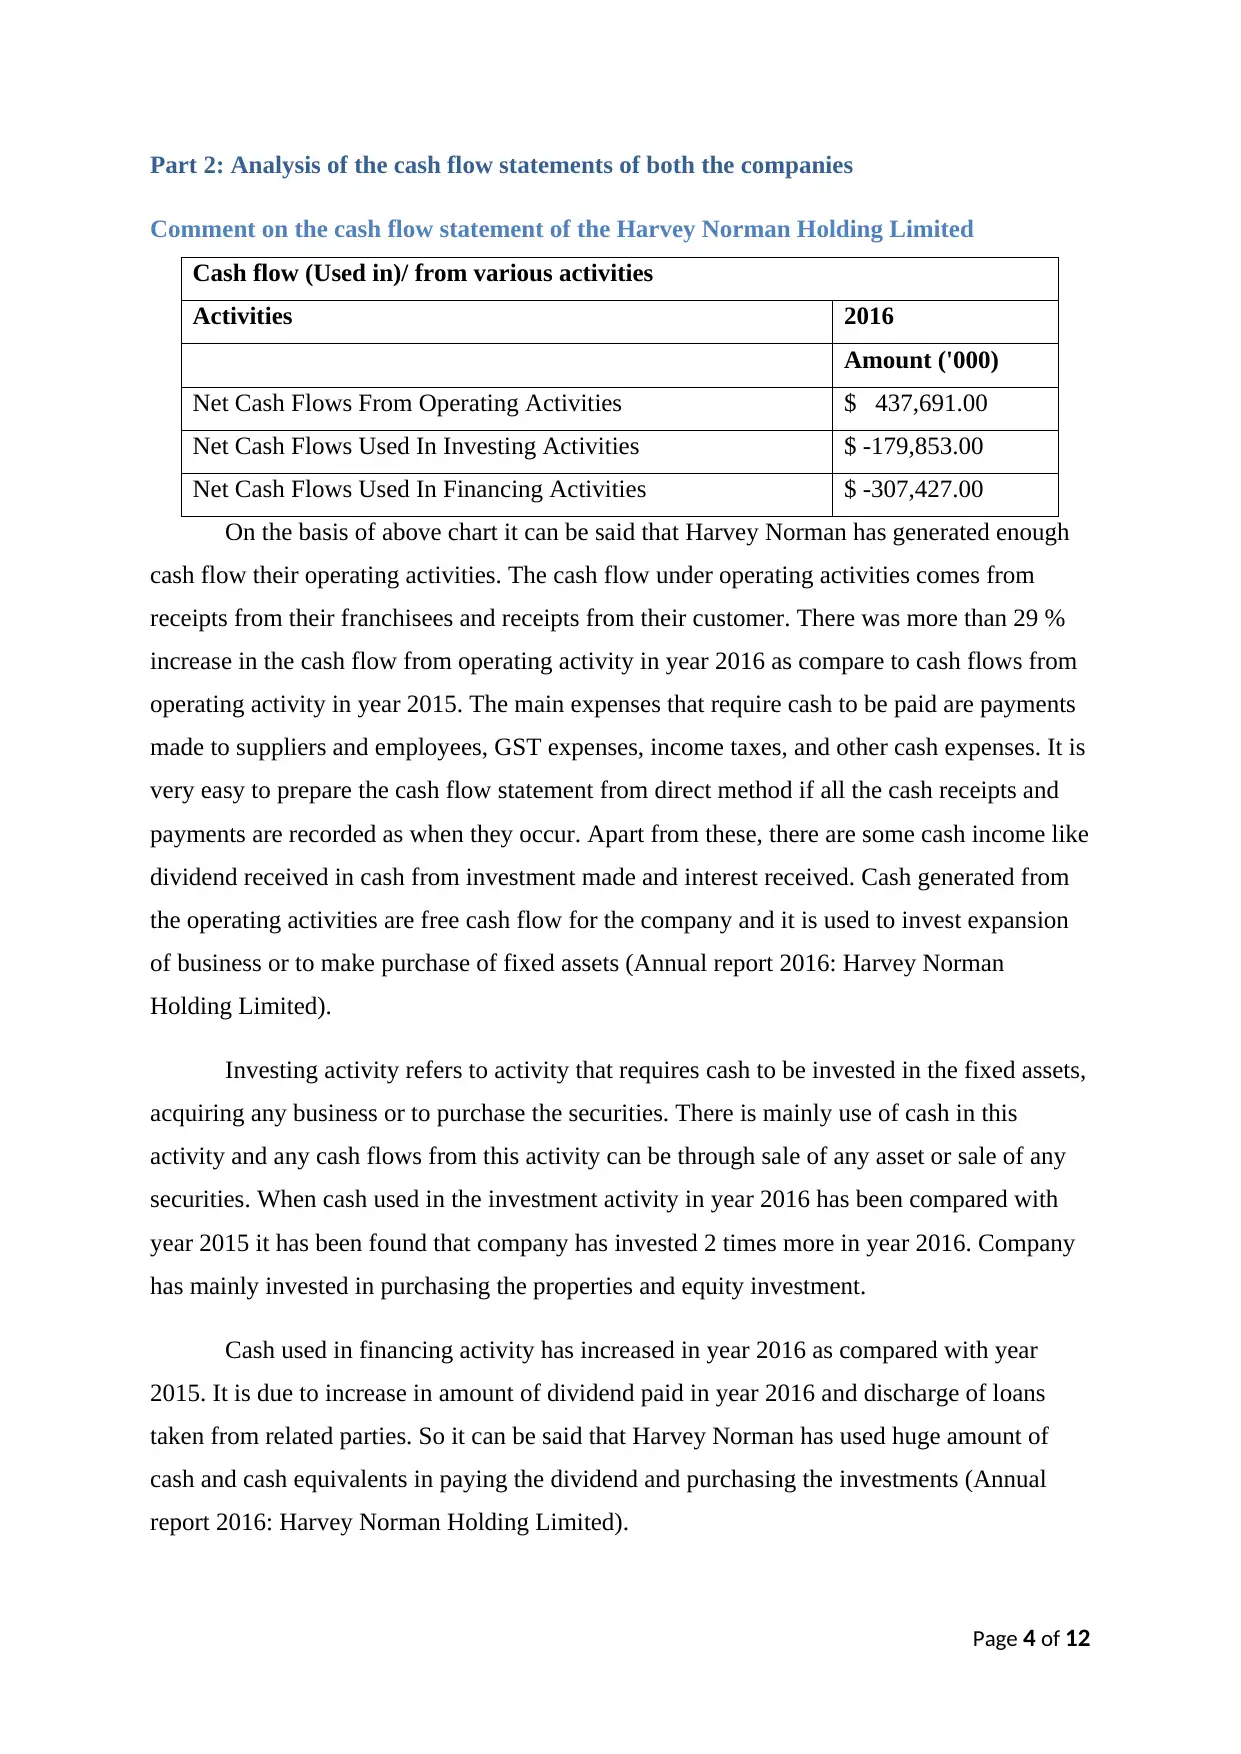
Comment on the cash flow statement of the Harvey Norman Holding Limited
Cash flow (Used in)/ from various activities
Activities 2016
Amount ('000)
Net Cash Flows From Operating Activities $ 437,691.00
Net Cash Flows Used In Investing Activities $ -179,853.00
Net Cash Flows Used In Financing Activities $ -307,427.00
On the basis of above chart it can be said that Harvey Norman has generated enough
cash flow their operating activities. The cash flow under operating activities comes from
receipts from their franchisees and receipts from their customer. There was more than 29 %
increase in the cash flow from operating activity in year 2016 as compare to cash flows from
operating activity in year 2015. The main expenses that require cash to be paid are payments
made to suppliers and employees, GST expenses, income taxes, and other cash expenses. It is
very easy to prepare the cash flow statement from direct method if all the cash receipts and
payments are recorded as when they occur. Apart from these, there are some cash income like
dividend received in cash from investment made and interest received. Cash generated from
the operating activities are free cash flow for the company and it is used to invest expansion
of business or to make purchase of fixed assets (Annual report 2016: Harvey Norman
Holding Limited).
Investing activity refers to activity that requires cash to be invested in the fixed assets,
acquiring any business or to purchase the securities. There is mainly use of cash in this
activity and any cash flows from this activity can be through sale of any asset or sale of any
securities. When cash used in the investment activity in year 2016 has been compared with
year 2015 it has been found that company has invested 2 times more in year 2016. Company
has mainly invested in purchasing the properties and equity investment.
Cash used in financing activity has increased in year 2016 as compared with year
2015. It is due to increase in amount of dividend paid in year 2016 and discharge of loans
taken from related parties. So it can be said that Harvey Norman has used huge amount of
cash and cash equivalents in paying the dividend and purchasing the investments (Annual
report 2016: Harvey Norman Holding Limited).
Page 4 of 12
Paraphrase This Document
Need a fresh take? Get an instant paraphrase of this document with our AI Paraphraser
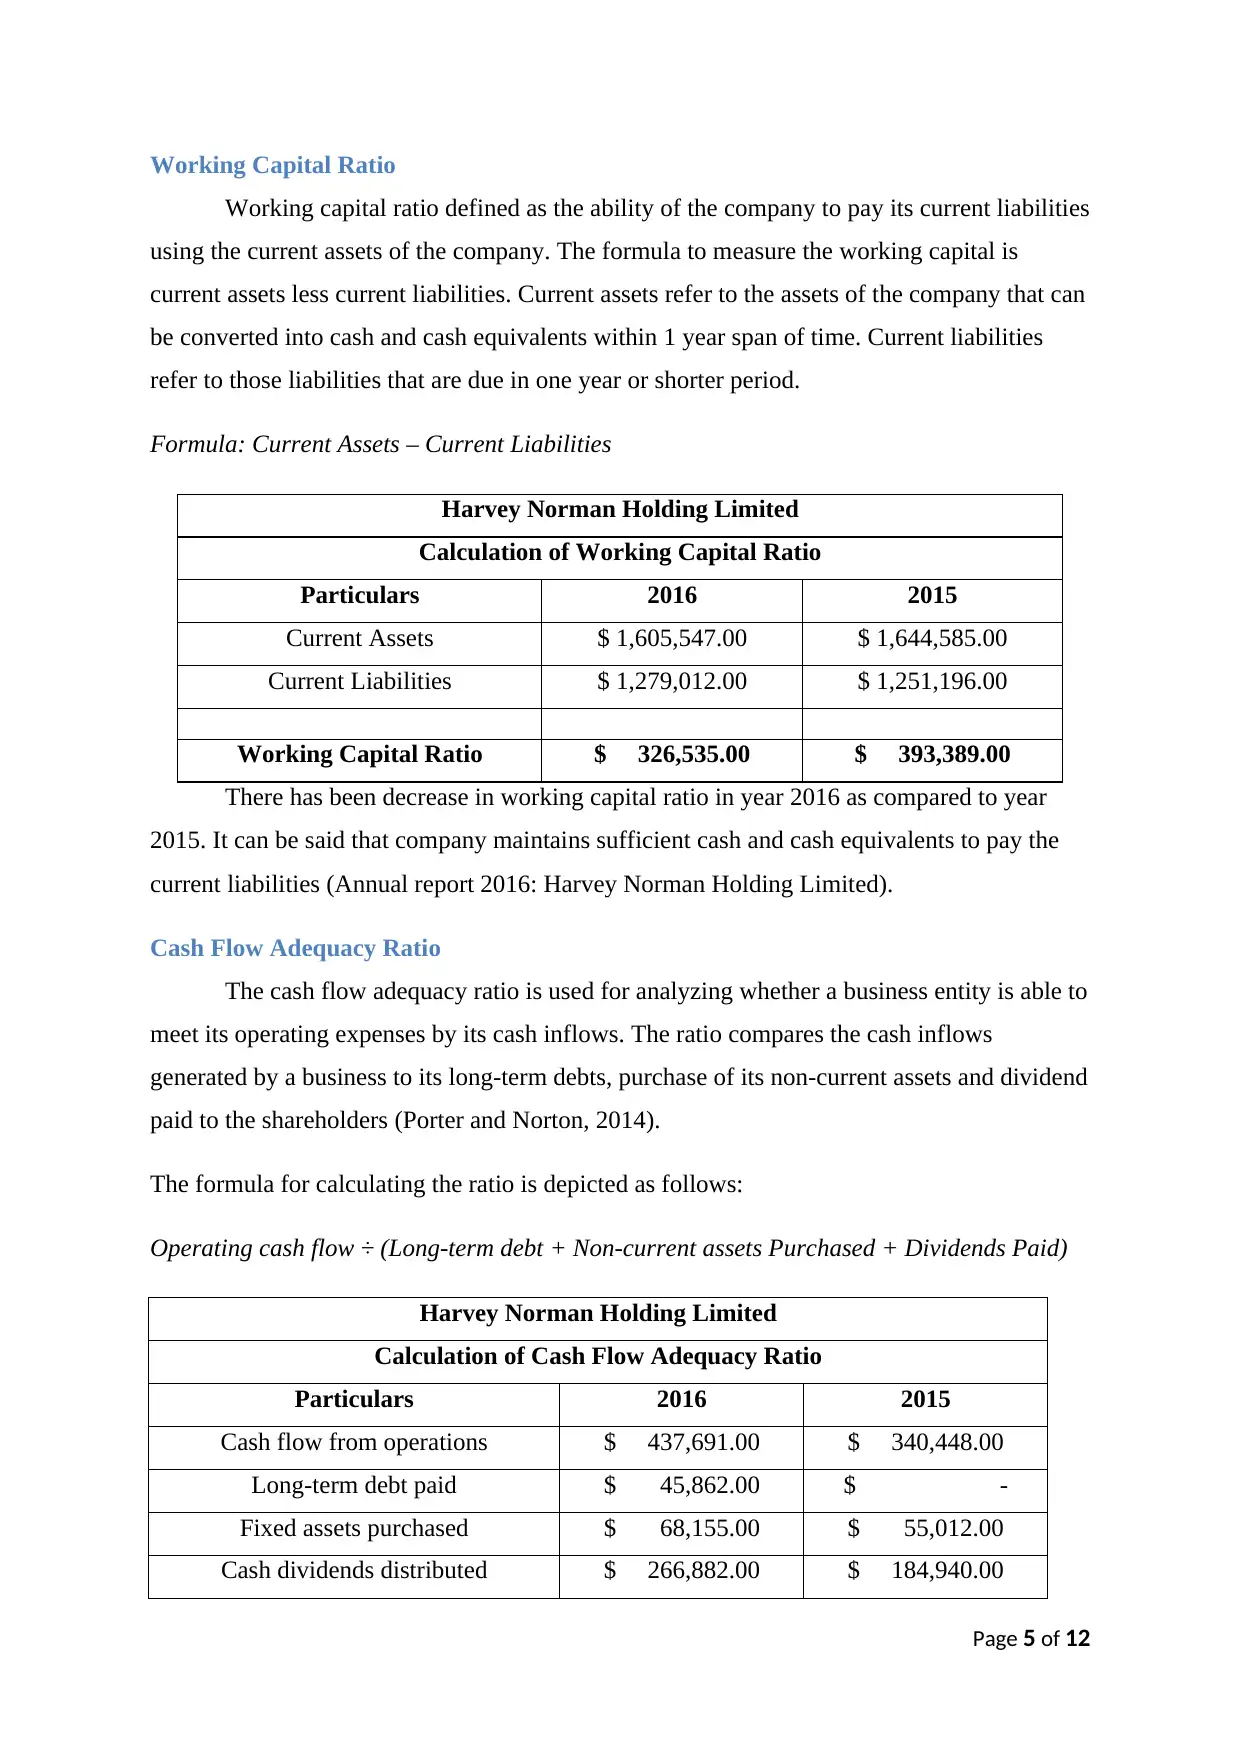
Working Capital Ratio
Working capital ratio defined as the ability of the company to pay its current liabilities
using the current assets of the company. The formula to measure the working capital is
current assets less current liabilities. Current assets refer to the assets of the company that can
be converted into cash and cash equivalents within 1 year span of time. Current liabilities
refer to those liabilities that are due in one year or shorter period.
Formula: Current Assets – Current Liabilities
Harvey Norman Holding Limited
Calculation of Working Capital Ratio
Particulars 2016 2015
Current Assets $ 1,605,547.00 $ 1,644,585.00
Current Liabilities $ 1,279,012.00 $ 1,251,196.00
Working Capital Ratio $ 326,535.00 $ 393,389.00
There has been decrease in working capital ratio in year 2016 as compared to year
2015. It can be said that company maintains sufficient cash and cash equivalents to pay the
current liabilities (Annual report 2016: Harvey Norman Holding Limited).
Cash Flow Adequacy Ratio
The cash flow adequacy ratio is used for analyzing whether a business entity is able to
meet its operating expenses by its cash inflows. The ratio compares the cash inflows
generated by a business to its long-term debts, purchase of its non-current assets and dividend
paid to the shareholders (Porter and Norton, 2014).
The formula for calculating the ratio is depicted as follows:
Operating cash flow ÷ (Long-term debt + Non-current assets Purchased + Dividends Paid)
Harvey Norman Holding Limited
Calculation of Cash Flow Adequacy Ratio
Particulars 2016 2015
Cash flow from operations $ 437,691.00 $ 340,448.00
Long-term debt paid $ 45,862.00 $ -
Fixed assets purchased $ 68,155.00 $ 55,012.00
Cash dividends distributed $ 266,882.00 $ 184,940.00
Page 5 of 12
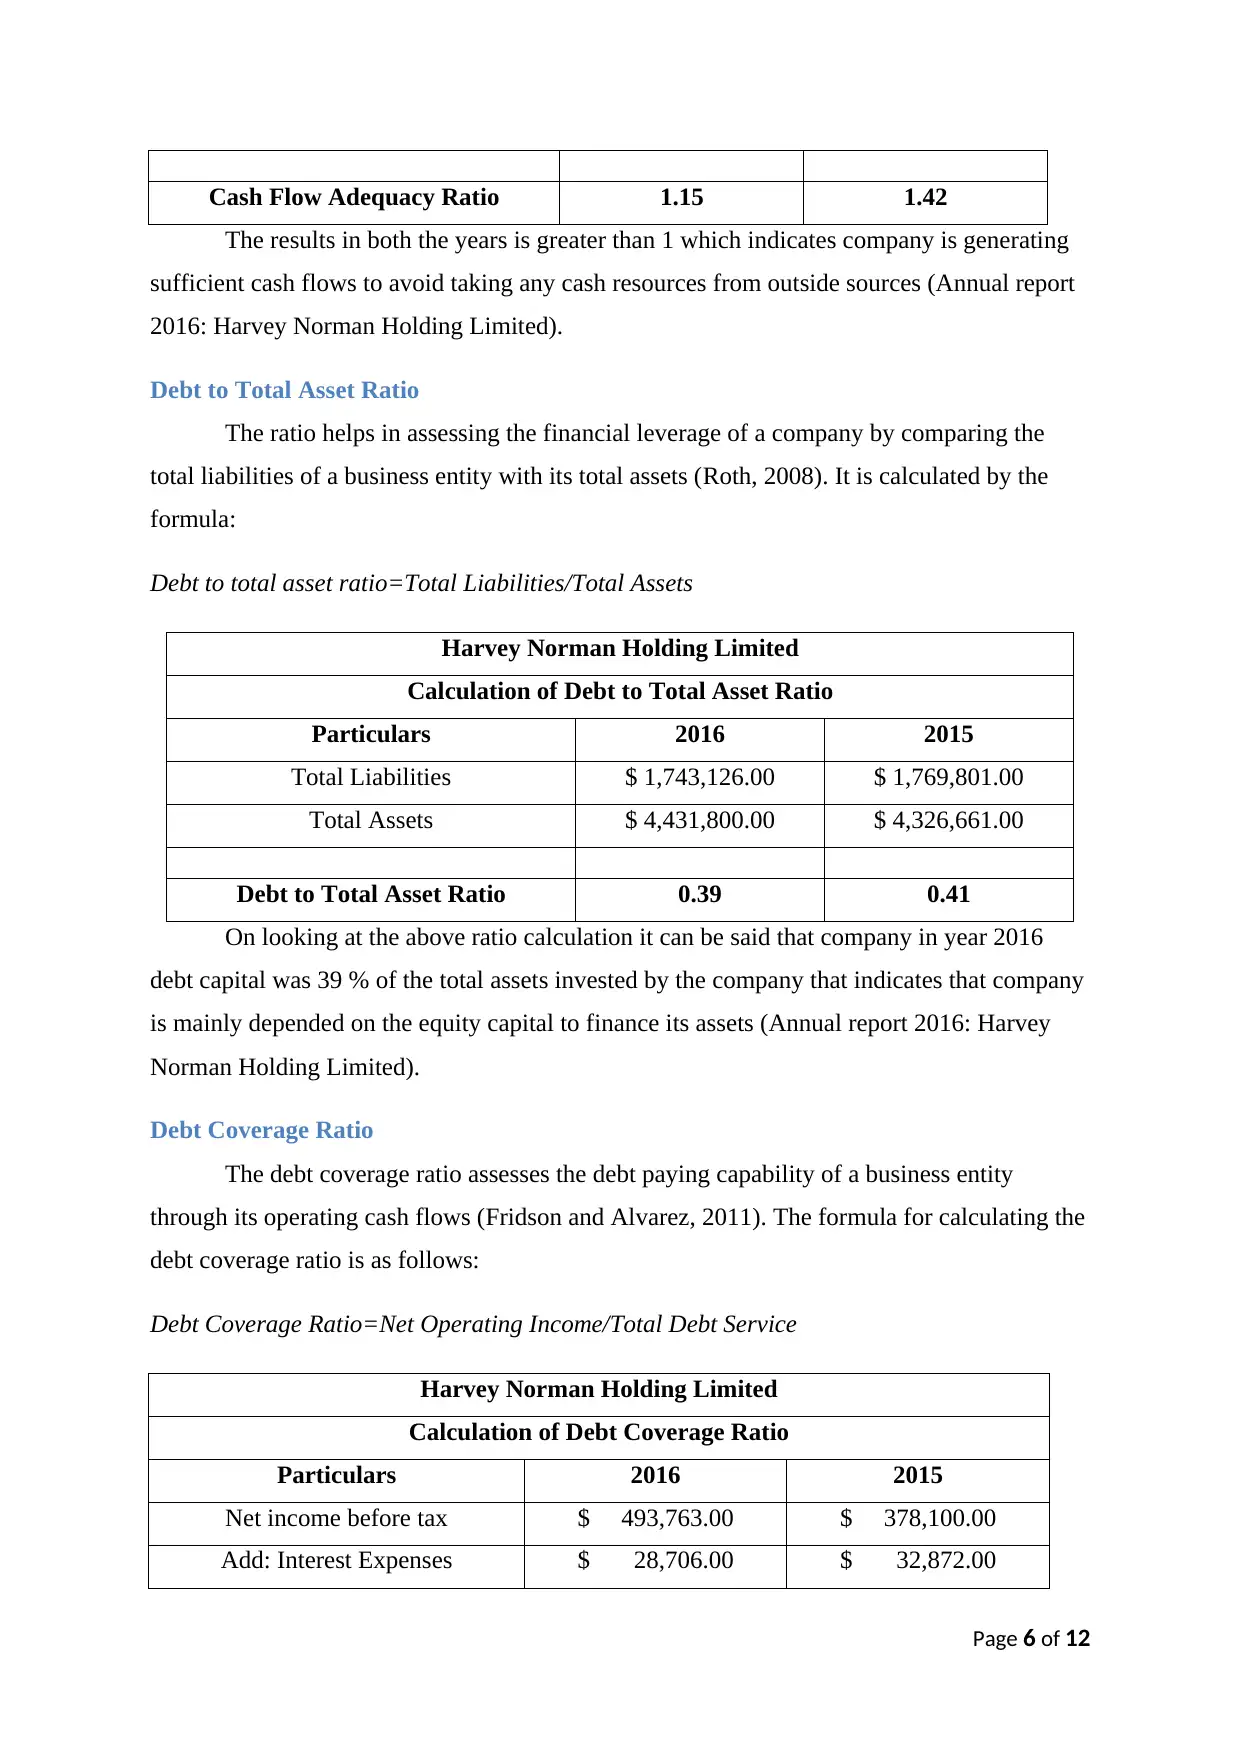
Cash Flow Adequacy Ratio 1.15 1.42
The results in both the years is greater than 1 which indicates company is generating
sufficient cash flows to avoid taking any cash resources from outside sources (Annual report
2016: Harvey Norman Holding Limited).
Debt to Total Asset Ratio
The ratio helps in assessing the financial leverage of a company by comparing the
total liabilities of a business entity with its total assets (Roth, 2008). It is calculated by the
formula:
Debt to total asset ratio=Total Liabilities/Total Assets
Harvey Norman Holding Limited
Calculation of Debt to Total Asset Ratio
Particulars 2016 2015
Total Liabilities $ 1,743,126.00 $ 1,769,801.00
Total Assets $ 4,431,800.00 $ 4,326,661.00
Debt to Total Asset Ratio 0.39 0.41
On looking at the above ratio calculation it can be said that company in year 2016
debt capital was 39 % of the total assets invested by the company that indicates that company
is mainly depended on the equity capital to finance its assets (Annual report 2016: Harvey
Norman Holding Limited).
Debt Coverage Ratio
The debt coverage ratio assesses the debt paying capability of a business entity
through its operating cash flows (Fridson and Alvarez, 2011). The formula for calculating the
debt coverage ratio is as follows:
Debt Coverage Ratio=Net Operating Income/Total Debt Service
Harvey Norman Holding Limited
Calculation of Debt Coverage Ratio
Particulars 2016 2015
Net income before tax $ 493,763.00 $ 378,100.00
Add: Interest Expenses $ 28,706.00 $ 32,872.00
Page 6 of 12
⊘ This is a preview!⊘
Do you want full access?
Subscribe today to unlock all pages.
Trusted by 1+ million students worldwide
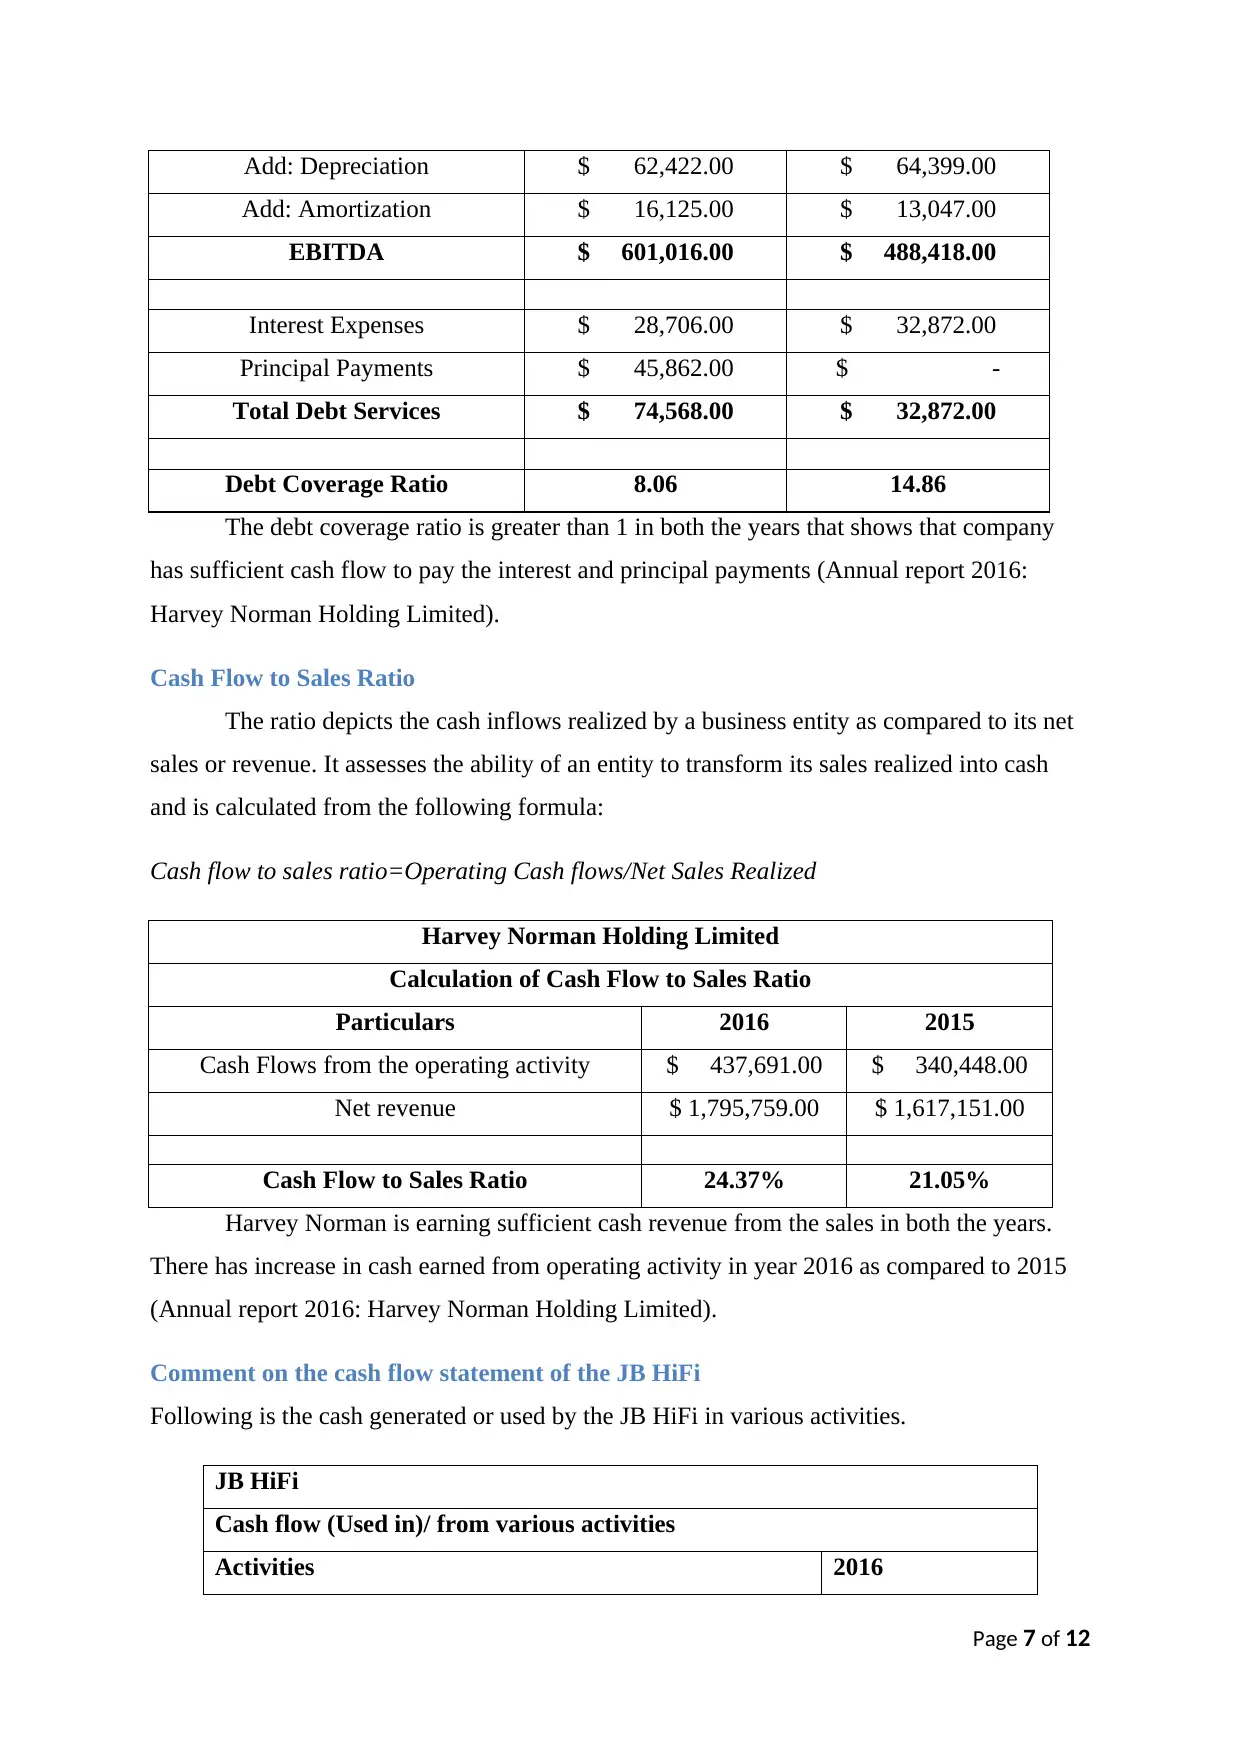
Add: Depreciation $ 62,422.00 $ 64,399.00
Add: Amortization $ 16,125.00 $ 13,047.00
EBITDA $ 601,016.00 $ 488,418.00
Interest Expenses $ 28,706.00 $ 32,872.00
Principal Payments $ 45,862.00 $ -
Total Debt Services $ 74,568.00 $ 32,872.00
Debt Coverage Ratio 8.06 14.86
The debt coverage ratio is greater than 1 in both the years that shows that company
has sufficient cash flow to pay the interest and principal payments (Annual report 2016:
Harvey Norman Holding Limited).
Cash Flow to Sales Ratio
The ratio depicts the cash inflows realized by a business entity as compared to its net
sales or revenue. It assesses the ability of an entity to transform its sales realized into cash
and is calculated from the following formula:
Cash flow to sales ratio=Operating Cash flows/Net Sales Realized
Harvey Norman Holding Limited
Calculation of Cash Flow to Sales Ratio
Particulars 2016 2015
Cash Flows from the operating activity $ 437,691.00 $ 340,448.00
Net revenue $ 1,795,759.00 $ 1,617,151.00
Cash Flow to Sales Ratio 24.37% 21.05%
Harvey Norman is earning sufficient cash revenue from the sales in both the years.
There has increase in cash earned from operating activity in year 2016 as compared to 2015
(Annual report 2016: Harvey Norman Holding Limited).
Comment on the cash flow statement of the JB HiFi
Following is the cash generated or used by the JB HiFi in various activities.
JB HiFi
Cash flow (Used in)/ from various activities
Activities 2016
Page 7 of 12
Paraphrase This Document
Need a fresh take? Get an instant paraphrase of this document with our AI Paraphraser
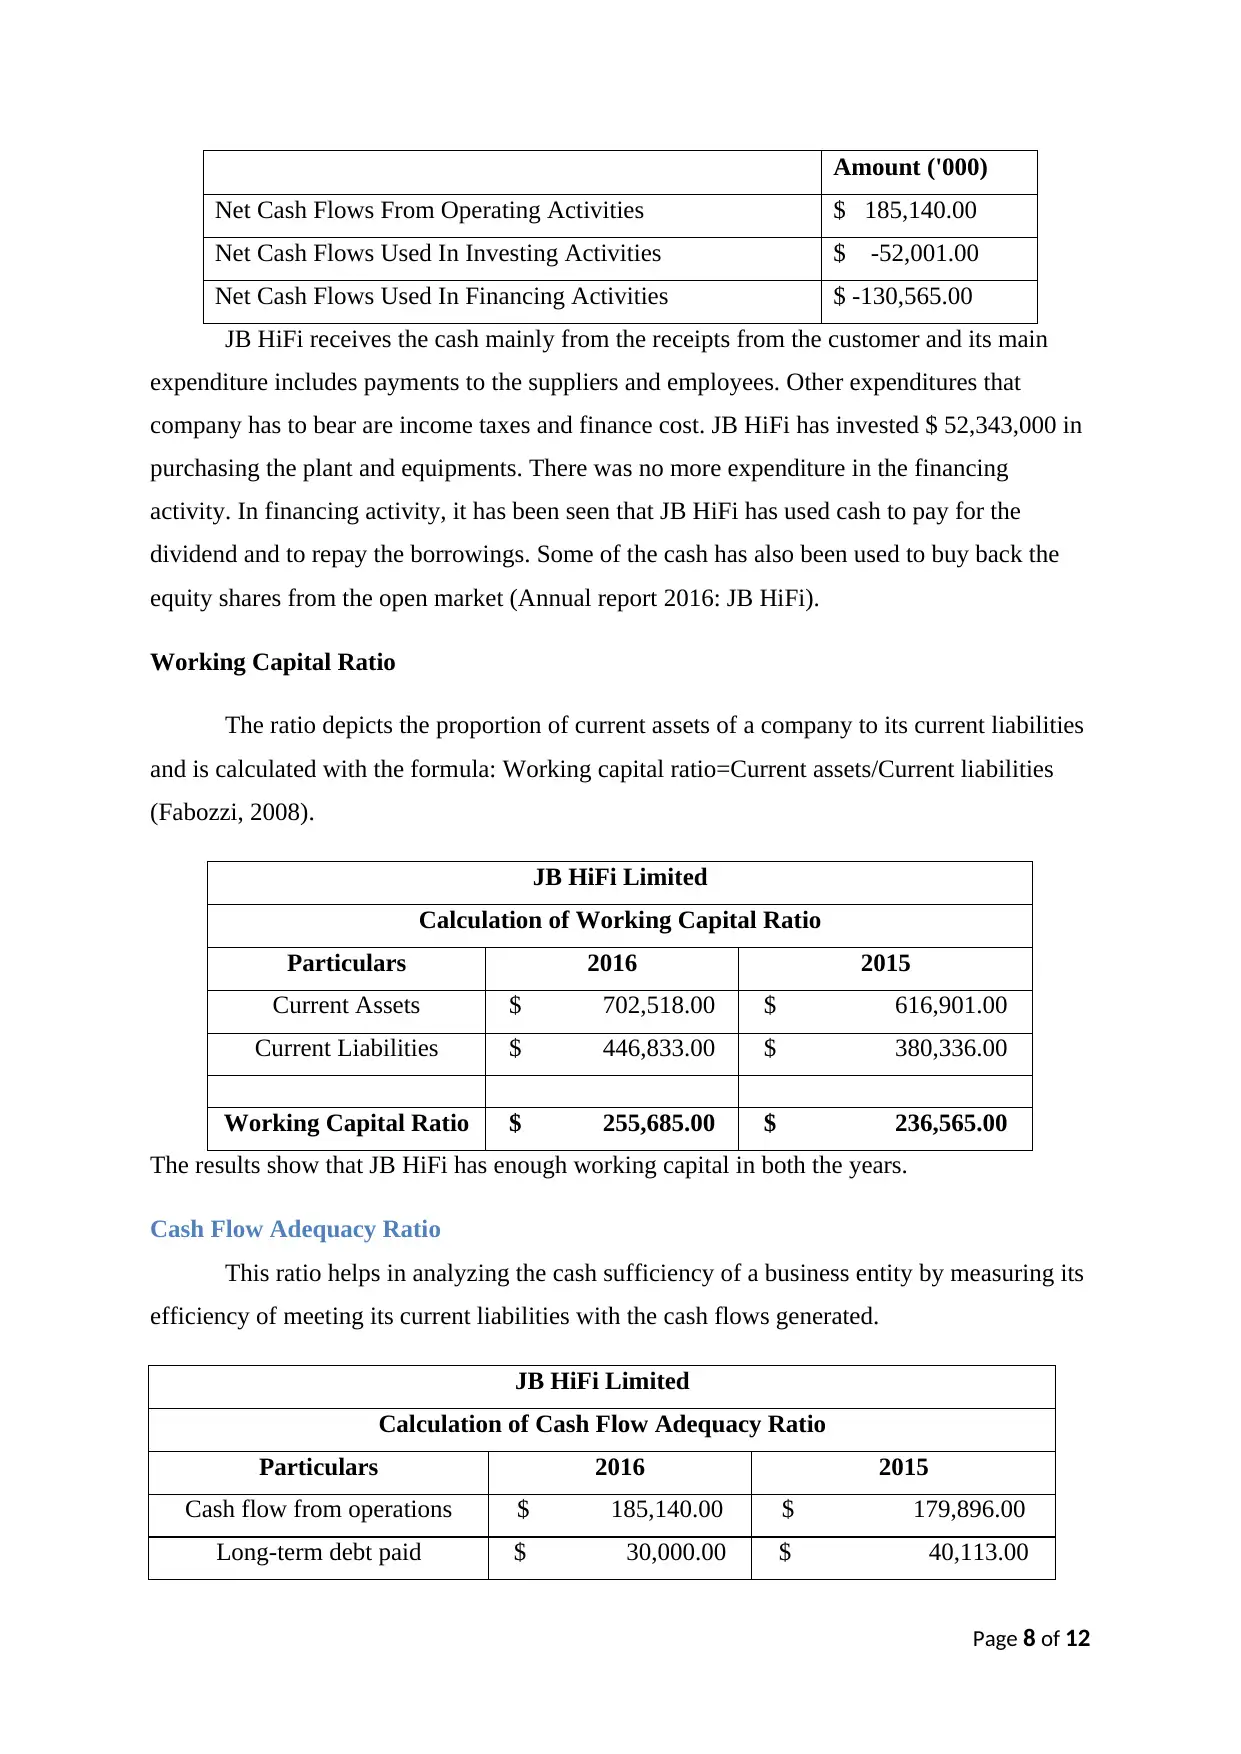
Amount ('000)
Net Cash Flows From Operating Activities $ 185,140.00
Net Cash Flows Used In Investing Activities $ -52,001.00
Net Cash Flows Used In Financing Activities $ -130,565.00
JB HiFi receives the cash mainly from the receipts from the customer and its main
expenditure includes payments to the suppliers and employees. Other expenditures that
company has to bear are income taxes and finance cost. JB HiFi has invested $ 52,343,000 in
purchasing the plant and equipments. There was no more expenditure in the financing
activity. In financing activity, it has been seen that JB HiFi has used cash to pay for the
dividend and to repay the borrowings. Some of the cash has also been used to buy back the
equity shares from the open market (Annual report 2016: JB HiFi).
Working Capital Ratio
The ratio depicts the proportion of current assets of a company to its current liabilities
and is calculated with the formula: Working capital ratio=Current assets/Current liabilities
(Fabozzi, 2008).
JB HiFi Limited
Calculation of Working Capital Ratio
Particulars 2016 2015
Current Assets $ 702,518.00 $ 616,901.00
Current Liabilities $ 446,833.00 $ 380,336.00
Working Capital Ratio $ 255,685.00 $ 236,565.00
The results show that JB HiFi has enough working capital in both the years.
Cash Flow Adequacy Ratio
This ratio helps in analyzing the cash sufficiency of a business entity by measuring its
efficiency of meeting its current liabilities with the cash flows generated.
JB HiFi Limited
Calculation of Cash Flow Adequacy Ratio
Particulars 2016 2015
Cash flow from operations $ 185,140.00 $ 179,896.00
Long-term debt paid $ 30,000.00 $ 40,113.00
Page 8 of 12
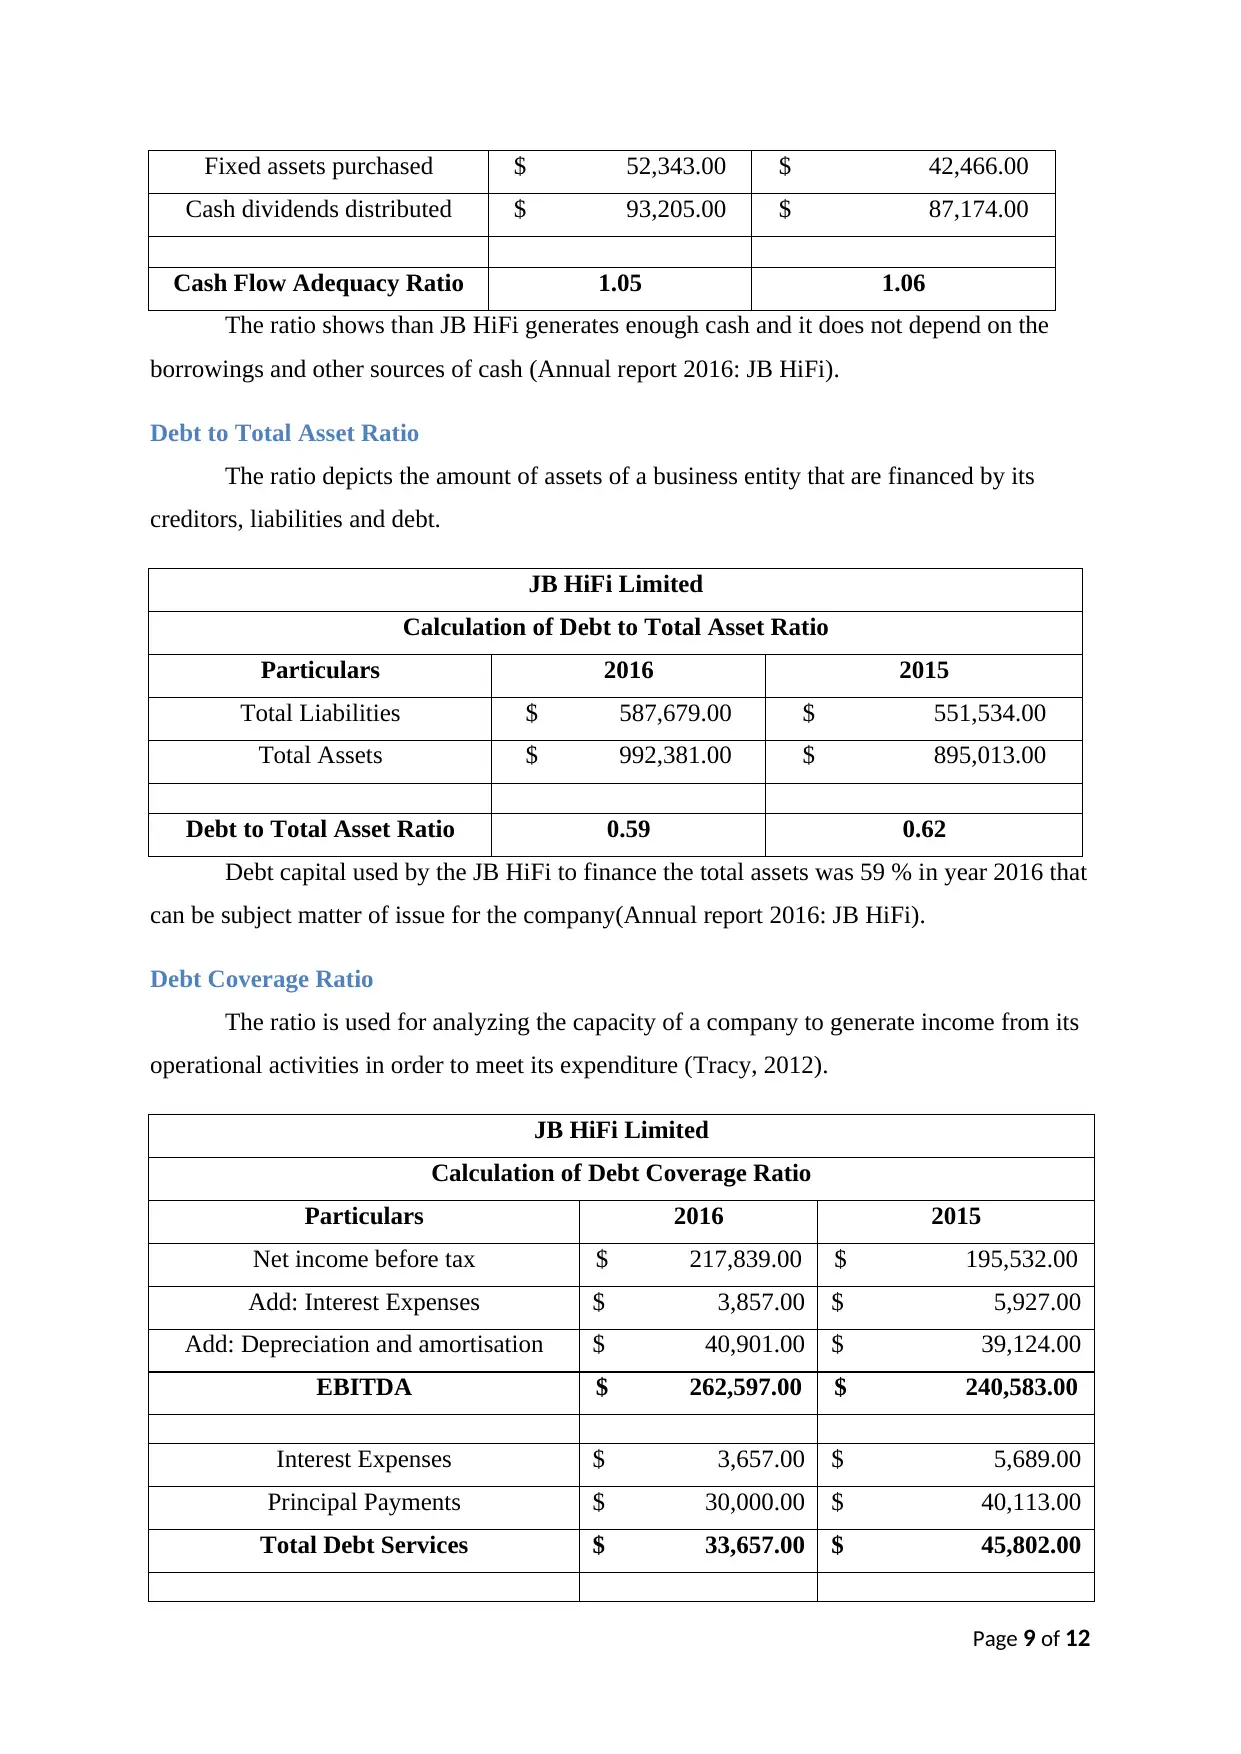
Fixed assets purchased $ 52,343.00 $ 42,466.00
Cash dividends distributed $ 93,205.00 $ 87,174.00
Cash Flow Adequacy Ratio 1.05 1.06
The ratio shows than JB HiFi generates enough cash and it does not depend on the
borrowings and other sources of cash (Annual report 2016: JB HiFi).
Debt to Total Asset Ratio
The ratio depicts the amount of assets of a business entity that are financed by its
creditors, liabilities and debt.
JB HiFi Limited
Calculation of Debt to Total Asset Ratio
Particulars 2016 2015
Total Liabilities $ 587,679.00 $ 551,534.00
Total Assets $ 992,381.00 $ 895,013.00
Debt to Total Asset Ratio 0.59 0.62
Debt capital used by the JB HiFi to finance the total assets was 59 % in year 2016 that
can be subject matter of issue for the company(Annual report 2016: JB HiFi).
Debt Coverage Ratio
The ratio is used for analyzing the capacity of a company to generate income from its
operational activities in order to meet its expenditure (Tracy, 2012).
JB HiFi Limited
Calculation of Debt Coverage Ratio
Particulars 2016 2015
Net income before tax $ 217,839.00 $ 195,532.00
Add: Interest Expenses $ 3,857.00 $ 5,927.00
Add: Depreciation and amortisation $ 40,901.00 $ 39,124.00
EBITDA $ 262,597.00 $ 240,583.00
Interest Expenses $ 3,657.00 $ 5,689.00
Principal Payments $ 30,000.00 $ 40,113.00
Total Debt Services $ 33,657.00 $ 45,802.00
Page 9 of 12
⊘ This is a preview!⊘
Do you want full access?
Subscribe today to unlock all pages.
Trusted by 1+ million students worldwide
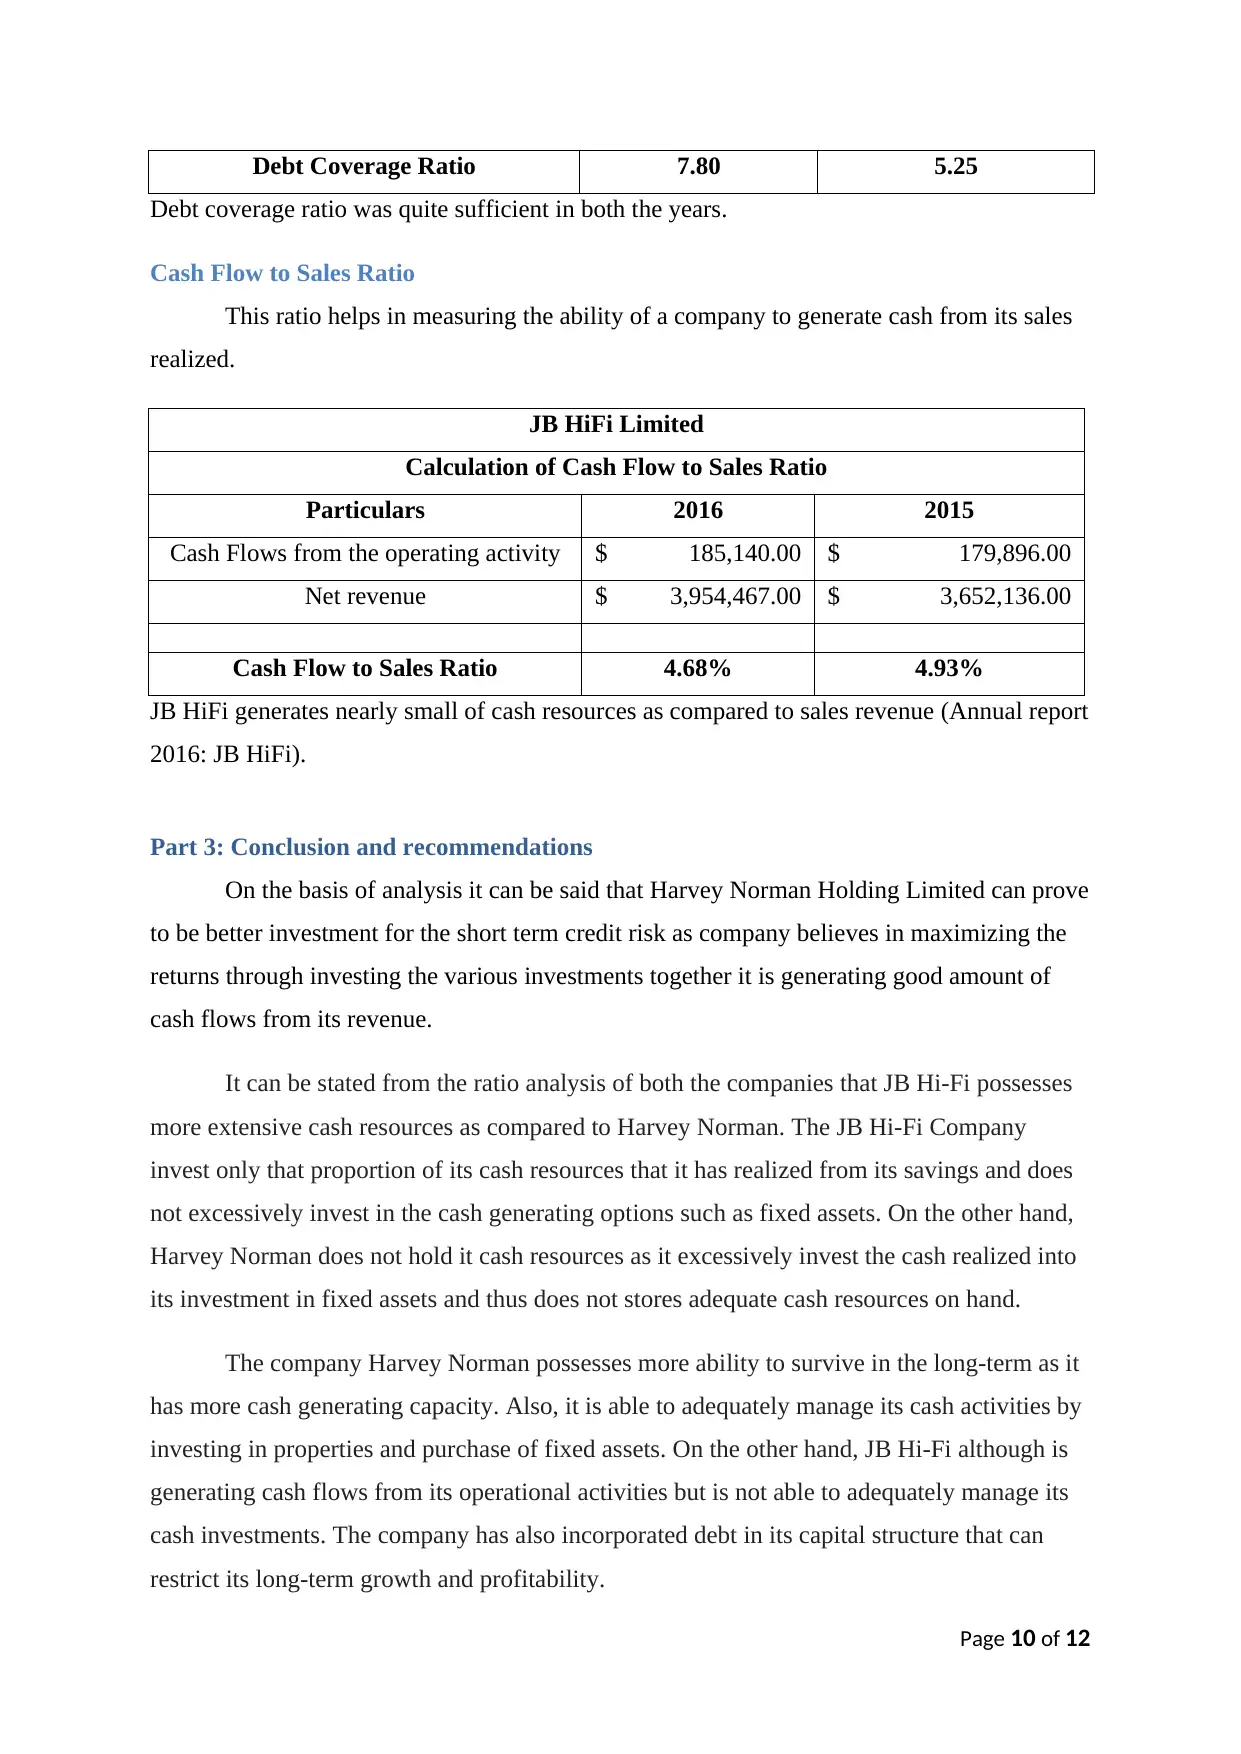
Debt Coverage Ratio 7.80 5.25
Debt coverage ratio was quite sufficient in both the years.
Cash Flow to Sales Ratio
This ratio helps in measuring the ability of a company to generate cash from its sales
realized.
JB HiFi Limited
Calculation of Cash Flow to Sales Ratio
Particulars 2016 2015
Cash Flows from the operating activity $ 185,140.00 $ 179,896.00
Net revenue $ 3,954,467.00 $ 3,652,136.00
Cash Flow to Sales Ratio 4.68% 4.93%
JB HiFi generates nearly small of cash resources as compared to sales revenue (Annual report
2016: JB HiFi).
Part 3: Conclusion and recommendations
On the basis of analysis it can be said that Harvey Norman Holding Limited can prove
to be better investment for the short term credit risk as company believes in maximizing the
returns through investing the various investments together it is generating good amount of
cash flows from its revenue.
It can be stated from the ratio analysis of both the companies that JB Hi-Fi possesses
more extensive cash resources as compared to Harvey Norman. The JB Hi-Fi Company
invest only that proportion of its cash resources that it has realized from its savings and does
not excessively invest in the cash generating options such as fixed assets. On the other hand,
Harvey Norman does not hold it cash resources as it excessively invest the cash realized into
its investment in fixed assets and thus does not stores adequate cash resources on hand.
The company Harvey Norman possesses more ability to survive in the long-term as it
has more cash generating capacity. Also, it is able to adequately manage its cash activities by
investing in properties and purchase of fixed assets. On the other hand, JB Hi-Fi although is
generating cash flows from its operational activities but is not able to adequately manage its
cash investments. The company has also incorporated debt in its capital structure that can
restrict its long-term growth and profitability.
Page 10 of 12
Paraphrase This Document
Need a fresh take? Get an instant paraphrase of this document with our AI Paraphraser
On comparing the cash to sales ratio for both the companies it has been found that
Harvey Norman Holding Limited has generated 24.37 % cash resources from its sales
revenue while JB HiFi has generated only 4.68% cash resources in year 2016. So, it can be
concluded that Harvey Norman is successfully utilising its resources to generate enough cash
from its revenue.
Page 11 of 12
Harvey Norman Holding Limited has generated 24.37 % cash resources from its sales
revenue while JB HiFi has generated only 4.68% cash resources in year 2016. So, it can be
concluded that Harvey Norman is successfully utilising its resources to generate enough cash
from its revenue.
Page 11 of 12
1 out of 11
Related Documents


Your All-in-One AI-Powered Toolkit for Academic Success.
+13062052269
info@desklib.com
Available 24*7 on WhatsApp / Email
![[object Object]](/_next/static/media/star-bottom.7253800d.svg)
Unlock your academic potential
Copyright © 2020–2026 A2Z Services. All Rights Reserved. Developed and managed by ZUCOL.