ACFI 2208 - Performance Measurement in Organisations: Age UK
VerifiedAdded on 2023/06/09
|11
|2196
|114
Report
AI Summary
This report provides an analysis of Age UK's performance measurement within the context of sustainability accounting. It evaluates the financial performance of Age UK using ratio analysis, examining donor dependency, income utilization, and fundraising efficiency based on 2016 and 2017 financial data. The report also assesses non-financial performance by identifying and analyzing key performance indicators (KPIs) related to Age UK's social sustainability efforts, including donor growth rate, fundraising ROI, volunteer rates, outreach, advocacy, and risk management and governance. The analysis concludes that Age UK demonstrates adequate financial performance and effectively raises funds, while also employing relevant KPIs to gauge social performance.
Performance Measurement in Organisations
Paraphrase This Document
Need a fresh take? Get an instant paraphrase of this document with our AI Paraphraser
Introduction
The present report is developed for gaining an analysis of the performance measurement
of non-profit organizations in the context of sustainability accounting and reporting. In this
context, the performance of a NGO, that is, Age UK, one of the largest charity of the UK
working for the welfare of old people is analyzed in the report. The financial performance of Age
UK is analyzed with the use of ratio evaluation by examining the financial results of the year
2016 and 2017 such as donor dependency, income utilization, raising donations and others. In
addition to this, the non-financial performance is analyzed by identification and examination of
the KPI’s of Age UK that helps in depicting their performance in the social area of sustainability.
Performance Measurement
Ratio Analysis of the AGE UK
Ratio analysis refers to the quantitative analysis of the financial information that is
presented in the financial statements. It is done to define the various kinds of relationship
between the financial items. In this section of the report, ratio analyse has been made of AGE
UK for year 2016 and 2017. As AGE UK is the Not for profit organization there is need to use
some specific ratios that helps make proper evaluation of performance measurement of this
organization. Detailed ratio analysis of AGE UK has been provided below:
Current Ratio: This ratio is calculated to determine the ability of company to pay the short term
liabilities through use of current assets. Generally this ratio is used in profit making companies
but NPO uses this ratio to have knowledge that there are sufficient funds to pay off its immediate
debts that arises within 12 months. This ratio is calculated as current assets divided by current
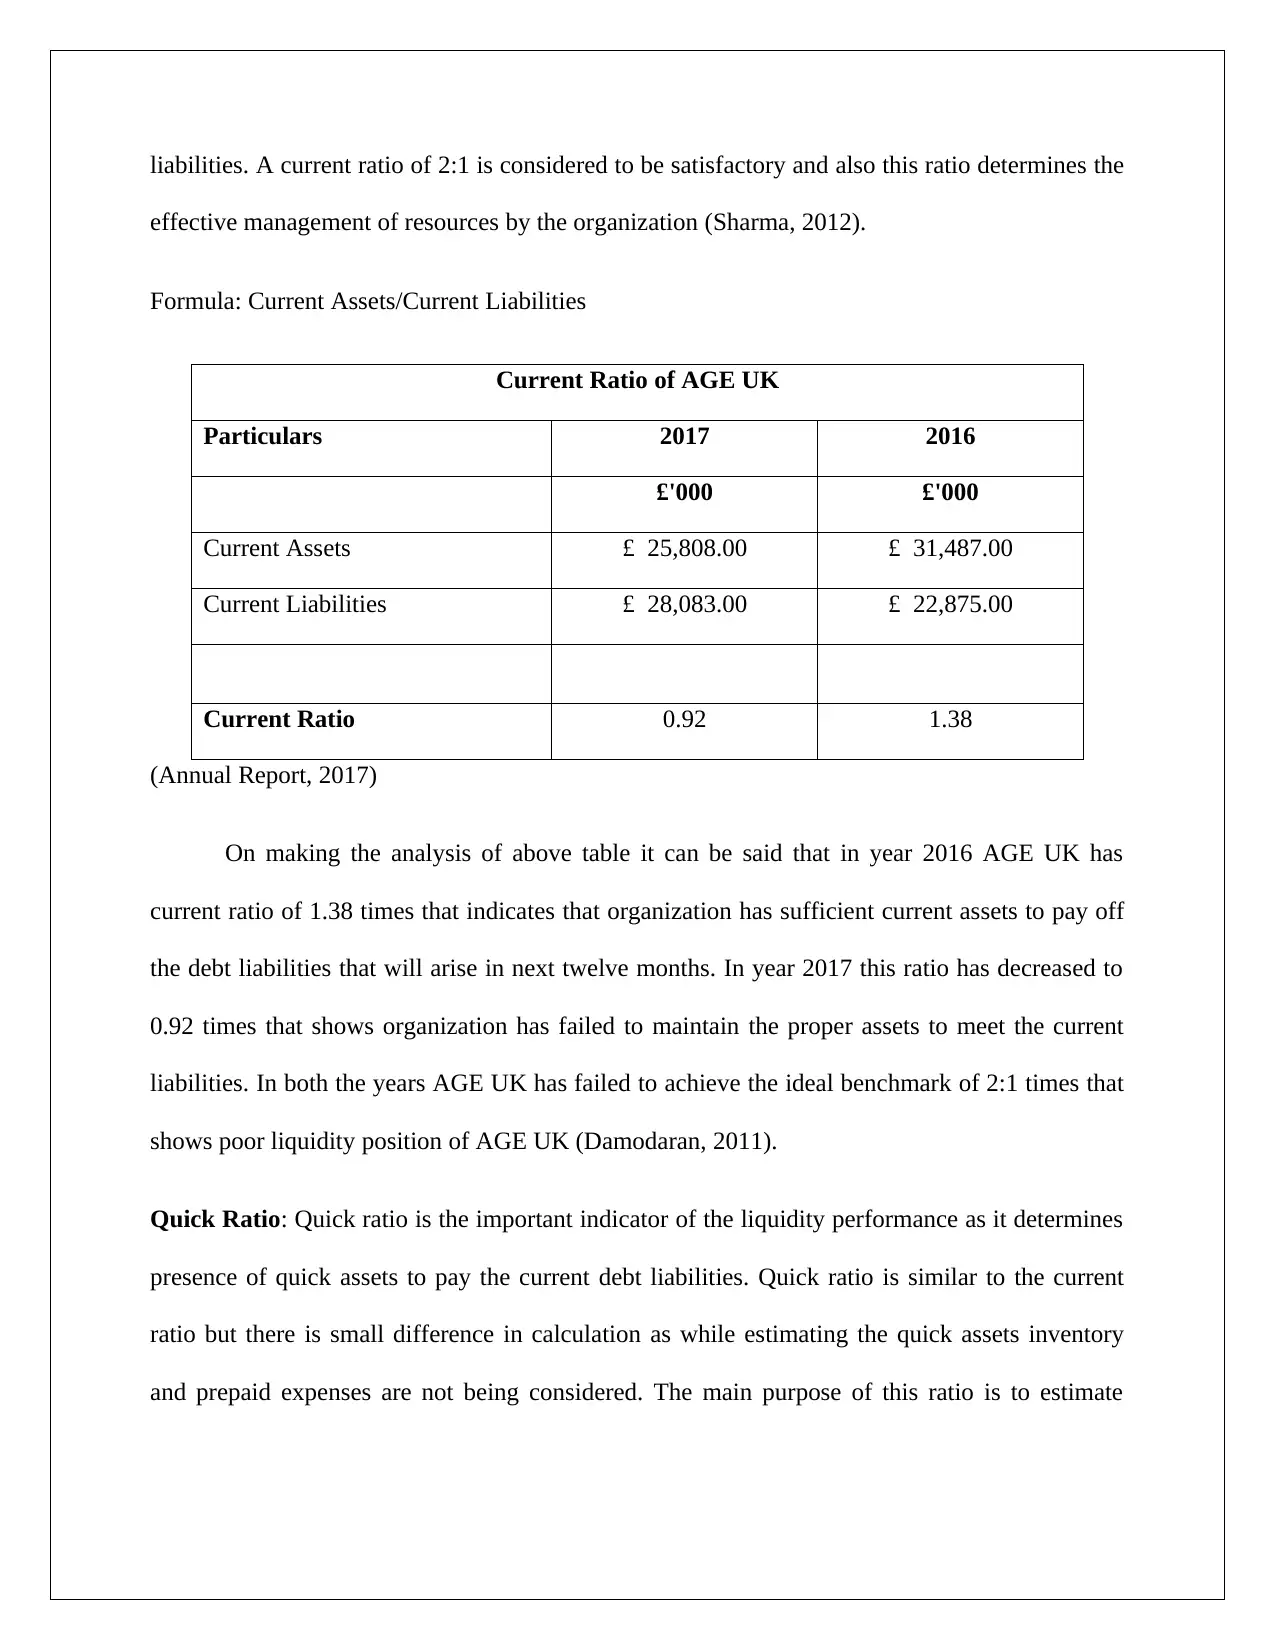
liabilities. A current ratio of 2:1 is considered to be satisfactory and also this ratio determines the
effective management of resources by the organization (Sharma, 2012).
Formula: Current Assets/Current Liabilities
Current Ratio of AGE UK
Particulars 2017 2016
£'000 £'000
Current Assets £ 25,808.00 £ 31,487.00
Current Liabilities £ 28,083.00 £ 22,875.00
Current Ratio 0.92 1.38
(Annual Report, 2017)
On making the analysis of above table it can be said that in year 2016 AGE UK has
current ratio of 1.38 times that indicates that organization has sufficient current assets to pay off
the debt liabilities that will arise in next twelve months. In year 2017 this ratio has decreased to
0.92 times that shows organization has failed to maintain the proper assets to meet the current
liabilities. In both the years AGE UK has failed to achieve the ideal benchmark of 2:1 times that
shows poor liquidity position of AGE UK (Damodaran, 2011).
Quick Ratio: Quick ratio is the important indicator of the liquidity performance as it determines
presence of quick assets to pay the current debt liabilities. Quick ratio is similar to the current
ratio but there is small difference in calculation as while estimating the quick assets inventory
and prepaid expenses are not being considered. The main purpose of this ratio is to estimate
⊘ This is a preview!⊘
Do you want full access?
Subscribe today to unlock all pages.
Trusted by 1+ million students worldwide
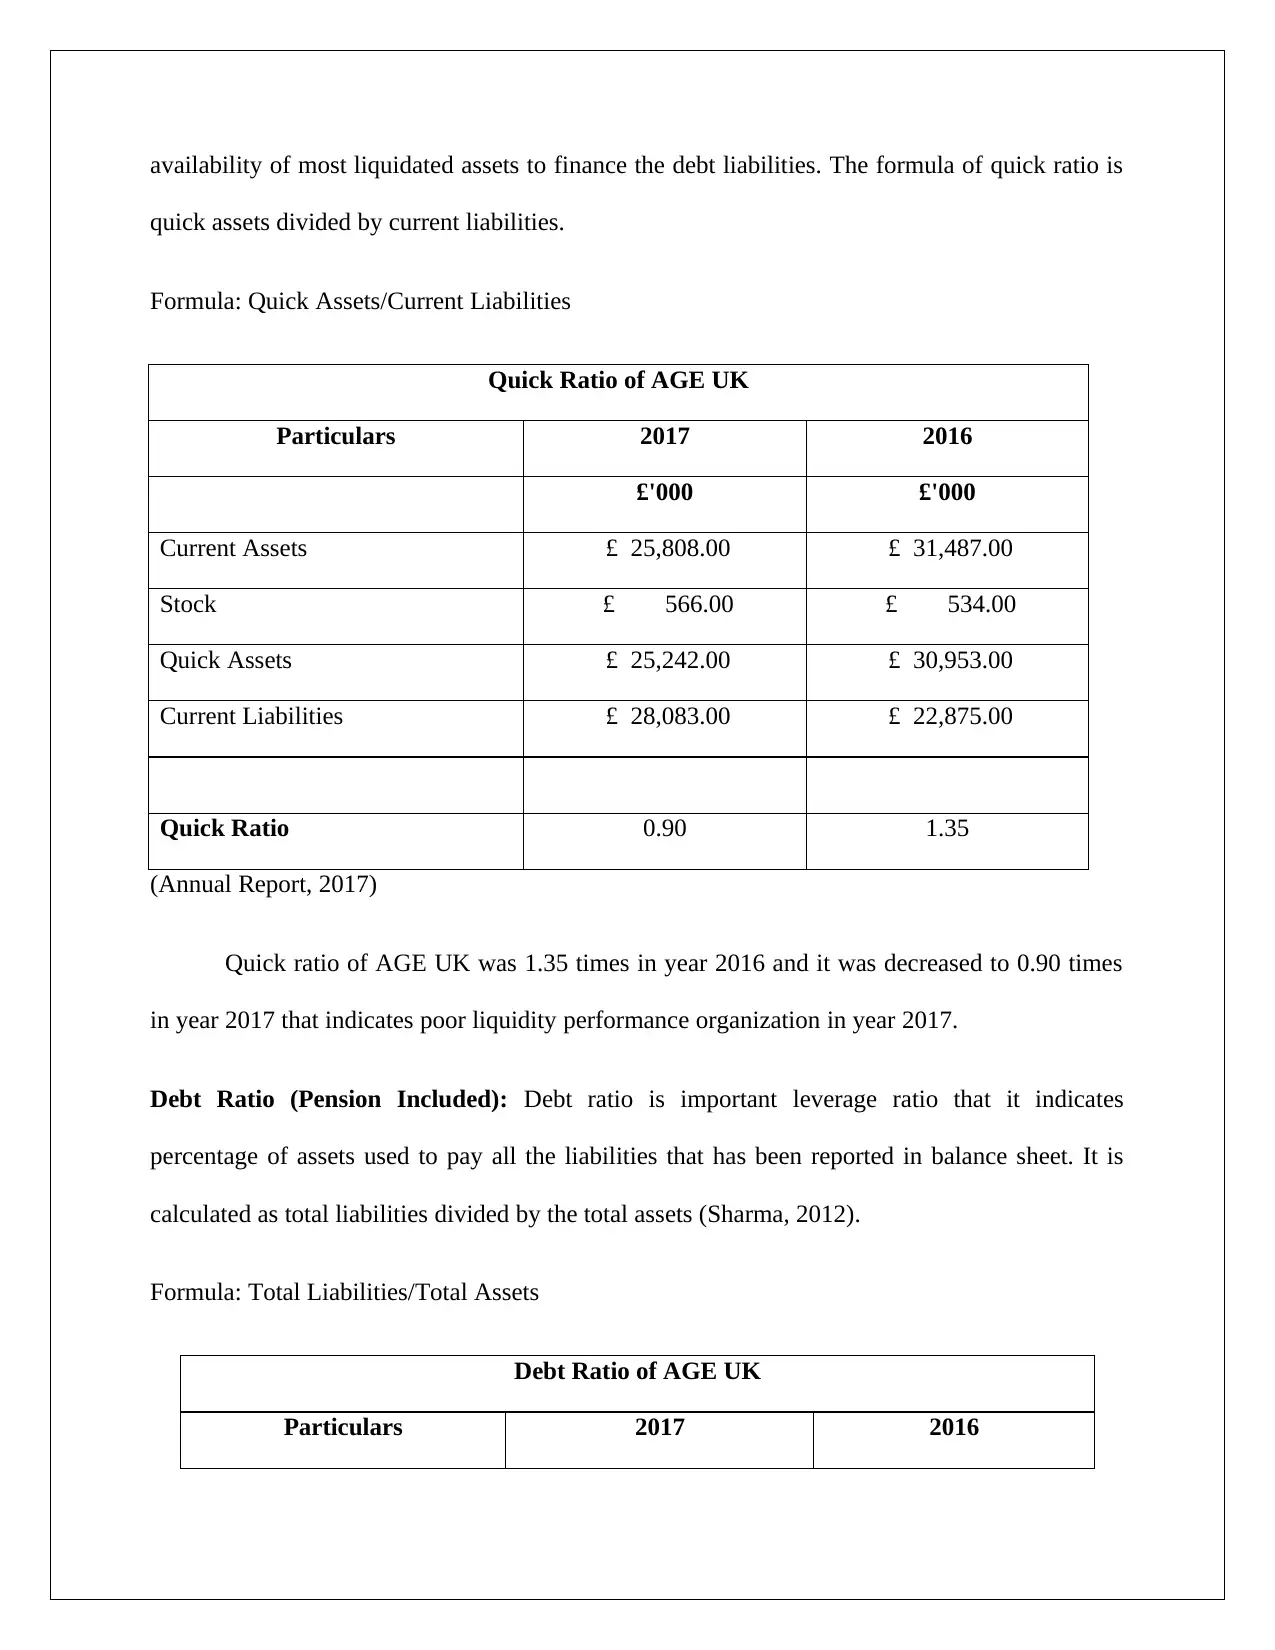
availability of most liquidated assets to finance the debt liabilities. The formula of quick ratio is
quick assets divided by current liabilities.
Formula: Quick Assets/Current Liabilities
Quick Ratio of AGE UK
Particulars 2017 2016
£'000 £'000
Current Assets £ 25,808.00 £ 31,487.00
Stock £ 566.00 £ 534.00
Quick Assets £ 25,242.00 £ 30,953.00
Current Liabilities £ 28,083.00 £ 22,875.00
Quick Ratio 0.90 1.35
(Annual Report, 2017)
Quick ratio of AGE UK was 1.35 times in year 2016 and it was decreased to 0.90 times
in year 2017 that indicates poor liquidity performance organization in year 2017.
Debt Ratio (Pension Included): Debt ratio is important leverage ratio that it indicates
percentage of assets used to pay all the liabilities that has been reported in balance sheet. It is
calculated as total liabilities divided by the total assets (Sharma, 2012).
Formula: Total Liabilities/Total Assets
Debt Ratio of AGE UK
Particulars 2017 2016
Paraphrase This Document
Need a fresh take? Get an instant paraphrase of this document with our AI Paraphraser
£'000 £'000
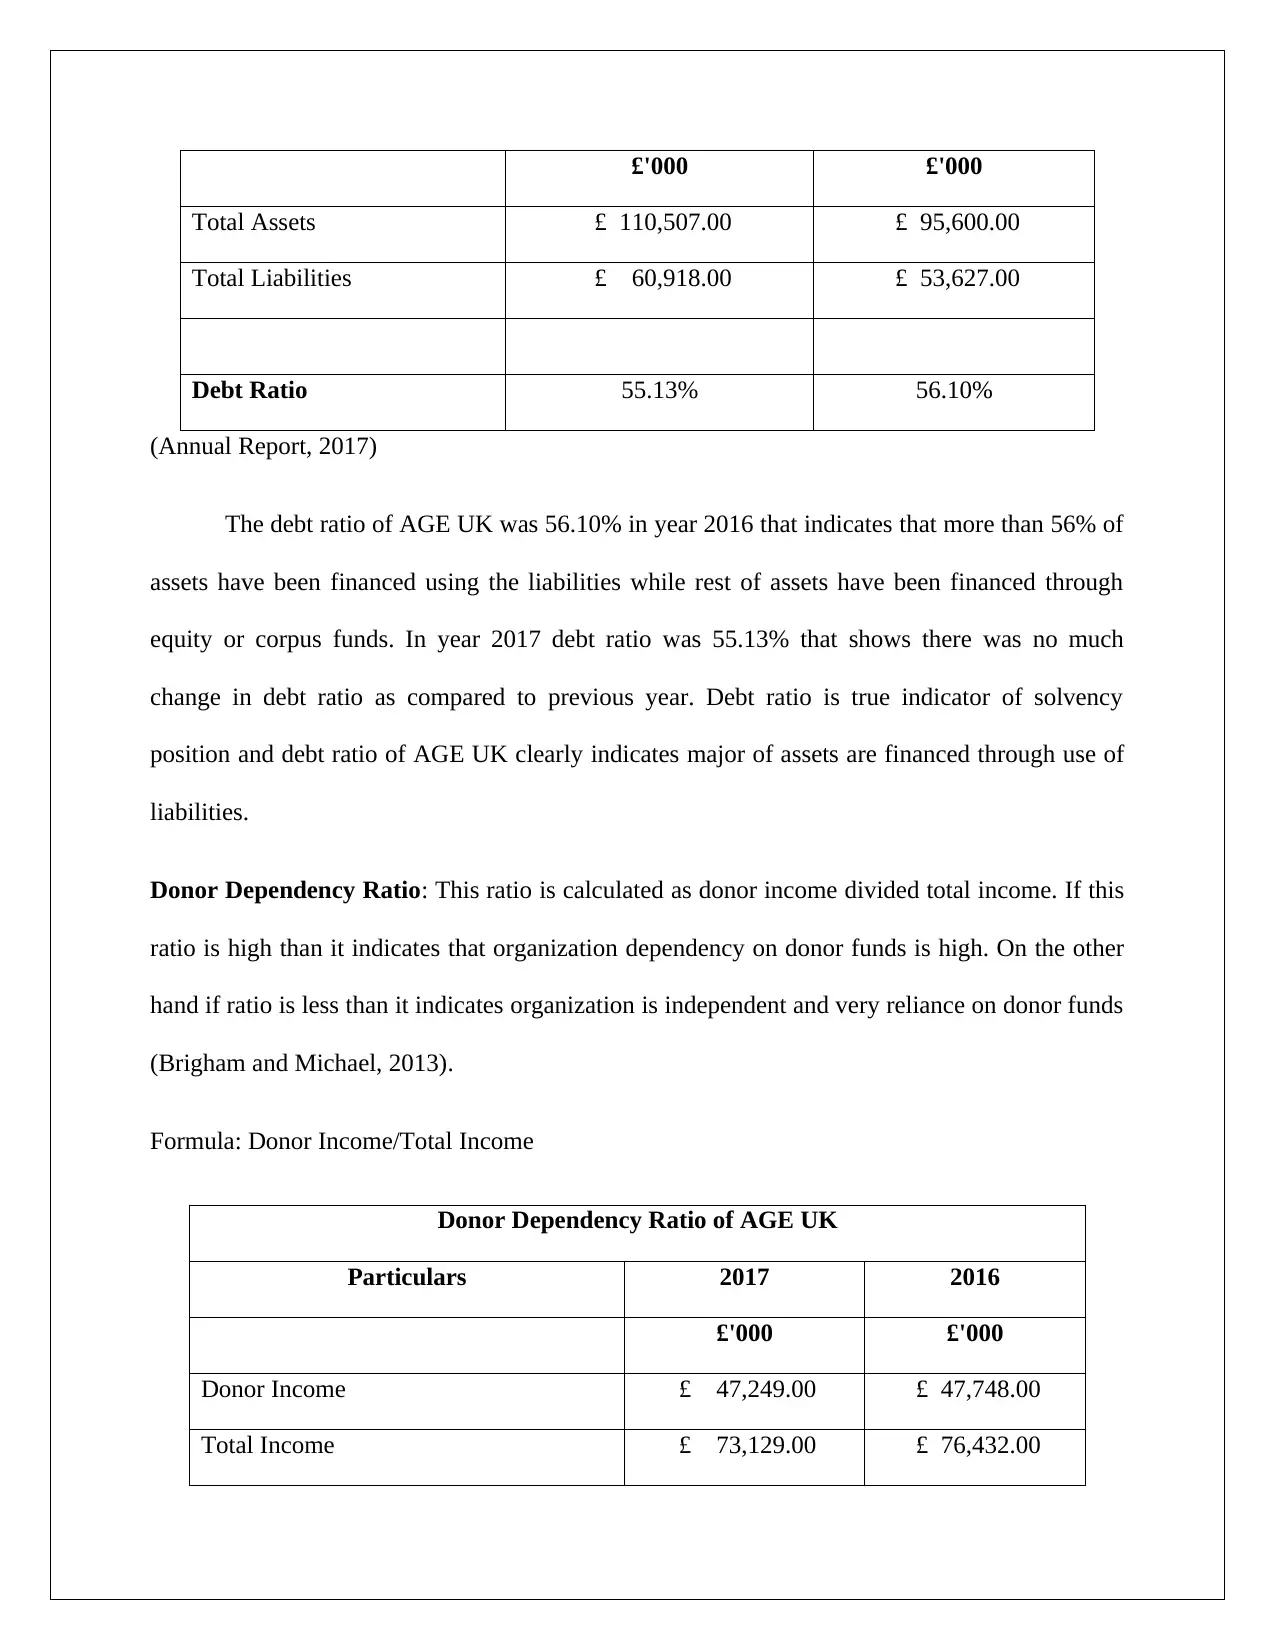
Total Assets £ 110,507.00 £ 95,600.00
Total Liabilities £ 60,918.00 £ 53,627.00
Debt Ratio 55.13% 56.10%
(Annual Report, 2017)
The debt ratio of AGE UK was 56.10% in year 2016 that indicates that more than 56% of
assets have been financed using the liabilities while rest of assets have been financed through
equity or corpus funds. In year 2017 debt ratio was 55.13% that shows there was no much
change in debt ratio as compared to previous year. Debt ratio is true indicator of solvency
position and debt ratio of AGE UK clearly indicates major of assets are financed through use of
liabilities.
Donor Dependency Ratio: This ratio is calculated as donor income divided total income. If this
ratio is high than it indicates that organization dependency on donor funds is high. On the other
hand if ratio is less than it indicates organization is independent and very reliance on donor funds
(Brigham and Michael, 2013).
Formula: Donor Income/Total Income
Donor Dependency Ratio of AGE UK
Particulars 2017 2016
£'000 £'000
Donor Income £ 47,249.00 £ 47,748.00
Total Income £ 73,129.00 £ 76,432.00
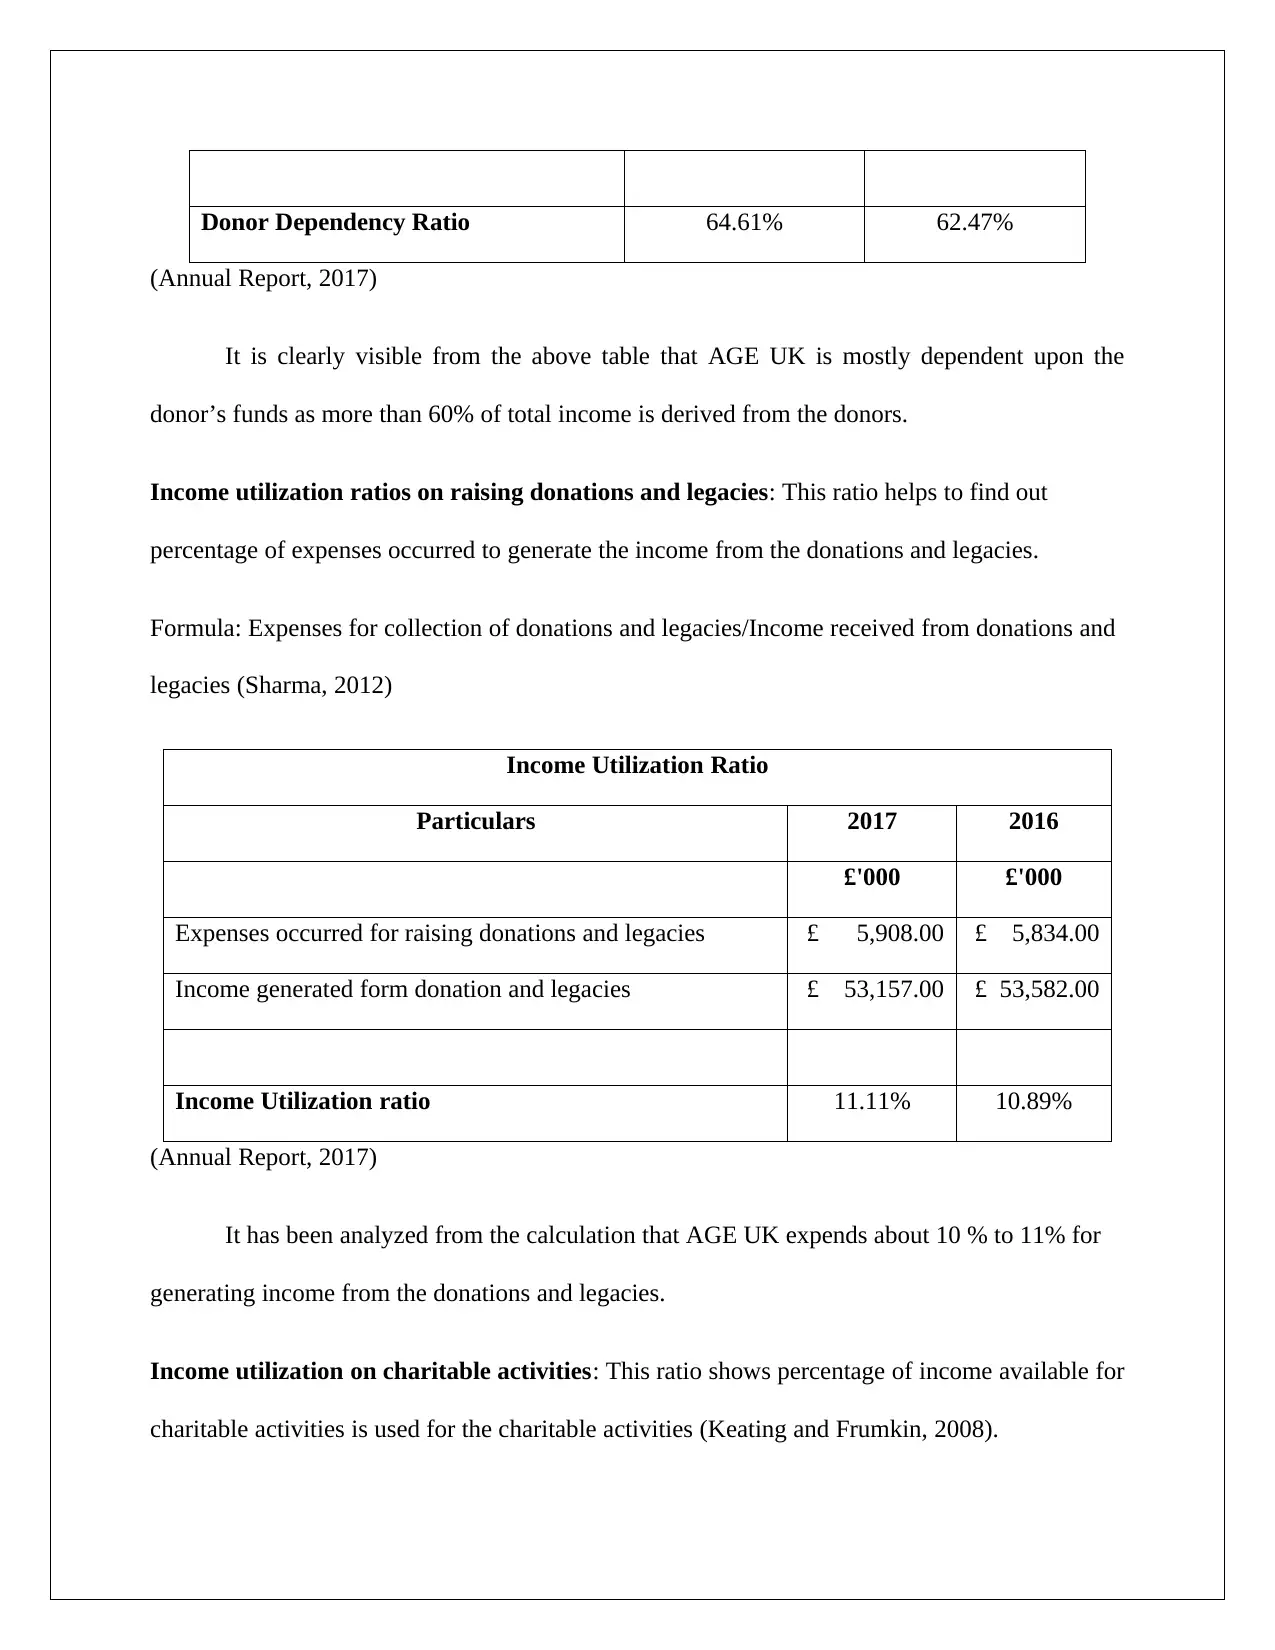
Donor Dependency Ratio 64.61% 62.47%
(Annual Report, 2017)
It is clearly visible from the above table that AGE UK is mostly dependent upon the
donor’s funds as more than 60% of total income is derived from the donors.
Income utilization ratios on raising donations and legacies: This ratio helps to find out
percentage of expenses occurred to generate the income from the donations and legacies.
Formula: Expenses for collection of donations and legacies/Income received from donations and
legacies (Sharma, 2012)
Income Utilization Ratio
Particulars 2017 2016
£'000 £'000
Expenses occurred for raising donations and legacies £ 5,908.00 £ 5,834.00
Income generated form donation and legacies £ 53,157.00 £ 53,582.00
Income Utilization ratio 11.11% 10.89%
(Annual Report, 2017)
It has been analyzed from the calculation that AGE UK expends about 10 % to 11% for
generating income from the donations and legacies.
Income utilization on charitable activities: This ratio shows percentage of income available for
charitable activities is used for the charitable activities (Keating and Frumkin, 2008).
(Annual Report, 2017)
It is clearly visible from the above table that AGE UK is mostly dependent upon the
donor’s funds as more than 60% of total income is derived from the donors.
Income utilization ratios on raising donations and legacies: This ratio helps to find out
percentage of expenses occurred to generate the income from the donations and legacies.
Formula: Expenses for collection of donations and legacies/Income received from donations and
legacies (Sharma, 2012)
Income Utilization Ratio
Particulars 2017 2016
£'000 £'000
Expenses occurred for raising donations and legacies £ 5,908.00 £ 5,834.00
Income generated form donation and legacies £ 53,157.00 £ 53,582.00
Income Utilization ratio 11.11% 10.89%
(Annual Report, 2017)
It has been analyzed from the calculation that AGE UK expends about 10 % to 11% for
generating income from the donations and legacies.
Income utilization on charitable activities: This ratio shows percentage of income available for
charitable activities is used for the charitable activities (Keating and Frumkin, 2008).
⊘ This is a preview!⊘
Do you want full access?
Subscribe today to unlock all pages.
Trusted by 1+ million students worldwide
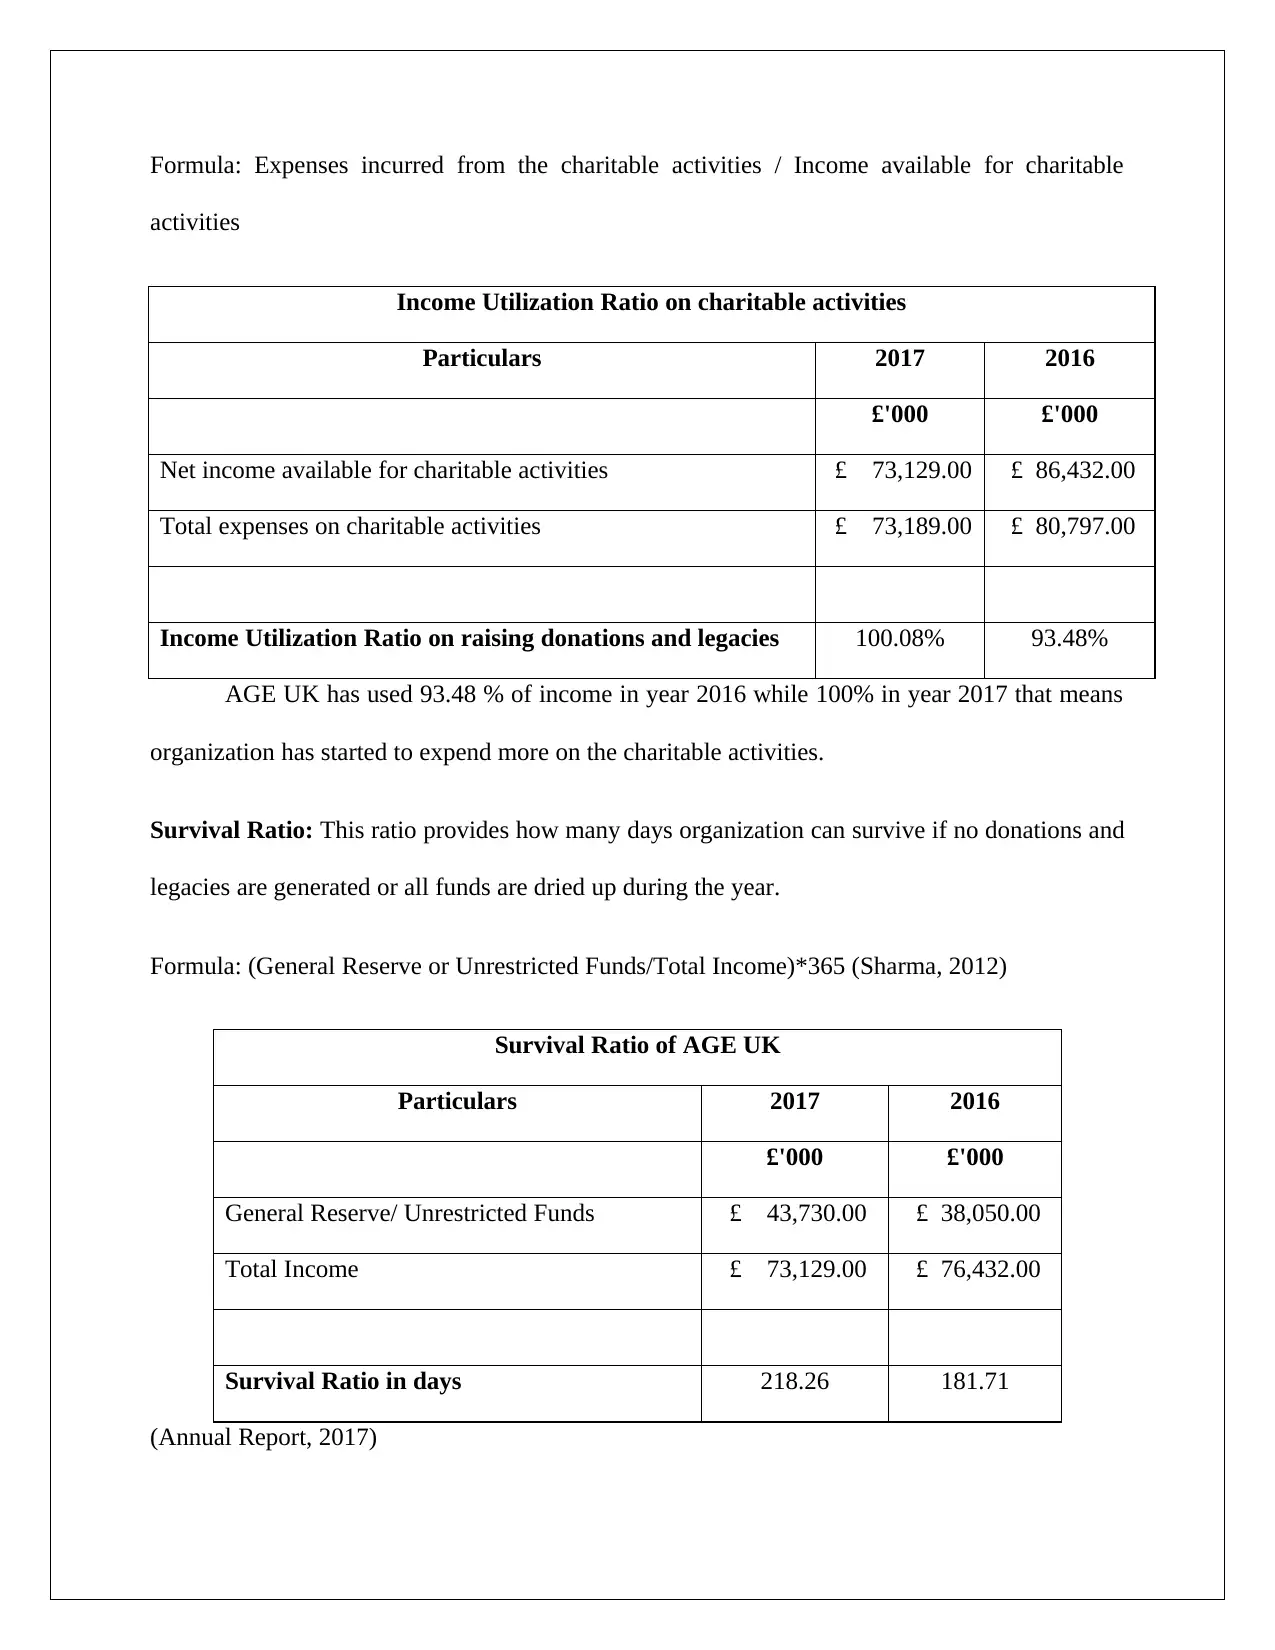
Formula: Expenses incurred from the charitable activities / Income available for charitable
activities
Income Utilization Ratio on charitable activities
Particulars 2017 2016
£'000 £'000
Net income available for charitable activities £ 73,129.00 £ 86,432.00
Total expenses on charitable activities £ 73,189.00 £ 80,797.00
Income Utilization Ratio on raising donations and legacies 100.08% 93.48%
AGE UK has used 93.48 % of income in year 2016 while 100% in year 2017 that means
organization has started to expend more on the charitable activities.
Survival Ratio: This ratio provides how many days organization can survive if no donations and
legacies are generated or all funds are dried up during the year.
Formula: (General Reserve or Unrestricted Funds/Total Income)*365 (Sharma, 2012)
Survival Ratio of AGE UK
Particulars 2017 2016
£'000 £'000
General Reserve/ Unrestricted Funds £ 43,730.00 £ 38,050.00
Total Income £ 73,129.00 £ 76,432.00
Survival Ratio in days 218.26 181.71
(Annual Report, 2017)
Paraphrase This Document
Need a fresh take? Get an instant paraphrase of this document with our AI Paraphraser
As per the ratio organization can survive for 218 days in year 2017 if no funds will be
generated during the year.
Non Performance Measurement
Theoretical discussion about social sustainability
Social sustainability can be defined as identification and managing the business impacts,
that is, positive and negative, on people successfully. Businesses need to develop the process and
structures efficiently so that they are able to meet the varying needs and requirements of
communities at present and also in future generations. It involves gaining an in-depth
understanding of the impact of business corporations on society at large. The business practices
and procedures should be developed in a way so that they are able to produce maximum impact
on the society and minimizing its negative effects. The business can improve their social
sustainability performance by integrating a social perspective into their governance, systems,
processes, practices and operations. The social performance can be enhanced by maintaining
positive relations with employees, community and customers.
Social sustainability performance can be improved by businesses through maximizing its
economic and environmental performance. Environmental sustainability involves reducing the
business activities that negatively impacts the environment and thus maximizing the societal
growth. On the other hand, the economic performance involves maximizing its profitability
through adoption of adequate governance and risk management policies. The increasing
profitability of business will help in promoting social performance by producing maximizing
profits for the communities (Carbo, 2017).
Analysis of the social sustainability KPIs of the charity
KPI’s (Key Performance Indicator) can be regarded as quantifiable measures that are
used for evaluating the success of a business organization. The non-profit organizations such as
Age UK places emphasize on measuring revenue and donation metrics while developing the
KPI’s. The KPI’s of Age UK are identified and analyzed as follows:
Growth rate of Donor: The rate of growth of donor as a KPI of the NGO to gain an
analysis of the funds donated by the donors to the organization. The financial reports of
the NGO provide a measurement of the donation rate by comparing the present year
donation figure with that of the previous year. This will help in developing an analysis of
the trust and confidence developed by the NGO among the society.
Returns Realized from Raising Funds: Measuring ROI (Return on Investment) of all the
resources that are used in raising funds is also an effective KPI of the NGO. It involves
taking into account the time incurred on raising funds, developing mission and marketing
strategies for gaining charities. The greater the ROI the larger is the charity realized by
the NGO for promoting social welfare.
Rate of Volunteer: The KPI helps in measuring the number of volunteers the NGO has
used for raising funds. Volunteers play an important role in promoting the growth and
development of the NGO by ensuring that its services are effectively implemented
(Annual Report, 2017).
Outreach and Advocacy: This KPI helps in providing a measurement of the community
events that are organized by the NGO. Also, it provides a measurement of the training
providing to the advocates and the attendance rates of people within the community
events organized by NGO.
⊘ This is a preview!⊘
Do you want full access?
Subscribe today to unlock all pages.
Trusted by 1+ million students worldwide
Risk Management & Governance: The proper implementation of the risk management
and governance system is necessary for the continuing growth and development of a
NGO. It can be measured by assessing the programs used for mitigation of the emergency
conditions and effectiveness of the governance policies so that all the internal activities
are carried out in an efficient manner and the charity realized is used for societal welfare
(Epstein and Yuthas, 2017).
Conclusion
The report has concluded that Age UK financial performance is adequate and it is able to
effectively raise funds for promoting the growth and development of old age people as indicated
from the results of different ratio’s. Also, its non-financial performance has indicated that the
non-profit organization has developed effective KPI’s for gaining an analysis of its social
performance.
Paraphrase This Document
Need a fresh take? Get an instant paraphrase of this document with our AI Paraphraser
References
About AGE UK. 2018. [Online]. Available at: https://www.ageuk.org.uk/about-us/what-we-do/
[Accessed on: 14 August 2018].
Annual Report 2017. AGE UK. [Online]. Available at:
https://www.ageuk.org.uk/globalassets/age-uk/documents/annual-reports-and-reviews/
report_of_trustees_and_annual_accounts_2016_2017.pdf [Accessed on: 14 August 2018].
Brigham, F., and Michael C. 2013. Financial management: Theory & practice. Cengage
Learning.
Carbo, J. 2017. Social Sustainability for Business. Routledge.
Damodaran, A, 2011. Applied corporate finance. John Wiley & sons.
Epstein, M. and Yuthas, K. 2017. Measuring and Improving Social Impacts: A Guide for
Nonprofits, Companies and Impact Investors. Routledge.
Keating, E.K. and Frumkin, P. 2008. How to Assess Nonprofit Financial Performance. [Online].
Available at: https://nasaa-arts.org/wp-content/uploads/2017/03/Reading-5-Understanding-
Financial-Statements.pdf [Accessed on: 14 August 2018].
Sharma. P. 2012. Performance Measurement in NGOs. [Online]. Available at:
https://browneandmohan.files.wordpress.com/2012/12/pratibha-sharma-journal.pdf [Accessed
on: 14 August 2018].
1 out of 11
Related Documents


Your All-in-One AI-Powered Toolkit for Academic Success.
+13062052269
info@desklib.com
Available 24*7 on WhatsApp / Email
![[object Object]](/_next/static/media/star-bottom.7253800d.svg)
Unlock your academic potential
Copyright © 2020–2026 A2Z Services. All Rights Reserved. Developed and managed by ZUCOL.