Acid-Base Titration: Determining Ca(OH)2 Content and Purity

Verified

Added on  2023/03/30

|7
|1302
|220
Practical Assignment
AI Summary
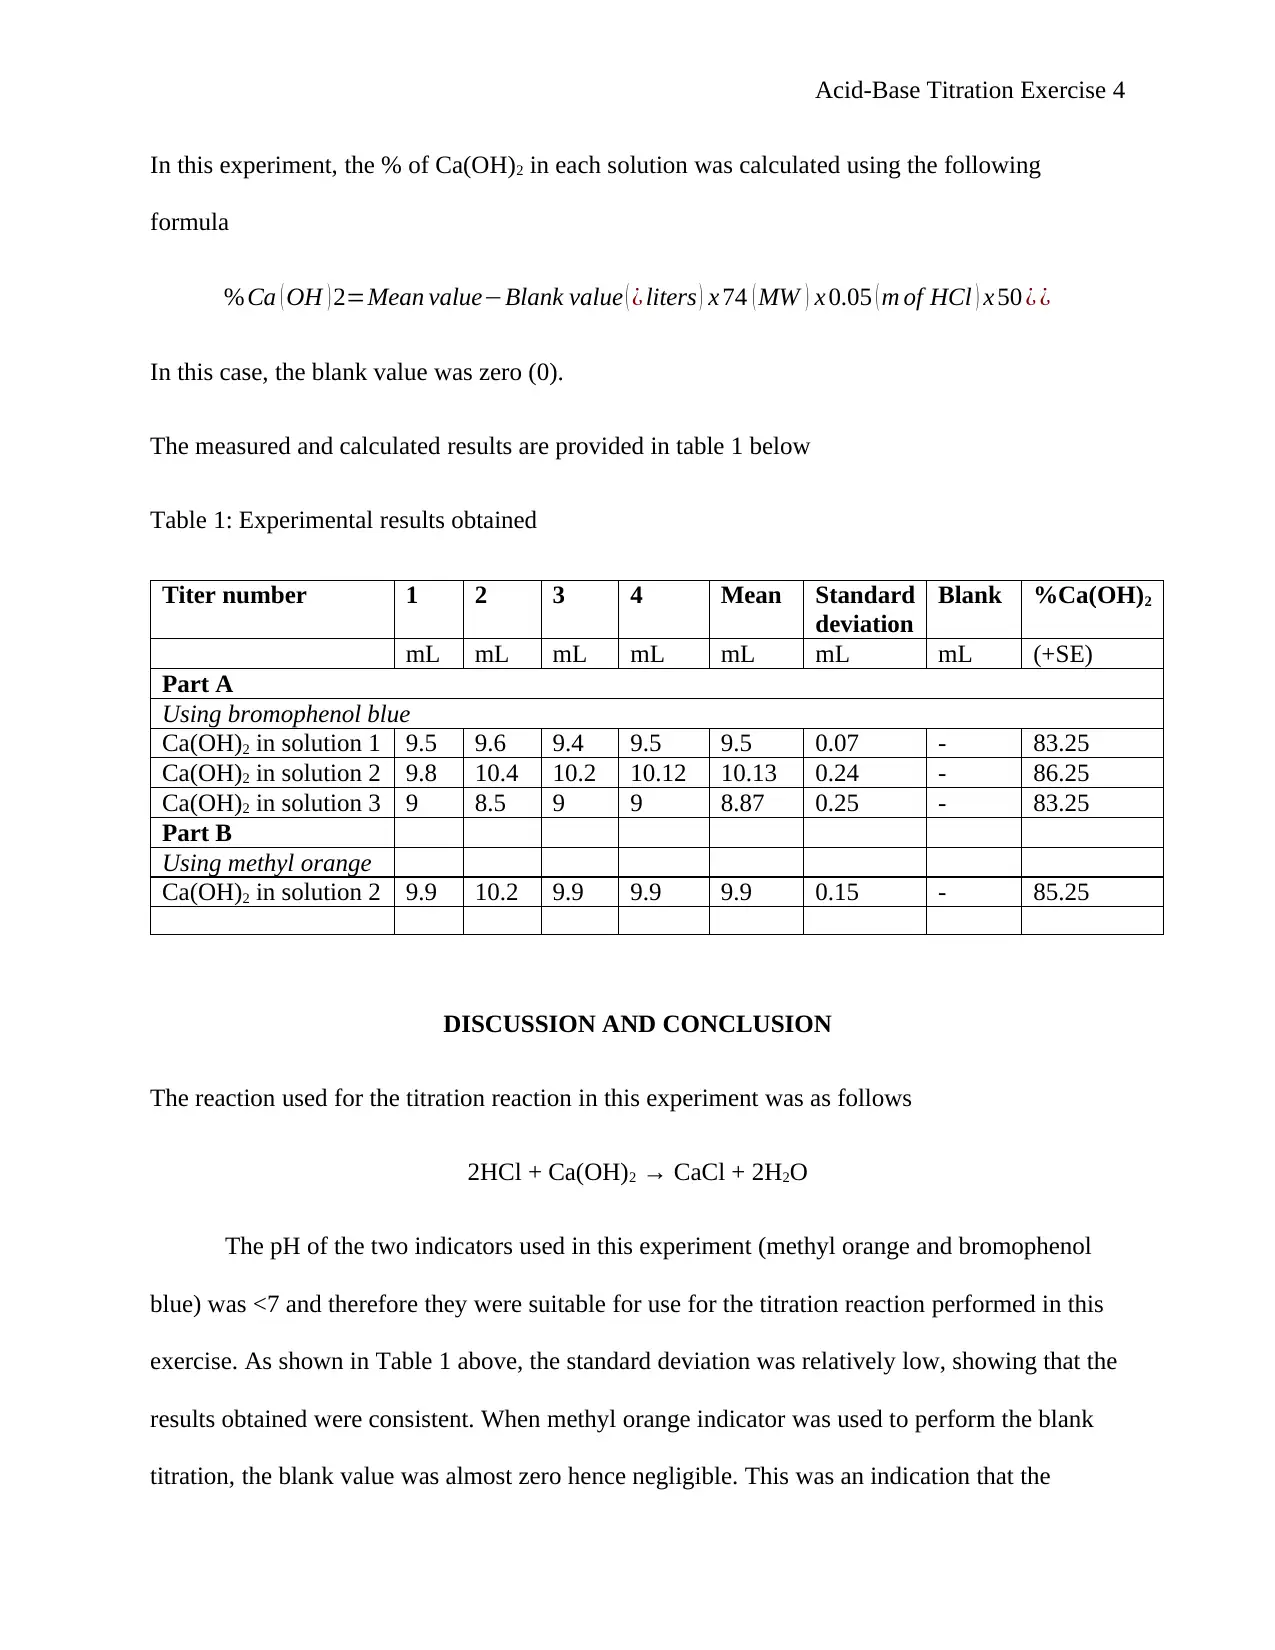
This practical assignment details an acid-base titration experiment conducted to determine the concentration and purity of calcium hydroxide (Ca(OH)2) in three different solutions. The experiment involves titrating the Ca(OH)2 solutions with a standard hydrochloric acid (HCl) solution using bromophenol blue and methyl orange as indicators. The results obtained are used to calculate the percentage of Ca(OH)2 in each solution and compare it against the manufacturer's claim. The exercise also examines the impact of different indicators on the titration results and includes a reflection on the principles of acid-base titration and the importance of selecting appropriate indicators. The findings reveal that the Ca(OH)2 concentrations in the tested solutions were below the manufacturer's specified range, indicating a technical grade quality.
Document Page
Acid-Base Titration Exercise 1
PRACTICAL 6: ACID-BASE TITRATION EXERCISE
Name
Course
Professor
University
City/state
Date
tabler-icon-diamond-filled.svg

Paraphrase This Document

Need a fresh take? Get an instant paraphrase of this document with our AI Paraphraser
Document Page
Acid-Base Titration Exercise 2
PRACTICAL 6: ACID-BASE TITRATION EXERCISE
INTRODUCTION AND AIMS
Acid-base titration is an experiment carried to determine the amount or concentration of a known
basic or acidic solution by mixing the subject base and acid (Virtual Lab, 2011). One of
solutions, known as reagent or titrant, must have a known molarity while the other solution,
known as analyte or titrant has an unknown molarity (Lumen Learning, (n.d.)). In this
experiment, an indicator is used to show a visible change (where the color of the analyte changes
when the titrant is added to it) when the acid-base reaction is complete (Malone & Dolter, 2010).
Acid-base reaction basically involves neutralization of the acid and base to form water and a salt,
as follows:
Acid + hydroxide (base) → water + salt
In this reaction, the acid’s active ingredient [H+(aq)] reacts with the base’s active
ingredient ([OH-(aq)] to form a salt and water (H2O), which is a liquid (Iacuone, 2018). The
equation of this reaction is represented as follows
H+(aq) + OH-(aq) → H2O (liquid)
Data obtained from an acid-base titration can be used to determine the solution’s
unknown molarity. it is also necessary to know the indicator’s molarity when carrying out this
experiment.
The main aim of this exercise is to use titration method to determine the amount of
calcium hydroxide of lime (Ca(OH)2) in three different solutions, examine the solutions’ purity
and compare the percentage of Ca(OH)2 obtained with the manufacturer’s claim. The effect of
Document Page
Acid-Base Titration Exercise 3
the type of indicator used in performing the experiment on the results obtained will also be
examined.
MATERIALS AND METHOD
As aforementioned, three different Ca(OH)2 solutions were used. A pipette was used to
transfer 20.00 mL of the Ca(OH)2 solution into a clean, dry 100 mL Erlenmeyer flask. About
four drops of bromophenol blue indicator (of pH 2.8-4.6) were added to the solution. 0.05 M
standard hydrochloric acid (HCl) was filled up into the burette to the zero mark. The HCl was
titrated gently into the flask containing the first Ca(OH)2 solution until the endpoint when the
color of the solution changed from blue to yellow. The titer (amount of volume in the burette)
was recorded as A. The same procedure was repeated to record three more values. The above
steps were repeated for the other two Ca(OH)2 solutions.
A pipette was used to transfer 20.00 mL of distilled water into a clean, dry 100 mL
Erlenmeyer flask. The previous steps of titration were repeated and the volume recorded as B.
The value of B was subtracted from A and recorded as corrected titer.
One sample of the Ca(OH)2 solutions was titrated using phenolphthalein (pH of 8.2-10)
and methyl orange (pH 2.9-4.6) indicators. The color of the solution at the endpoint when
phenolphthalein indicator was used changed from pink to colorless while that of methyl orange
changed from orange to red.
RESULTS
The percentage of Ca(OH)2 was calculated using the following formula
% of Ca(OH)2 = [A – B (in liters)] x 9250
Document Page
Acid-Base Titration Exercise 4
In this experiment, the % of Ca(OH)2 in each solution was calculated using the following
formula
%Ca ( OH ) 2=Mean valueBlank value ( ¿ liters ) x 74 ( MW ) x 0.05 ( m of HCl ) x 50 ¿ ¿
In this case, the blank value was zero (0).
The measured and calculated results are provided in table 1 below
Table 1: Experimental results obtained
Titer number 1 2 3 4 Mean Standard
deviation
Blank %Ca(OH)2
mL mL mL mL mL mL mL (+SE)
Part A
Using bromophenol blue
Ca(OH)2 in solution 1 9.5 9.6 9.4 9.5 9.5 0.07 - 83.25
Ca(OH)2 in solution 2 9.8 10.4 10.2 10.12 10.13 0.24 - 86.25
Ca(OH)2 in solution 3 9 8.5 9 9 8.87 0.25 - 83.25
Part B
Using methyl orange
Ca(OH)2 in solution 2 9.9 10.2 9.9 9.9 9.9 0.15 - 85.25
DISCUSSION AND CONCLUSION
The reaction used for the titration reaction in this experiment was as follows
2HCl + Ca(OH)2 → CaCl + 2H2O
The pH of the two indicators used in this experiment (methyl orange and bromophenol
blue) was <7 and therefore they were suitable for use for the titration reaction performed in this
exercise. As shown in Table 1 above, the standard deviation was relatively low, showing that the
results obtained were consistent. When methyl orange indicator was used to perform the blank
titration, the blank value was almost zero hence negligible. This was an indication that the
tabler-icon-diamond-filled.svg

Paraphrase This Document

Need a fresh take? Get an instant paraphrase of this document with our AI Paraphraser
Document Page
Acid-Base Titration Exercise 5
Ca(OH)2, the flask and other materials and apparatus used in the experiment were not
contaminated.
According to the manufacturer’s claim, the concentration of Ca(OH)2 ranges between 90
and 97%. From the results obtained in this experiment (Table 1 above), the concentration of
Ca(OH)2 in all the solutions used was below 90%. This means that none of the concentration of
the Ca(OH)2 solutions were within the manufacturer’s range. These solutions therefore received
technical grading, according to Sigma-Aldrich Grades, hence they were referred to as technical
grade lime since the percentage of Ca(OH)2 was less than 90%.
It was also found that the percentage of Ca(OH)2 when bromophenol blue indicator was
used was less (83.25%) than when methyl orange indicator was used (85.25%). These results are
also consistent and they are in agreement with the finding that the solutions used had a
concentration less than 90%.
From the results obtained, it can be concluded that the titration was carried out
successfully because the data obtained was used to determine the content of Ca(OH)2 present in
the three solutions examined. The results obtained were used to verify the purity of the solutions
against the manufacturer’s claim. In this case, the concentration of the solutions was found to be
less than the recommended range of the manufacturer (90%). The concentration of the solutions
was found to be below 90% (83.25% for solution 1, 86.25% for solution 2, 83.25% for solution 3
when phenolphthalein blue indicator was used and 85.25 for solution 1 when methyl orange
indicator was used).
REFLECTION
Document Page
Acid-Base Titration Exercise 6
Acid-base titration is a neutralization reaction and therefore the pH of the end solution is
expected to be neutral with a pH of 7. It is recommended that the indicator selected to be used in
an acid-base titration should have a pH equal to or less than 7. If this is not observed then the
color of the indicator used will change before the reaction reaches its endpoint. If the experiment
is performed accurately, then the endpoint of the indicator and that of the acid-base titration is
expected to be the same. The two indicators used in this experiment were suitable for use
because they both had a pH of less than 7 (the pH of methyl orange and that of bromophenol
blue was 2.9-4.6 and 2.8-4.6 respectively).
The results obtained showed that the concentration of the Ca(OH)2 solutions was less
than the recommended range of the manufacturer (90%). The concentration of Ca(OH)2 solution
when bromophenol blue indicator was used was slightly lower compared to when methyl orange
was used. This shows that it is important to select the right indicator to use in an acid-base
titration experiment or reaction. The experiment was very informative as it showed how one can
verify the concentration of a substance against the manufacturer’s claim.
REFERENCES
Document Page
Acid-Base Titration Exercise 7
Iacuone, S., 2018. Living systems 1: student guide to practical classes. Melbourne, Victoria:
Melbourne Polytechnic.
Lumen Learning, (n.d.). Acid-Base Titrations. [Online]
Available at: https://courses.lumenlearning.com/boundless-chemistry/chapter/acid-base-
titrations/
[Accessed 31 May 2019].
Malone, L. & Dolter, T., 2010. Basic concepts of chemistry. 3rd ed. Hoboken, NJ: Wiley.
Virtual Lab, 2011. Acid Base Titration. [Online]
Available at: https://vlab.amrita.edu/?sub=2&brch=193&sim=352&cnt=1
[Accessed 31 May 2019].
chevron_up_icon
1 out of 7
circle_padding
hide_on_mobile
zoom_out_icon
[object Object]