Accounting and Financial Analysis Report: Activision Blizzard Inc.

Verified

Added on  2022/08/12

|7
|1187
|15
Report
AI Summary
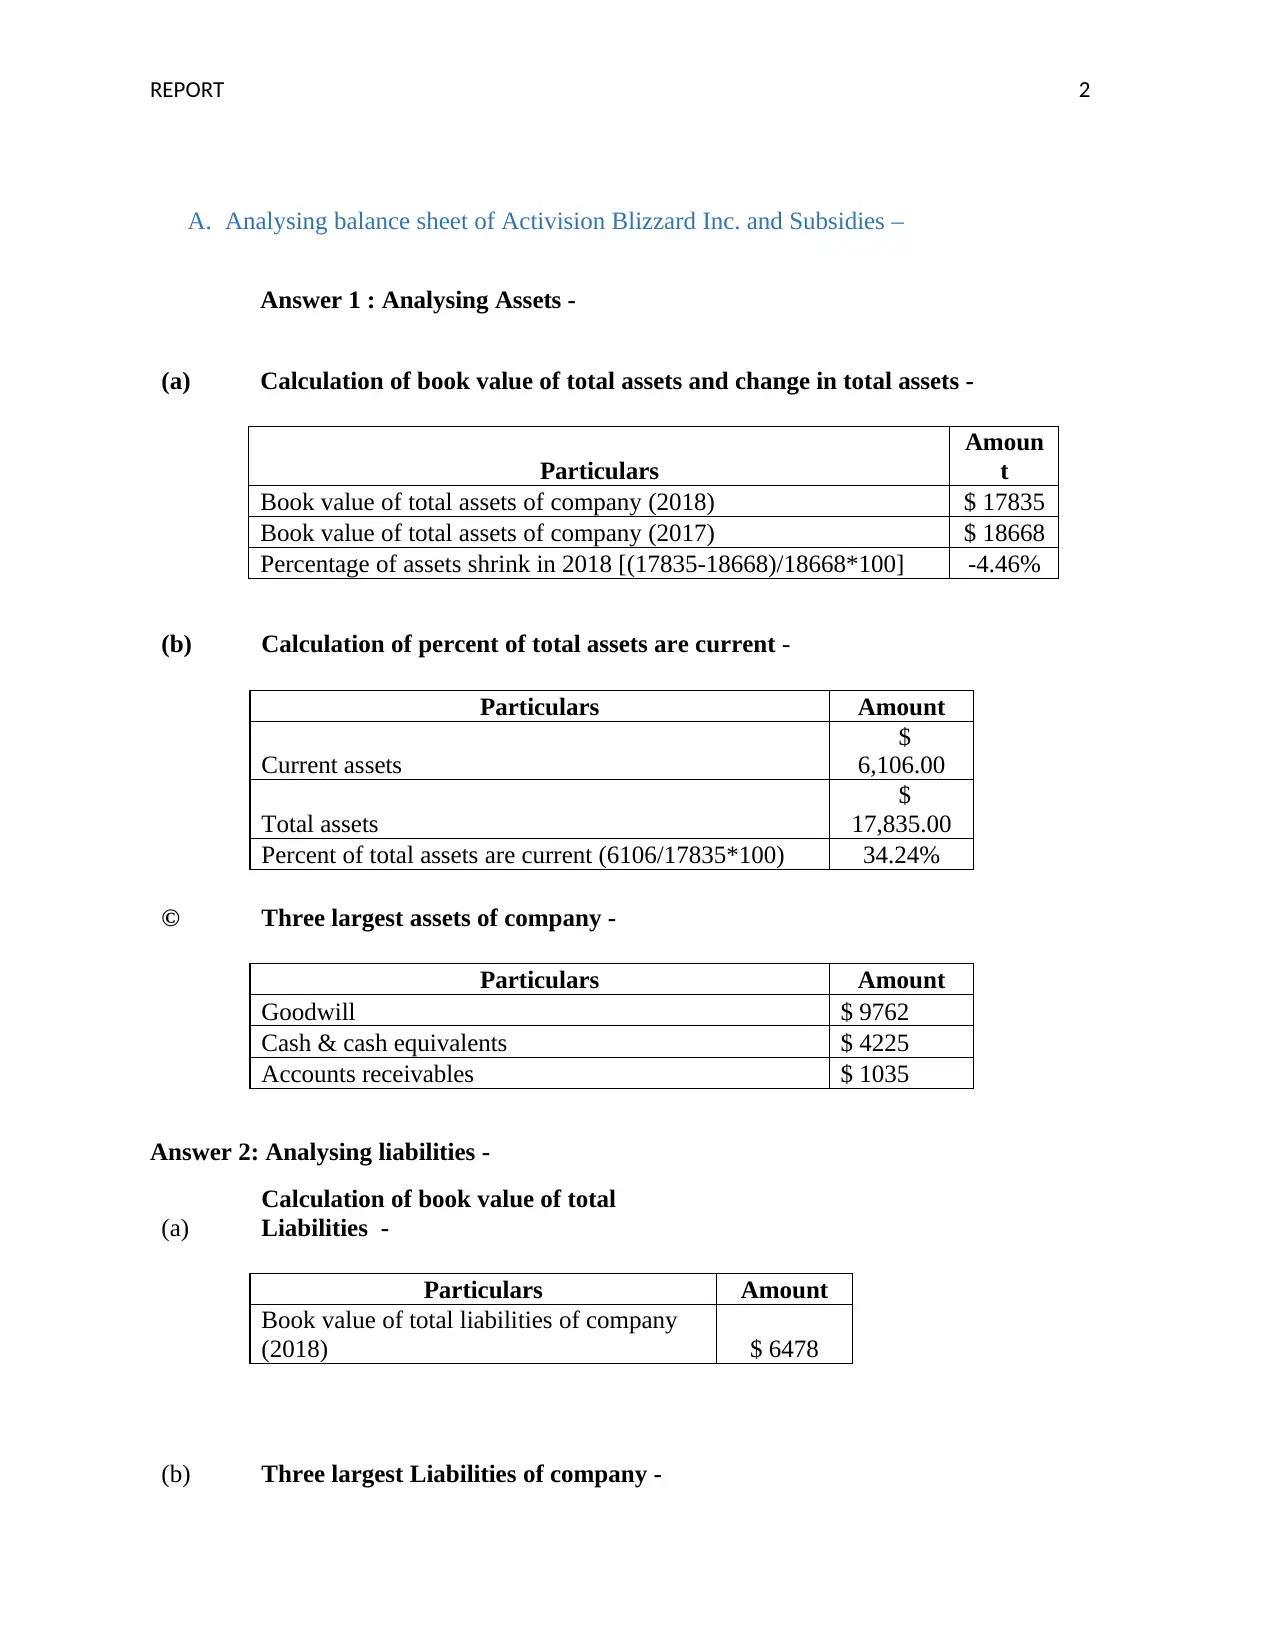
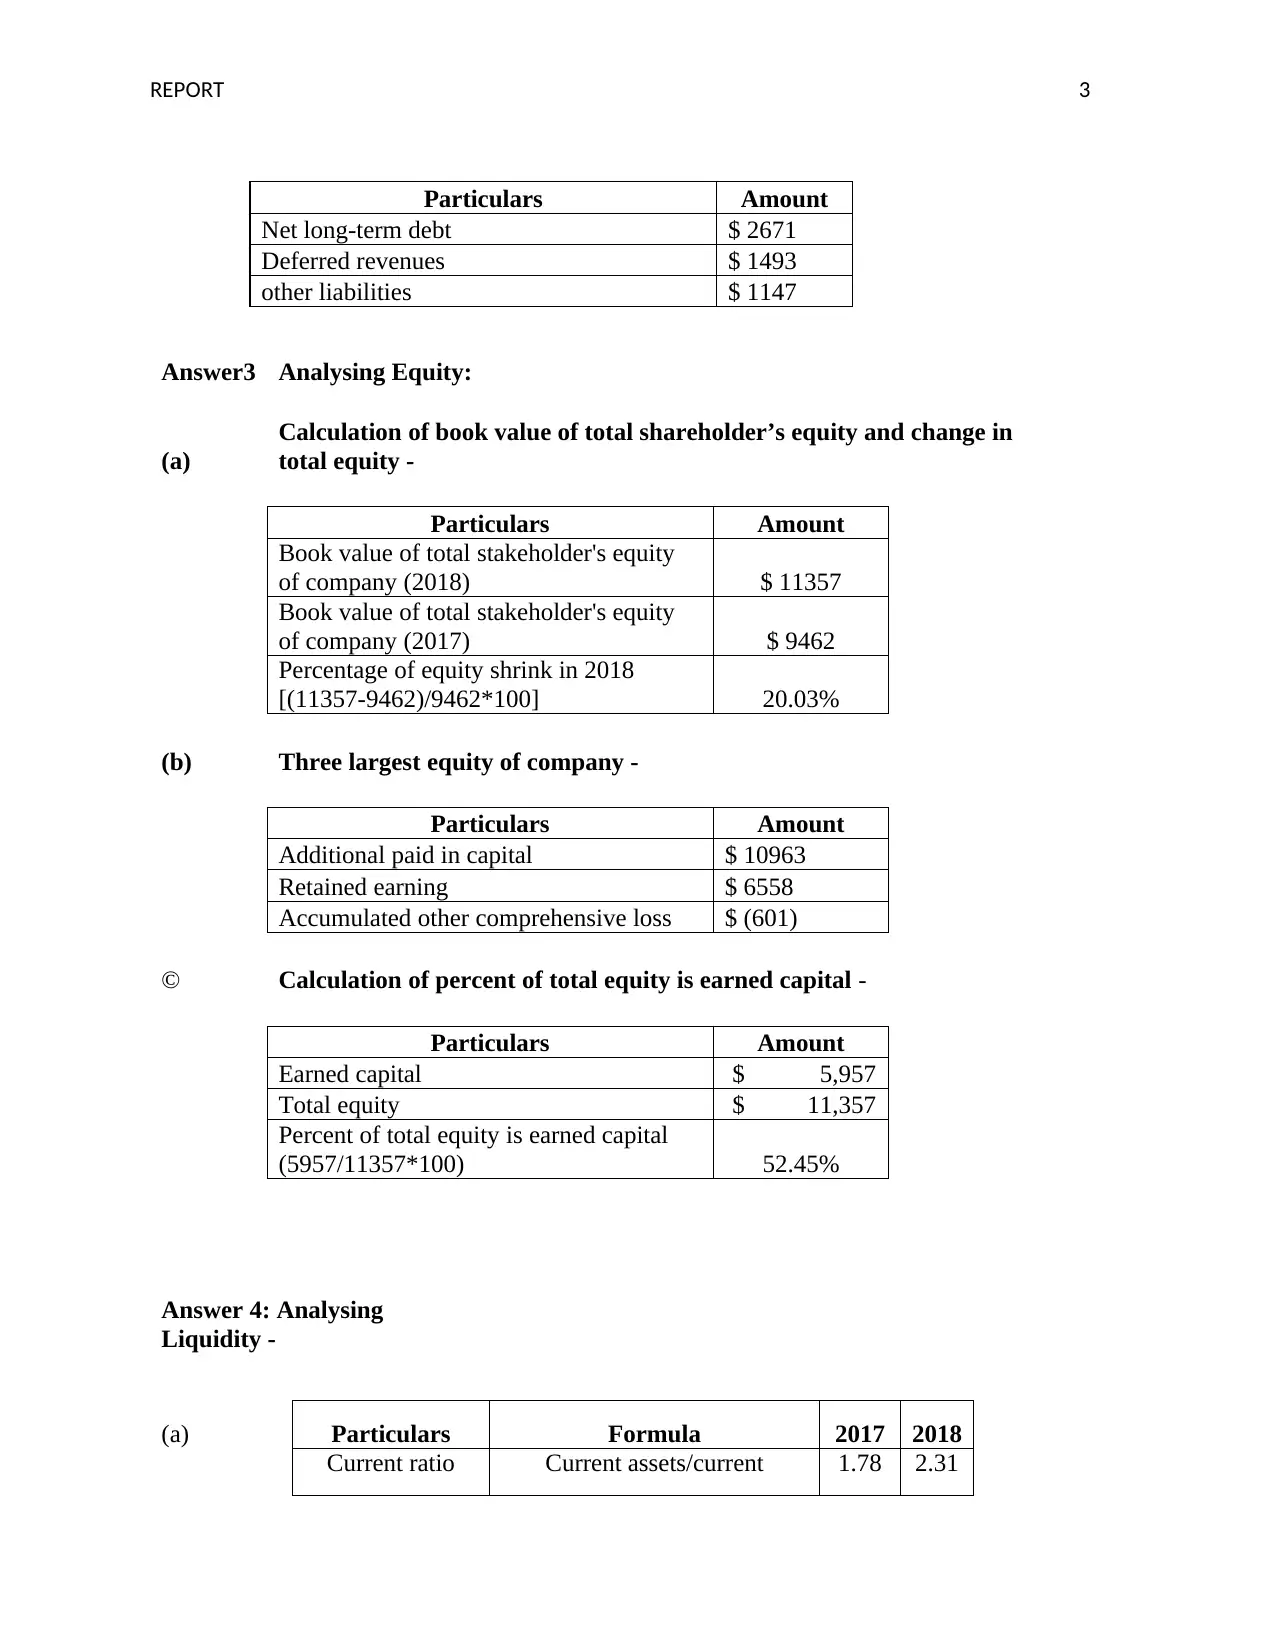
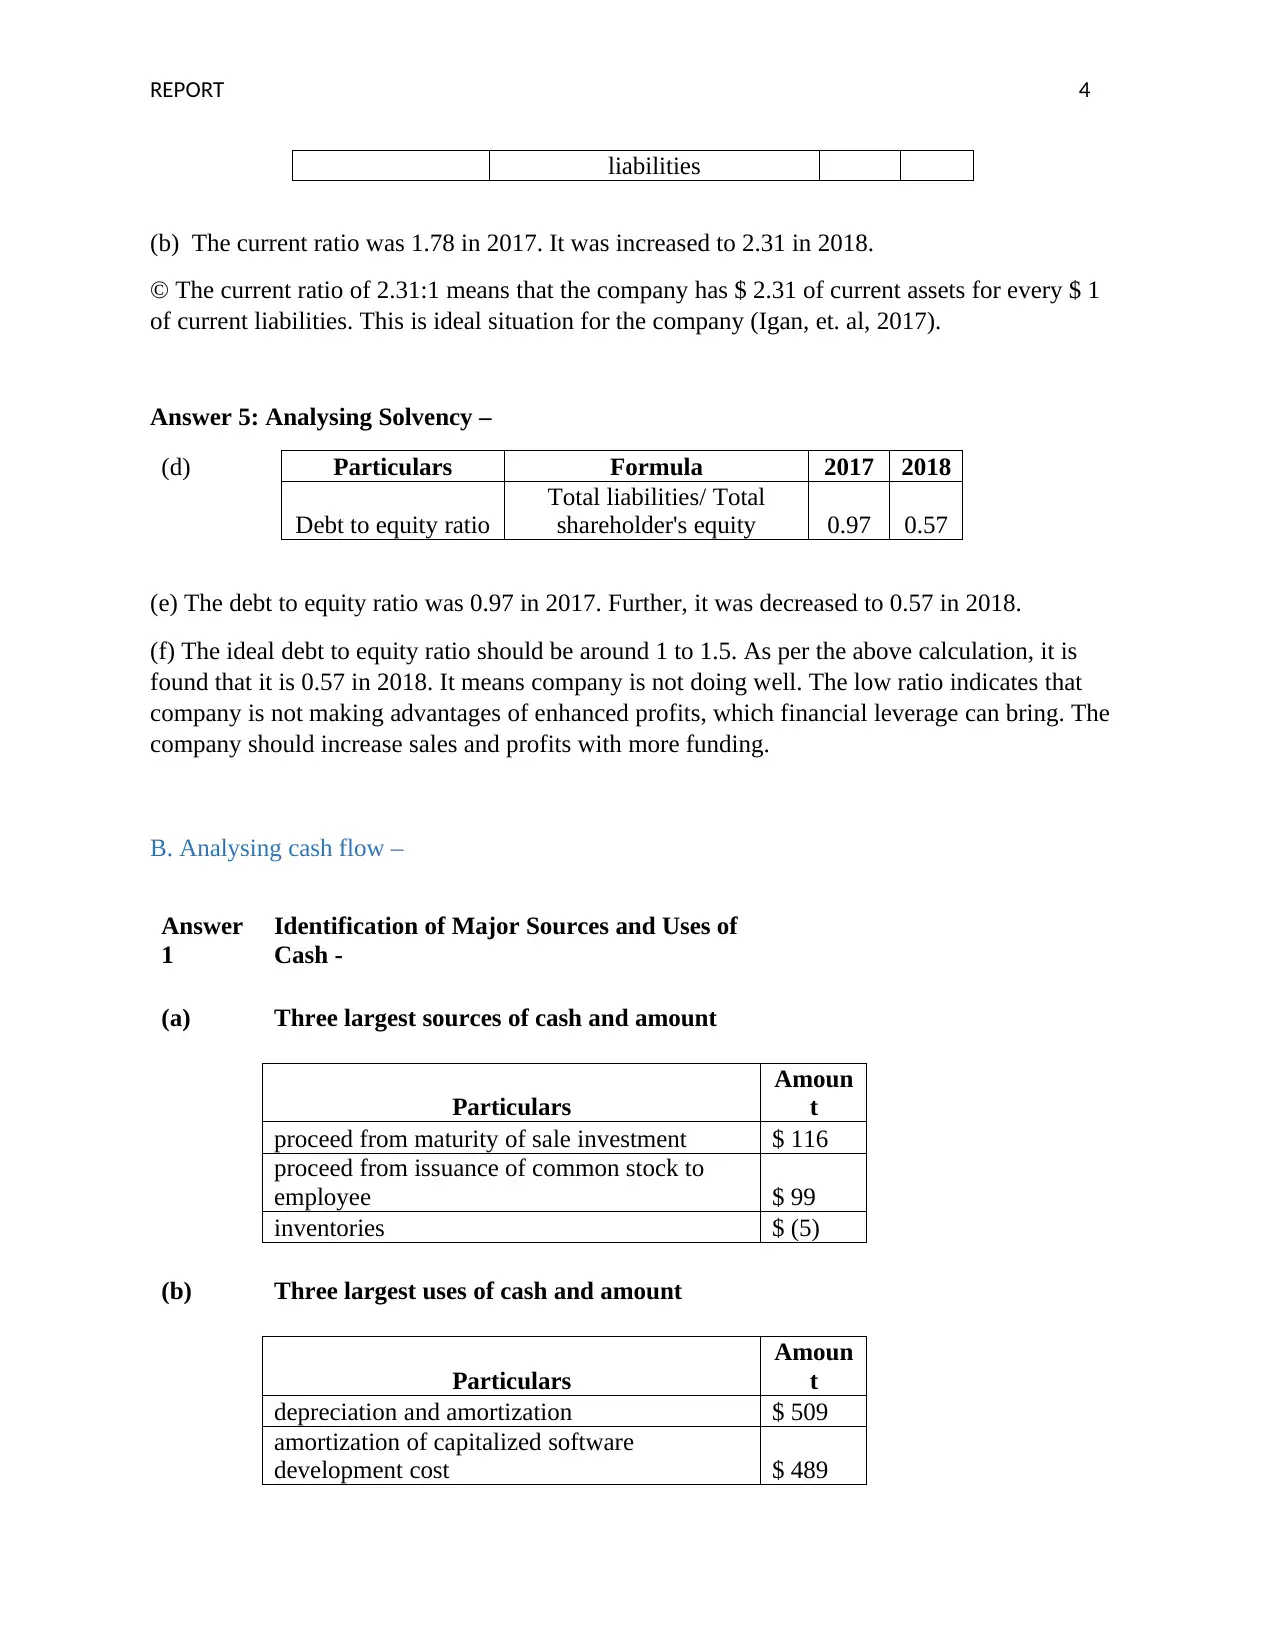
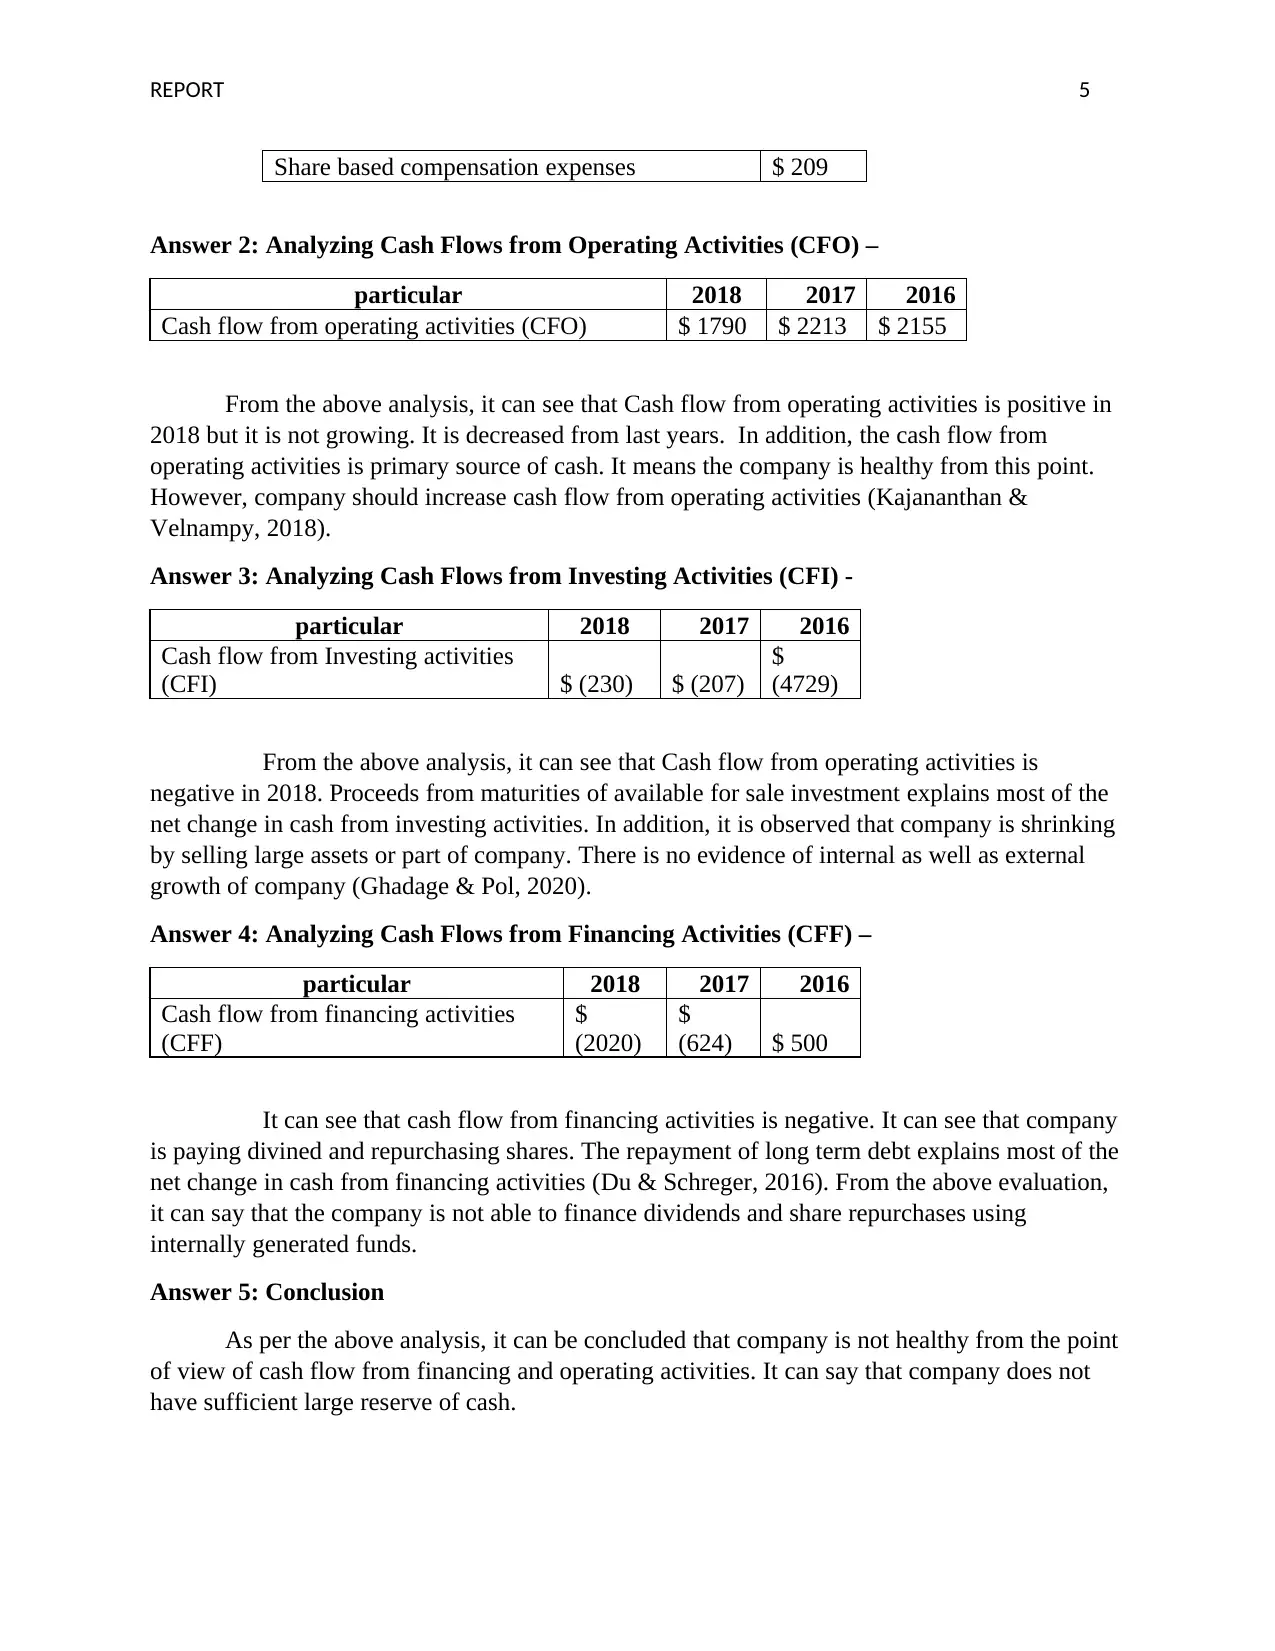
This report presents a financial analysis of Activision Blizzard Inc., evaluating its balance sheet and cash flow statements. The analysis begins with an examination of the company's assets, including their book value, growth, current asset percentage, and three largest assets. It then proceeds to analyze liabilities, detailing their book value and the three largest liabilities. The report further investigates equity, calculating its book value, growth, and the percentage of earned capital. Liquidity and solvency are assessed using the current and debt-to-equity ratios. The second part of the report focuses on cash flow, identifying major sources and uses of cash, and analyzing cash flows from operating, investing, and financing activities. The report concludes with an overall assessment of the company's financial health based on these analyses.
Document Page
Running head: REPORT 0
Accounting financial analysis report
FEBRUARY 16, 2020
STUDENT DETAILS:
tabler-icon-diamond-filled.svg

Paraphrase This Document

Need a fresh take? Get an instant paraphrase of this document with our AI Paraphraser
Document Page
REPORT 1
Contents
A. Analysing balance sheet of Activision Blizzard Inc. and Subsidies –.....................................2
B. Analysing cash flow –.................................................................................................................4
References........................................................................................................................................6
Document Page
REPORT 2
A. Analysing balance sheet of Activision Blizzard Inc. and Subsidies –
Answer 1 : Analysing Assets -
(a) Calculation of book value of total assets and change in total assets -
Particulars
Amoun
t
Book value of total assets of company (2018) $ 17835
Book value of total assets of company (2017) $ 18668
Percentage of assets shrink in 2018 [(17835-18668)/18668*100] -4.46%
(b) Calculation of percent of total assets are current -
Particulars Amount
Current assets
$
6,106.00
Total assets
$
17,835.00
Percent of total assets are current (6106/17835*100) 34.24%
© Three largest assets of company -
Particulars Amount
Goodwill $ 9762
Cash & cash equivalents $ 4225
Accounts receivables $ 1035
Answer 2: Analysing liabilities -
(a)
Calculation of book value of total
Liabilities -
Particulars Amount
Book value of total liabilities of company
(2018) $ 6478
(b) Three largest Liabilities of company -
Document Page
REPORT 3
Particulars Amount
Net long-term debt $ 2671
Deferred revenues $ 1493
other liabilities $ 1147
Answer3 Analysing Equity:
(a)
Calculation of book value of total shareholder’s equity and change in
total equity -
Particulars Amount
Book value of total stakeholder's equity
of company (2018) $ 11357
Book value of total stakeholder's equity
of company (2017) $ 9462
Percentage of equity shrink in 2018
[(11357-9462)/9462*100] 20.03%
(b) Three largest equity of company -
Particulars Amount
Additional paid in capital $ 10963
Retained earning $ 6558
Accumulated other comprehensive loss $ (601)
© Calculation of percent of total equity is earned capital -
Particulars Amount
Earned capital $ 5,957
Total equity $ 11,357
Percent of total equity is earned capital
(5957/11357*100) 52.45%
Answer 4: Analysing
Liquidity -
(a) Particulars Formula 2017 2018
Current ratio Current assets/current 1.78 2.31
tabler-icon-diamond-filled.svg

Paraphrase This Document

Need a fresh take? Get an instant paraphrase of this document with our AI Paraphraser
Document Page
REPORT 4
liabilities
(b) The current ratio was 1.78 in 2017. It was increased to 2.31 in 2018.
© The current ratio of 2.31:1 means that the company has $ 2.31 of current assets for every $ 1
of current liabilities. This is ideal situation for the company (Igan, et. al, 2017).
Answer 5: Analysing Solvency –
(d) Particulars Formula 2017 2018
Debt to equity ratio
Total liabilities/ Total
shareholder's equity 0.97 0.57
(e) The debt to equity ratio was 0.97 in 2017. Further, it was decreased to 0.57 in 2018.
(f) The ideal debt to equity ratio should be around 1 to 1.5. As per the above calculation, it is
found that it is 0.57 in 2018. It means company is not doing well. The low ratio indicates that
company is not making advantages of enhanced profits, which financial leverage can bring. The
company should increase sales and profits with more funding.
B. Analysing cash flow –
Answer
1
Identification of Major Sources and Uses of
Cash -
(a) Three largest sources of cash and amount
Particulars
Amoun
t
proceed from maturity of sale investment $ 116
proceed from issuance of common stock to
employee $ 99
inventories $ (5)
(b) Three largest uses of cash and amount
Particulars
Amoun
t
depreciation and amortization $ 509
amortization of capitalized software
development cost $ 489
Document Page
REPORT 5
Share based compensation expenses $ 209
Answer 2: Analyzing Cash Flows from Operating Activities (CFO) –
particular 2018 2017 2016
Cash flow from operating activities (CFO) $ 1790 $ 2213 $ 2155
From the above analysis, it can see that Cash flow from operating activities is positive in
2018 but it is not growing. It is decreased from last years. In addition, the cash flow from
operating activities is primary source of cash. It means the company is healthy from this point.
However, company should increase cash flow from operating activities (Kajananthan &
Velnampy, 2018).
Answer 3: Analyzing Cash Flows from Investing Activities (CFI) -
particular 2018 2017 2016
Cash flow from Investing activities
(CFI) $ (230) $ (207)
$
(4729)
From the above analysis, it can see that Cash flow from operating activities is
negative in 2018. Proceeds from maturities of available for sale investment explains most of the
net change in cash from investing activities. In addition, it is observed that company is shrinking
by selling large assets or part of company. There is no evidence of internal as well as external
growth of company (Ghadage & Pol, 2020).
Answer 4: Analyzing Cash Flows from Financing Activities (CFF) –
particular 2018 2017 2016
Cash flow from financing activities
(CFF)
$
(2020)
$
(624) $ 500
It can see that cash flow from financing activities is negative. It can see that company
is paying divined and repurchasing shares. The repayment of long term debt explains most of the
net change in cash from financing activities (Du & Schreger, 2016). From the above evaluation,
it can say that the company is not able to finance dividends and share repurchases using
internally generated funds.
Answer 5: Conclusion
As per the above analysis, it can be concluded that company is not healthy from the point
of view of cash flow from financing and operating activities. It can say that company does not
have sufficient large reserve of cash.
Document Page
REPORT 6
References
Du, W., & Schreger, J. (2016). Sovereign risk, currency risk, and corporate balance
sheets. Harvard Business School BGIE Unit Working Paper, (17-024).
Ghadage, A., & Pol, A. (2020). Analysis of Relationship between Free Cash Flow to Equity and
Non-Cash Working Capital of Bajaj Auto Ltd., Pune. Our Heritage, 68(30), 1054-1064.
Igan, D., Kabundi, A., De Simone, F. N., & Tamirisa, N. (2017). Monetary policy and balance
sheets. Journal of Policy Modeling, 39(1), 169-184.
Kajananthan, R., & Velnampy, T. (2018). Liquidity, Solvency and Profitability Analysis Using
Cash Flow Ratios and Traditional Ratios: The Telecommunication Sector in Sri
Lanka. Research Journal of Finance and Accounting, 5(23).
chevron_up_icon
1 out of 7
circle_padding
hide_on_mobile
zoom_out_icon
[object Object]