ACC 702 Advanced Management Accounting - Semester 5, 2018 Report
VerifiedAdded on 2023/05/28
|19
|4790
|406
Report
AI Summary
This report provides detailed solutions to an Advanced Management Accounting assignment, focusing on key techniques and concepts. It covers activity-based management (ABM), activity flexible budgeting, quality costs, and Lean accounting. The ABM section explains its connection to continuous improvement and provides a cost-saving analysis for Electronica, Inc. Flexible budgeting is illustrated with a performance report and cost calculations. The report also addresses quality costs, including prevention, appraisal, internal failure, and external failure costs, and discusses Lean accounting principles with practical examples. The solutions use practical examples to correlate theoretical concepts, emphasizing the application of these management accounting tools in real-world scenarios. Desklib offers many resources for students to enhance their understanding of accounting and finance.

Name:
DATE:
ADVANCED MANAGEMENT
ACCOUNTING
DATE:
ADVANCED MANAGEMENT
ACCOUNTING
Paraphrase This Document
Need a fresh take? Get an instant paraphrase of this document with our AI Paraphraser

Executive Summary
There are various Advanced Management Accounting tools or techniques and concepts
available to assist the decision-making process of the Managers. In this section few of those
major techniques naming activity-based management, activity flexible budgeting, quality
costs, Lean accounting have been elaborated with the help of practical examples to assist in
getting an in-depth idea of these concepts. The reason behind providing the practical solution
is to correlate the theoretical concept with the practical one. As it is often seen that the people
are found aware about the theoretical concept, but they lack the practical application. Hence
our key emphasis is on practical solution with the least explanation of the theoretical concept.
1

Table of Content
s
Executive Summary...............................................................................................................................1
Introduction...........................................................................................................................................3
Main Body.............................................................................................................................................3
Applied Business....................................................................................................................................3
Question No 1- Activity Based Management.........................................................................................3
Ans. to Question No. 2...........................................................................................................................4
Ans. to Question No. 3...........................................................................................................................6
Answer to Question No.4......................................................................................................................6
Answer to Question No.5......................................................................................................................7
Question- Two- Activity Flexible Budgeting...........................................................................................8
Activity Flexible budgeting.....................................................................................................................8
Answer to Question No.3....................................................................................................................10
Question No.3- Quality Cost................................................................................................................11
Answer to question No.1.....................................................................................................................11
Answer: to 2........................................................................................................................................14
Answer to Question No.4- Lean Accounting........................................................................................14
Answer to question No.5.....................................................................................................................16
Conclusion...........................................................................................................................................16
References...........................................................................................................................................17
2
⊘ This is a preview!⊘
Do you want full access?
Subscribe today to unlock all pages.
Trusted by 1+ million students worldwide

Introduction
Decision-making is a continuous process in which managers must engage daily. Advanced
Management Accounting is the application of mathematical and accounting technique of
analysis to assist the process of decision making. But the application of such techniques
demands the knowledge of the various concepts to make the use of such techniques, hence an
attempt has been made to discuss few of those concepts like activity-based management,
activity flexible budgeting, quality costs, Lean Accounting with the help of practical solution
(Awasthi, Omrani, & Gerber, 2018).
Main Body
Applied Business
Question No 1- Activity Based Management
In day to day decision making it is often told that one of the important functions of the
manager should be to control the costs without having any realistic approach to achieve it. It
is the concept of activity-based management which provides the platform for the same. as it
clearly establishes the link between the costs and activity associated with such cost.
Meaning of Activity-based Management
It is a systematic and integrated approach of managerial decision making by using the tool of
activity-based costing to carry out the re-engineering initiative or value chain analysis with a
view to improving the quality of the strategic and operational decision-making. It is based on
the two basic premises that activities are being consumed by the products and the resources
are being consumed by the activities, hence if it is being intended that the product should be
the competitive one in the market, then the knowledge of those activities which produce the
products and services and the cost of those activities are required. At the same time, the
reduction of the cost of products or services demands the change in those activities
(Bennouna, Meredith, & Marchant, 2010).
ABM primarily is focussed on establishing a direct relationship between the activities and the
costs associated with hose activities for which the ABM is divided into a set of activities then
each of such activities are analysed using the tools of Cost benefit analysis. It is the measure
to control the activities of the organisation. After analysis of the activities if any of the
activities are found expensive, then an attempt is made either to increase the level of
3
Paraphrase This Document
Need a fresh take? Get an instant paraphrase of this document with our AI Paraphraser
efficiency of such activity and if not possible then the elimination of such activity is opted
for.
One of the important aspect on which the premise of the activity-based management is based
that it is aimed at establishing the accountability on the activities not on its costs. Because
costs are the results of the activities, hence control over the costs shall be possible only when
there is control over those activities (Boghossian, 2017).
The Connection of ABM with the continuous improvement
Before knowing how the ABM contributes to the Continuous improvement, it is must to
know how the continuous improvement is achieved. It consists of a five-step process, i.e.,
Identification of opportunities of the environment, Identification of root causes, identification
of possible solution, implementation of the best solution and finally monitoring the result of
the solution.
These steps are linked with the ABM, the first step is performed by classifying the activities
between primary and secondary activities so that the resource utilisation can be accordingly
divided between the two types of activities identified, then the next step is to identify the
possible root causes such activities, then the possible solutions to such activities are
identified following the implementation of the best solution and finally the monitoring of the
performance of the result of the best solution implemented so that the possibility of further
improvement can be decided and this process keeps on going in the ABM (Bouret, 2017).
To carry out the process of the continuous improvement, the first step being taken is the
classification of the activities into the following matrixes, which are essential and value-
added activity, essential and non-value-added activity, Non-essential and value-added
activities and finally the non-essential cum non-value-added activity. The major focus for
elimination is given to the non-essential and non-value-added activities and those non-
essential but value adding activities are also planned to be eliminated through the tool of
redesigning the product or the process or committing towards the reengineering. Again, as a
measure for improvement the activities which are though essential but non-value adding
activities, an attempt should be made to minimise such activities to the maximum possible
extent. There should be the continuous effort to be made to increase the number of those
activities which are essential and value adding activities (Carolus, Hanley, Olsen, &
Pedersen, 2018).
Ans. to Question No. 2
Non-value-added costs are those costs which contribute towards the cost addition, but they
don’t add any value to the product or service. In this case the major non-value-added costs
are as under: Non-value-added activities can again be of two types one being essential but
non-value-added activity and the other being the non-essential and non-value-added activity
Name of the Activity Amount ($)
4

1. Batch-level Activity
a. Setting-up equipment 1,87,500
b. Material handling 2,70,000
c. Inspecting products 1,83,000
2. Product-sustaining activities
a. Handling customer complaints 1,50,000
b. Filling Warranties 2,55,000
c. Storing Goods 1,20,000
d. Expediting Goods 1,12,500
Total Value-added cost 12, 78,000
Computation of the cost of savings per unit if the non-value-added activities are eliminated
=Total Non-value-added cost/Number of unites produced
=$12, 78,000/120000Units
=$10.65 per unit
Working Note:
Computation of the Number of the units produced
=Total Cost of the product/Unit cost of the product
=$2880000/$24
=120000 units
Yes, Inc the given case Dhobi was correct who said that as per his preliminary assessment for
cost reduction at least $10.50 per unit can be made.
Actions that the Electronica Inch can take to eliminate the non-value-added activities are
summarised hereunder:
1. At first there should establish the system in place to identify the non-value-added
activities within the company.
2. It should establish the mechanism to for the improvement in its performance
measurement system.
3. After identification of these non-value-added activities the organisation needs to see
which of these activities are best controlled by the organisation.
5
⊘ This is a preview!⊘
Do you want full access?
Subscribe today to unlock all pages.
Trusted by 1+ million students worldwide

4. Then it is to be decided whether those non-value-added activities on which the
organisation has the sufficient control should be eliminated or it should be streamlined
or if possible simplified.
5. Compute the percentage of the total non-value-added cost on the total cost.
6. Elimination of the waiting time though the proper schedule preparation for the
relevant job.
7. Attempt should be made to minimise the moving time.
Ans. to Question No. 3
Computation of the Target cost Per Unit
Target selling price - $27
Less: Target profit per Unit - $6
Target Cost - $21
The required cost reduction = $24-$21
=$3 per unit
Computation of the Target cost to achieve the target of the expanding the market share by
50%
Target Selling price per unit -$18
Less: Target profit per unit - $6
Target cost per unit $11
Cost reduction per unit=$24-$11
=$13 per unit.
Answer to Question No.4
Computation of the total potential Cost reduction per unit
Total possible cost reduction already suggested by Dhobi = $10.50 per unit
Total amount of additional cost reduction =$90,000+$135000
6
Paraphrase This Document
Need a fresh take? Get an instant paraphrase of this document with our AI Paraphraser

=$225000
Additional cost reduction per unit =Total additional cost to be reduced/ No of units
=$225000/120000
=$1.88 per unit
Hence total potential cost reduction per unit = $10.50+$1.88
=$12.38 per unit
Yes, with this much reduction of cost the company can achieve its current sales, but to
increase it by 50% is not possible through this potential reduction as calculated above.
The form of activity analysis under kaizen approach adopted in this case is selection.
Answer to Question No.5
Calculation of Current income on current sales, prices and costs
Current Sales = $27*120000
=$32,40, 000
Current Cost= $28,80,000
Current Income =$32,40, 000-$28,80,000
=$360000
Calculation of Income if the price charged is Rs.21
Sales =21*120000
=$25,20,0000
Total Possible Cost Reduction = $3+$1.88
=$4.88
Total target cost per unit = $24-$4.88
=$20.12
Income = ($21-$20.12) *120000
=$105600
Income in case the price charged is $18 per unit
Total possible reduction per unit = $13+$1.88
7

=$14.88 per unit
Target cost per unit = $24-$14.88
=$9.12 per unit
Income= ($18-$9.12) *180000
=$15,98,400
It is better to select the target price of $18 per unit as the income in this case is the highest.
Question- Two- Activity Flexible Budgeting
Activity Flexible budgeting
It is one of those techniques of budgeting under which each of the elements of the costs as
presented through the budget is directly linked with the cost driver associated with it. It is
because the cost driver decided the demand of resources by a specific activity. It is more
dynamic and practical in nature (Cayon, Thorp, & Wu, 2017).
1. Performance report of the Millrun’s manufacturing cost
Actual (For 60 batches) As per Budget (for sixty
batches)
Remarks
Direct Material=$220000 =$240000 Within budget
Direct Labour =$177500 =$160000 $17500 (Overspent)
Depreciation=$50000 =$50000 Within budget
Maintaining
equipment=$212500
=$217500 Within the budget and less
spent
Machining=$71000 =$68500 $2500(overspent)
Moving material=$116250 =$120000 Within the budget
Inspecting good=80000 =$60000 $20000(overspent)
From the above analysis it is quite evident that in most of the cases Millrun met the standard
set by its budget for the elements of cost in terms of material, maintaining equipment and
material moving, but failed to meet the budgeting standard in terms of labour cost, inspection
cost and machining cost. The remarks columns of the above table clearly reflect that the
amount of Direct labour overspent was $17500 and that of the Machining is of $2500 and
finally on the inspection of the Goods it is $20000 (Dan, 1995).
8
⊘ This is a preview!⊘
Do you want full access?
Subscribe today to unlock all pages.
Trusted by 1+ million students worldwide

Working Notes:
In the given case it has been assumed that the depreciation is a fixed expenditure having no
relation with the direct labour hour
Calculation of the variable and fixed cost using the High-Low method
Variable Cost per unit = DM cost at the highest level of activity-DM cost at the lowest level
of activity/Highest level of activity-lowest level of activity
Direct material cost per unit= $300000-$150000/25000
=$6 per direct labour hour
Total direct material cost =$6*40000
=$24000.
Direct labour per unit =$200000-$100000/25000
=$4 per direct labour hour
Total direct labour cost = $4*40000
=$160000
Maintaining equipment cost =$255000-$180000/50000
=$1.5 per machine hour
Machining cost per unit =$81000-$56000/50000
=$.5 per machine hour
Moving materials cost per unit =$145000-$82500/10000
=$6.25 per move
Inspecting products per unit = $112500-$62500/50
=$1000 per batch
Fixed Maintaining equipment expenditure=$255000-150000*$1.5
=$30000
Fixed machining expenses=$81000-150000*$.5
=$60000
Moving material fixed expenses =$145000-20000*6.25
=$20000
Inspecting product fixed expenses=$112500-100*1000
=$12500
Answer No.2
Calculation of cost per unit of 5000 units of products
Statement of cost of the product
9
Paraphrase This Document
Need a fresh take? Get an instant paraphrase of this document with our AI Paraphraser

(Figures in $)
Direct Material (5000*6) $30000
Direct Labour ($5000*4) $20000
Maintaining equipment cost $11250
(7500*$1.5)
Machining $3750
(7500*$.5)
Material moves $1562.50
(250*$6.25)
Total cost $66562.50
Cost per unit = $66562.5/5000
=$13.31 per unit
Working:
Machine equipment maintenance cost per machine hour=$ 250000-$180000/150000-100000
=$1.5 per machine hour
Machining cost per machine hour = $81000-$56000/50000
=$.5machine per hour
Moving Materials=$145000-$82500/20000-10000
=$6.25per move
Answer to Question No.3
Statement of the expanded Flexible Budget
Particulars Level of activity Level of activity
Driver: Direct labour hours 25000 50000
Direct Material $150000 $300000
Direct labour $100000 $200000
Depreciation $50000 $50000
Subtotal $300000 $350000
Driver: Machine hour 100000 150000
Maintaining equipment $180000 $255000
Machining $56000 $81000
Subtotal $236000 $336000
10
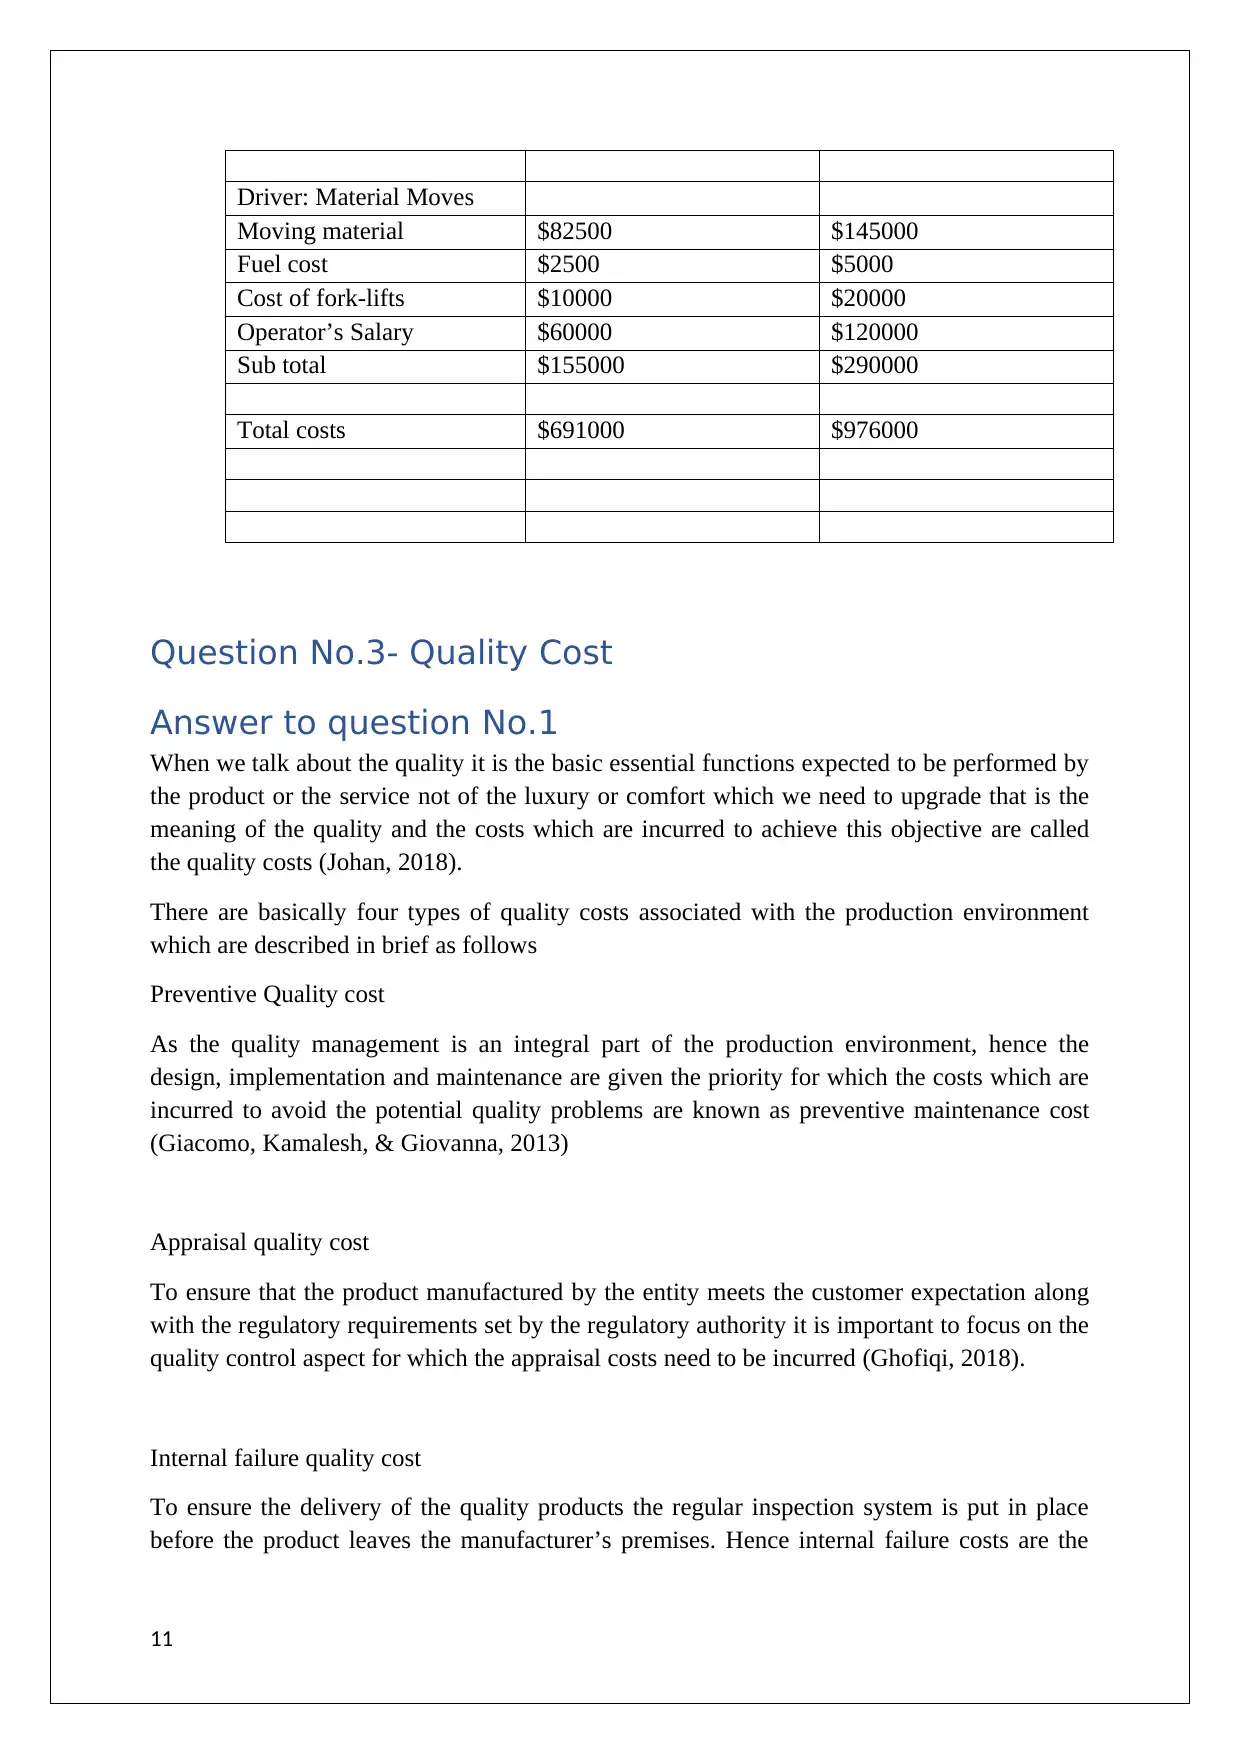
Driver: Material Moves
Moving material $82500 $145000
Fuel cost $2500 $5000
Cost of fork-lifts $10000 $20000
Operator’s Salary $60000 $120000
Sub total $155000 $290000
Total costs $691000 $976000
Question No.3- Quality Cost
Answer to question No.1
When we talk about the quality it is the basic essential functions expected to be performed by
the product or the service not of the luxury or comfort which we need to upgrade that is the
meaning of the quality and the costs which are incurred to achieve this objective are called
the quality costs (Johan, 2018).
There are basically four types of quality costs associated with the production environment
which are described in brief as follows
Preventive Quality cost
As the quality management is an integral part of the production environment, hence the
design, implementation and maintenance are given the priority for which the costs which are
incurred to avoid the potential quality problems are known as preventive maintenance cost
(Giacomo, Kamalesh, & Giovanna, 2013)
Appraisal quality cost
To ensure that the product manufactured by the entity meets the customer expectation along
with the regulatory requirements set by the regulatory authority it is important to focus on the
quality control aspect for which the appraisal costs need to be incurred (Ghofiqi, 2018).
Internal failure quality cost
To ensure the delivery of the quality products the regular inspection system is put in place
before the product leaves the manufacturer’s premises. Hence internal failure costs are the
11
⊘ This is a preview!⊘
Do you want full access?
Subscribe today to unlock all pages.
Trusted by 1+ million students worldwide
1 out of 19
Related Documents


Your All-in-One AI-Powered Toolkit for Academic Success.
+13062052269
info@desklib.com
Available 24*7 on WhatsApp / Email
![[object Object]](/_next/static/media/star-bottom.7253800d.svg)
Unlock your academic potential
Copyright © 2020–2026 A2Z Services. All Rights Reserved. Developed and managed by ZUCOL.