Analysis of the AD-AS Model: Aggregate Demand and Supply Dynamics
VerifiedAdded on 2022/12/28
|4
|374
|77
Essay
AI Summary
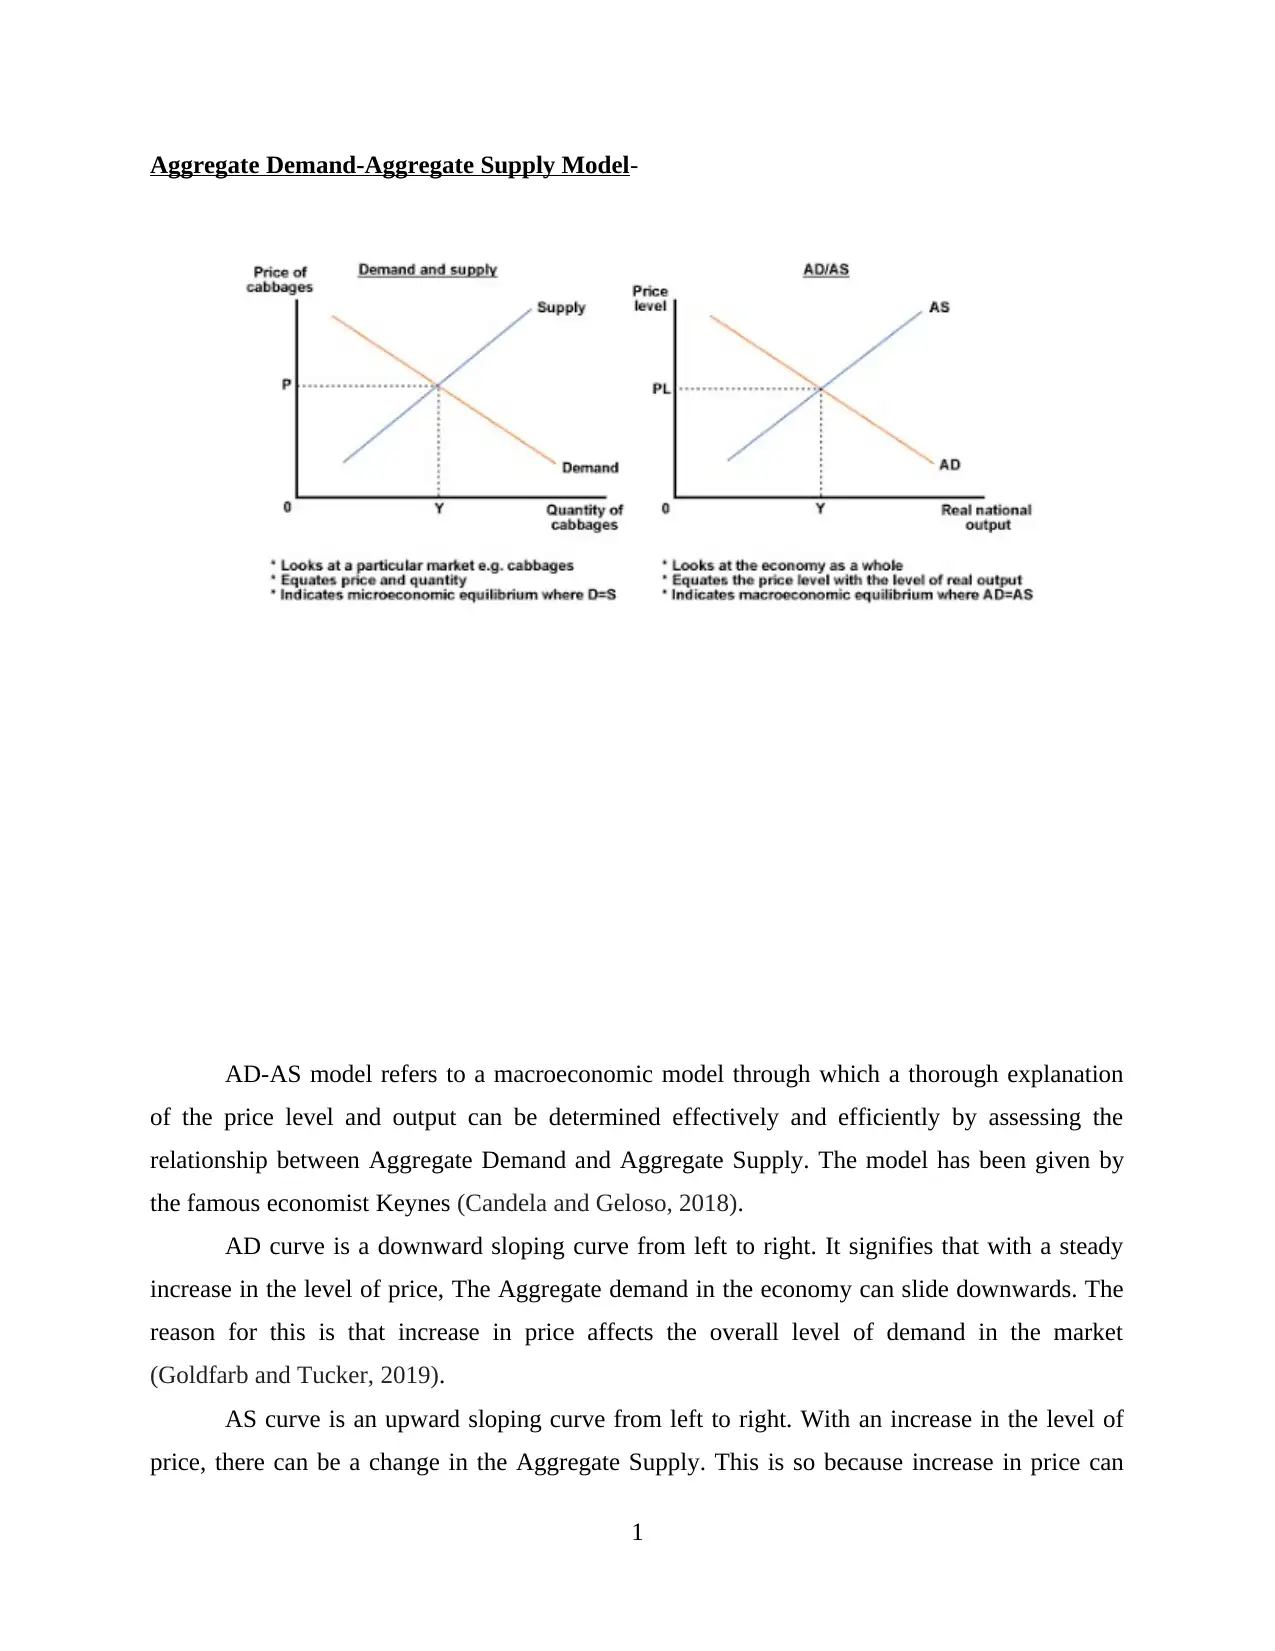
The AD-AS model is a macroeconomic tool used to explain price levels and output by analyzing the relationship between Aggregate Demand (AD) and Aggregate Supply (AS). The AD curve slopes downward, indicating that as prices increase, aggregate demand decreases. The AS curve slopes upward, showing that as prices increase, aggregate supply also increases. The intersection of these curves determines the equilibrium point, which sets the price level. If the equilibrium is on the flatter part of the AS curve, the economy is far from its potential GDP and may experience high unemployment. Conversely, if the equilibrium is on the steeper part, the economy is close to potential GDP with lower unemployment. This model is crucial for understanding how macroeconomic goals can be achieved.

1 out of 4
Related Documents


Your All-in-One AI-Powered Toolkit for Academic Success.
+13062052269
info@desklib.com
Available 24*7 on WhatsApp / Email
![[object Object]](/_next/static/media/star-bottom.7253800d.svg)
Copyright © 2020–2026 A2Z Services. All Rights Reserved. Developed and managed by ZUCOL.