Oz University ADACC Chapter 12 Assignment: Statistical Methods
VerifiedAdded on 2023/01/13
|30
|4898
|78
Homework Assignment
AI Summary
This assignment solution addresses statistical analysis and probability problems from ADACC Chapter 12. It includes calculations and interpretations for a frequency table, mean, median, mode, range, standard deviation, and interquartile range using a provided dataset of accounting graduates' earnings. The solution also covers probability calculations related to pet selection and left-handedness, as well as outlining a random sampling method for a university survey on cafeteria facilities. The student demonstrates understanding of statistical tools and their applications, providing detailed workings and interpretations throughout the solution. The assignment covers key concepts in descriptive statistics and probability, providing a practical application of these concepts within a finance context.
ADACC – Chapter 12
note: It is a requirement for students to make their submissions using this electronic assessment booklet. At the
facilitator’s discretion any submissions made in another format may not be accepted. If you are completing the course via
various computers, please save the one booklet on a USB so you can send the submission in using the one file
Getting Started
Please insert your NAME, DATE and the Manual Version Number on the first page of your Assessment Booklet.
Answering Assessment Questions
Each Assessment Booklet contains blank spaces for following assessment items:
Short Answer Questions
When submitting Assessment Booklets for marking, please ensure that the entire booklet is completed.
Short Answer Questions
Using the space/s provided, please complete your answers making sure to:
Please restrict your answers to no more than 300 words per question
Please include any calculations that you used to reach your answer
Referencing Your Answers
Students undertaking the course must exhibit a range of skills in order to be confirmed as competent in their course. These
skills include:
Understanding a question.
Possessing knowledge about the issue, which in some assessments includes locating information from references.
Providing an answer, this shows personal understanding.
Please make sure that all assessments are documented in a way that exhibits your personal study and/or research. To that
Paraphrase This Document
Need a fresh take? Get an instant paraphrase of this document with our AI Paraphraser
ADACC – Chapter 12
end would you please acknowledge all material and sources used in the presentation of your assessment whether they are
books, articles, reports, Internet searches, or any other document or personal communication. For example if:
An idea is sourced; reference it e.g. (Bagra 2010).
You are directly quoting, wrap it in quote marks e.g. “Tom Horner sat in a corner” (Peters 2007 page 7).
You are quoting from the internet include quote marks and the web reference e.g. “ban on conflicted remuneration
structures including commissions” <http://futureofadvice.treasury.gov.au/content/Content.aspx?
doc=reforms.htm> accessed on the 28th of December 2012.
Please note that no more than 5% of direct quoting which is referenced is deemed to be acceptable and no amount of direct
quoting without referencing is deemed acceptable. Any direct quoting should form only a small portion of any answer and the
answer should demonstrate the student understands and can interpret the question and provide an appropriate answer.
Whilst this will require more work for you I hope you will understand that we are trying to maintain high standards and
support your progression into further qualifications.
Document Naming Instructions:
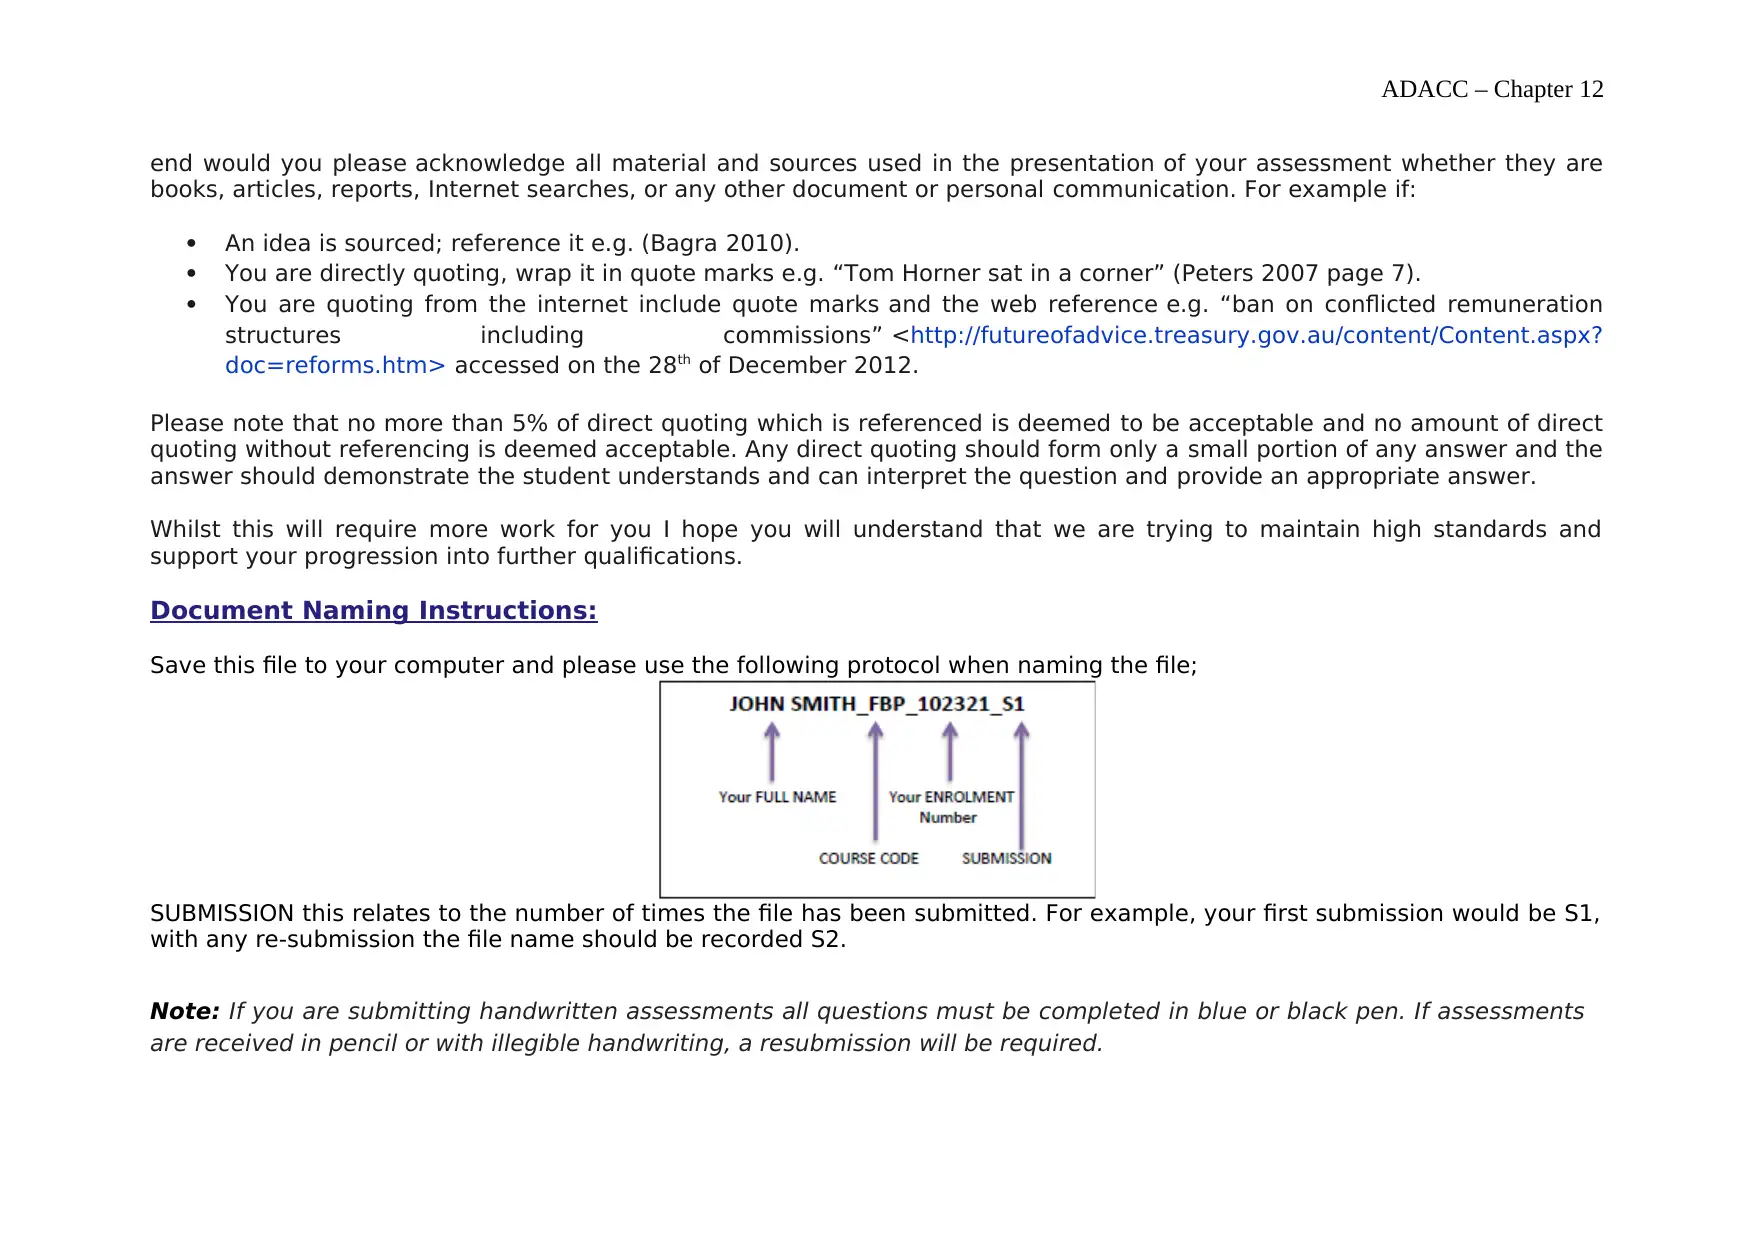
Save this file to your computer and please use the following protocol when naming the file;
SUBMISSION this relates to the number of times the file has been submitted. For example, your first submission would be S1,
with any re-submission the file name should be recorded S2.
Note: If you are submitting handwritten assessments all questions must be completed in blue or black pen. If assessments
are received in pencil or with illegible handwriting, a resubmission will be required.
end would you please acknowledge all material and sources used in the presentation of your assessment whether they are
books, articles, reports, Internet searches, or any other document or personal communication. For example if:
An idea is sourced; reference it e.g. (Bagra 2010).
You are directly quoting, wrap it in quote marks e.g. “Tom Horner sat in a corner” (Peters 2007 page 7).
You are quoting from the internet include quote marks and the web reference e.g. “ban on conflicted remuneration
structures including commissions” <http://futureofadvice.treasury.gov.au/content/Content.aspx?
doc=reforms.htm> accessed on the 28th of December 2012.
Please note that no more than 5% of direct quoting which is referenced is deemed to be acceptable and no amount of direct
quoting without referencing is deemed acceptable. Any direct quoting should form only a small portion of any answer and the
answer should demonstrate the student understands and can interpret the question and provide an appropriate answer.
Whilst this will require more work for you I hope you will understand that we are trying to maintain high standards and
support your progression into further qualifications.
Document Naming Instructions:
Save this file to your computer and please use the following protocol when naming the file;
SUBMISSION this relates to the number of times the file has been submitted. For example, your first submission would be S1,
with any re-submission the file name should be recorded S2.
Note: If you are submitting handwritten assessments all questions must be completed in blue or black pen. If assessments
are received in pencil or with illegible handwriting, a resubmission will be required.
ADACC – Chapter 12
Note: It is your responsibility as a student to keep a copy of all assessment submissions. IIT do not take responsibility for
the loss of any submissions.
Distance Education Students
Note: It is your responsibility as a student to keep a copy of all assessment submissions. IIT do not take responsibility for
the loss of any submissions.
Distance Education Students
⊘ This is a preview!⊘
Do you want full access?
Subscribe today to unlock all pages.
Trusted by 1+ million students worldwide
ADACC – Chapter 12
Student Declaration
I understand that by completing this form I am bound by the following declaration.
To the best of my knowledge and belief, no part of this assignment for the above unit has been
copied from any other student’s work or from any other source except where due
acknowledgment is made in the text, or has been written for me by another person.
Name: Date:
Paraphrase This Document
Need a fresh take? Get an instant paraphrase of this document with our AI Paraphraser
ADACC – Chapter 12
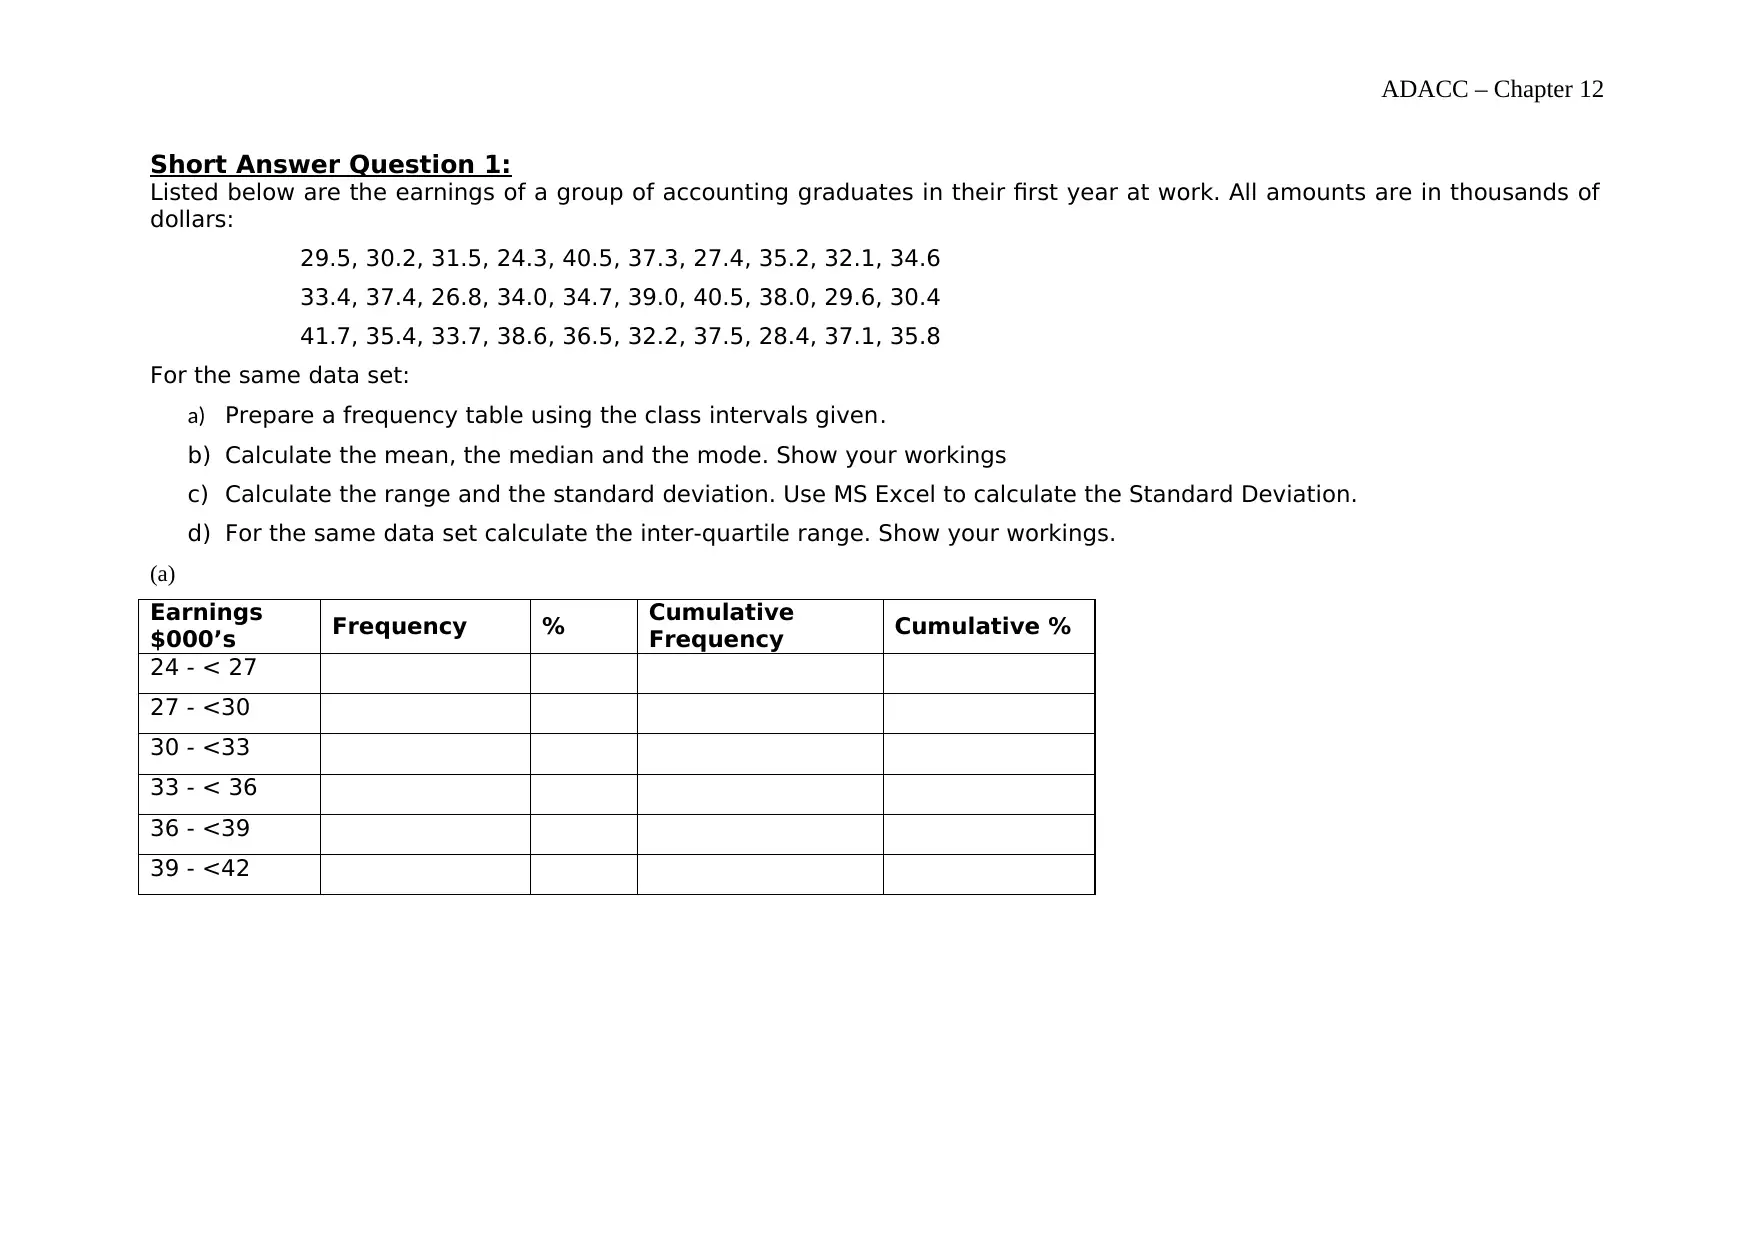
Short Answer Question 1:
Listed below are the earnings of a group of accounting graduates in their first year at work. All amounts are in thousands of
dollars:
29.5, 30.2, 31.5, 24.3, 40.5, 37.3, 27.4, 35.2, 32.1, 34.6
33.4, 37.4, 26.8, 34.0, 34.7, 39.0, 40.5, 38.0, 29.6, 30.4
41.7, 35.4, 33.7, 38.6, 36.5, 32.2, 37.5, 28.4, 37.1, 35.8
For the same data set:
a) Prepare a frequency table using the class intervals given.
b) Calculate the mean, the median and the mode. Show your workings
c) Calculate the range and the standard deviation. Use MS Excel to calculate the Standard Deviation.
d) For the same data set calculate the inter-quartile range. Show your workings.
(a)
Earnings
$000’s Frequency % Cumulative
Frequency Cumulative %
24 - < 27
27 - <30
30 - <33
33 - < 36
36 - <39
39 - <42
ADACC – Chapter 12
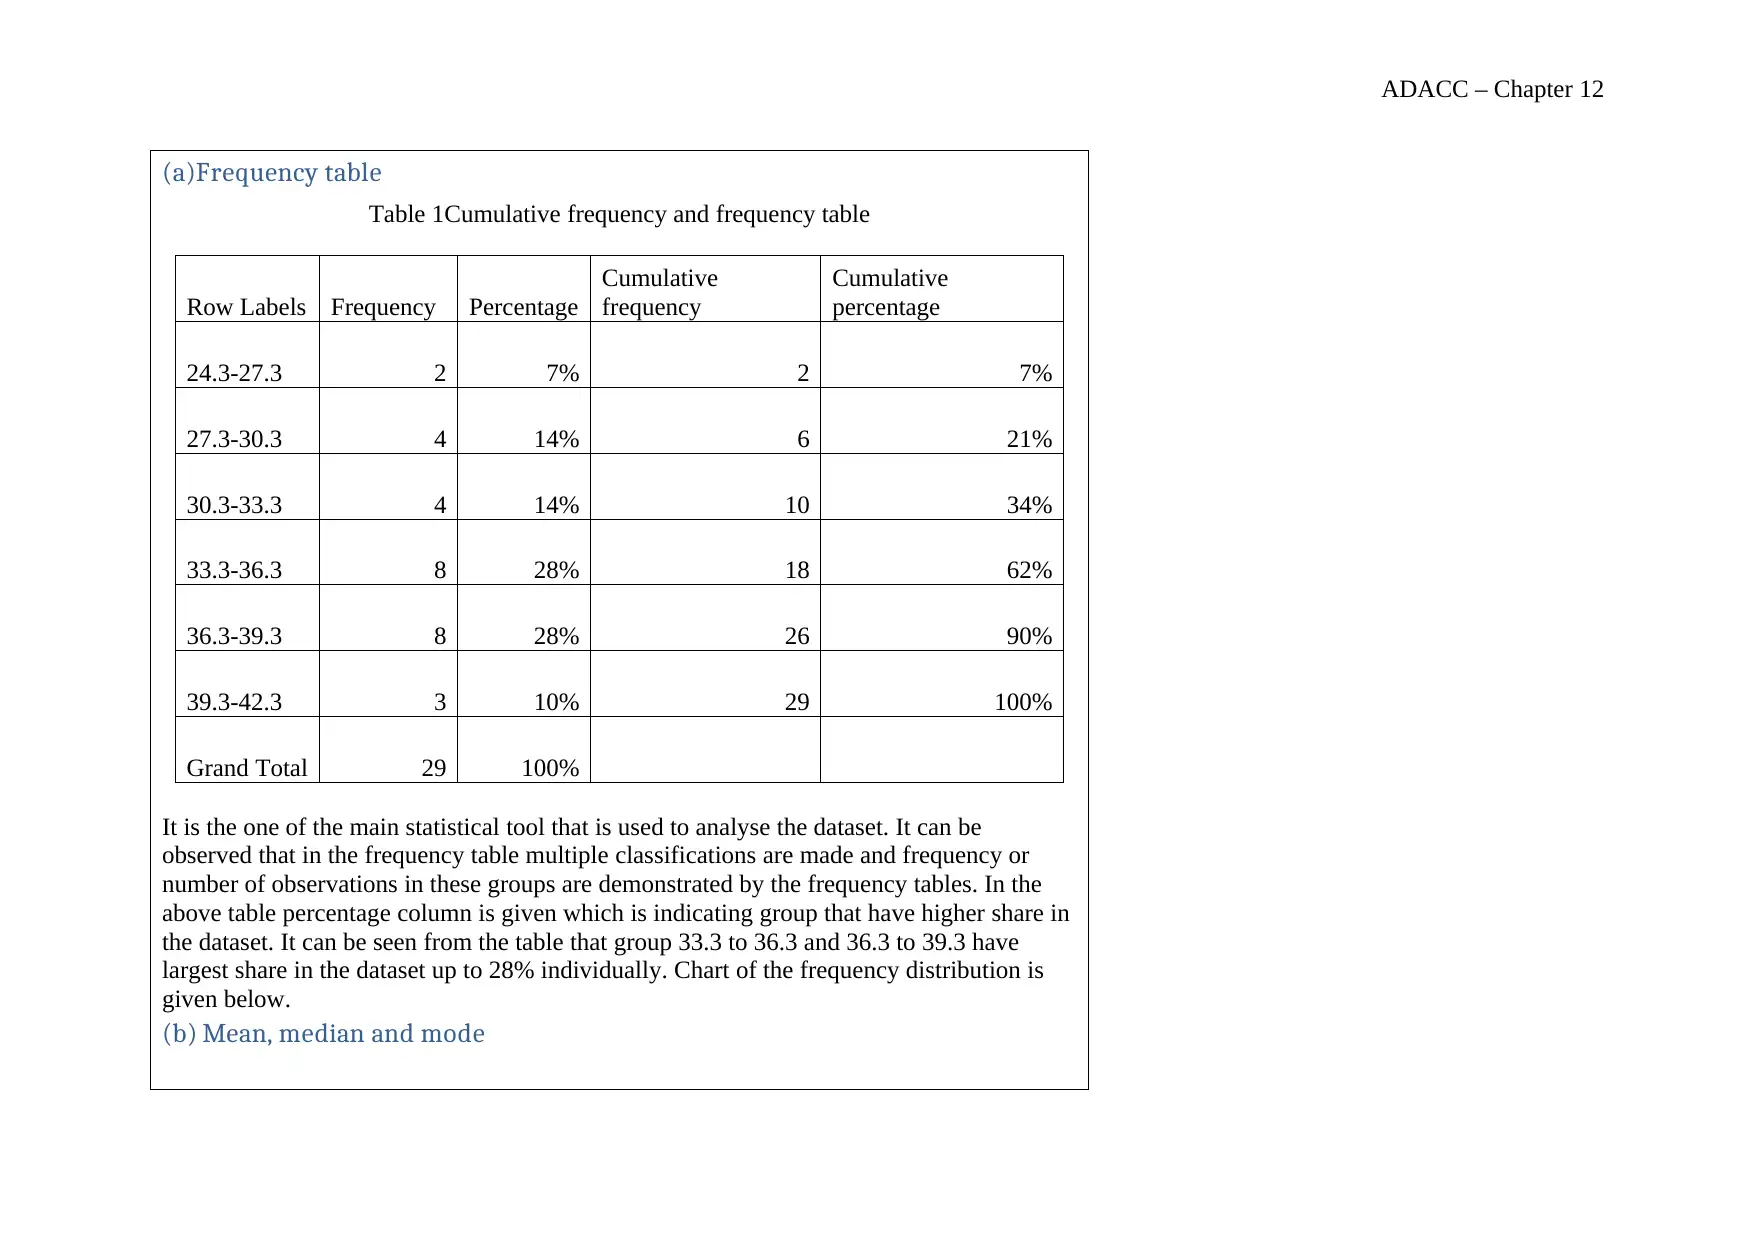
(a)Frequency table
Table 1Cumulative frequency and frequency table
Row Labels Frequency Percentage
Cumulative
frequency
Cumulative
percentage
24.3-27.3 2 7% 2 7%
27.3-30.3 4 14% 6 21%
30.3-33.3 4 14% 10 34%
33.3-36.3 8 28% 18 62%
36.3-39.3 8 28% 26 90%
39.3-42.3 3 10% 29 100%
Grand Total 29 100%
It is the one of the main statistical tool that is used to analyse the dataset. It can be
observed that in the frequency table multiple classifications are made and frequency or
number of observations in these groups are demonstrated by the frequency tables. In the
above table percentage column is given which is indicating group that have higher share in
the dataset. It can be seen from the table that group 33.3 to 36.3 and 36.3 to 39.3 have
largest share in the dataset up to 28% individually. Chart of the frequency distribution is
given below.
(b) Mean, median and mode
⊘ This is a preview!⊘
Do you want full access?
Subscribe today to unlock all pages.
Trusted by 1+ million students worldwide
ADACC – Chapter 12
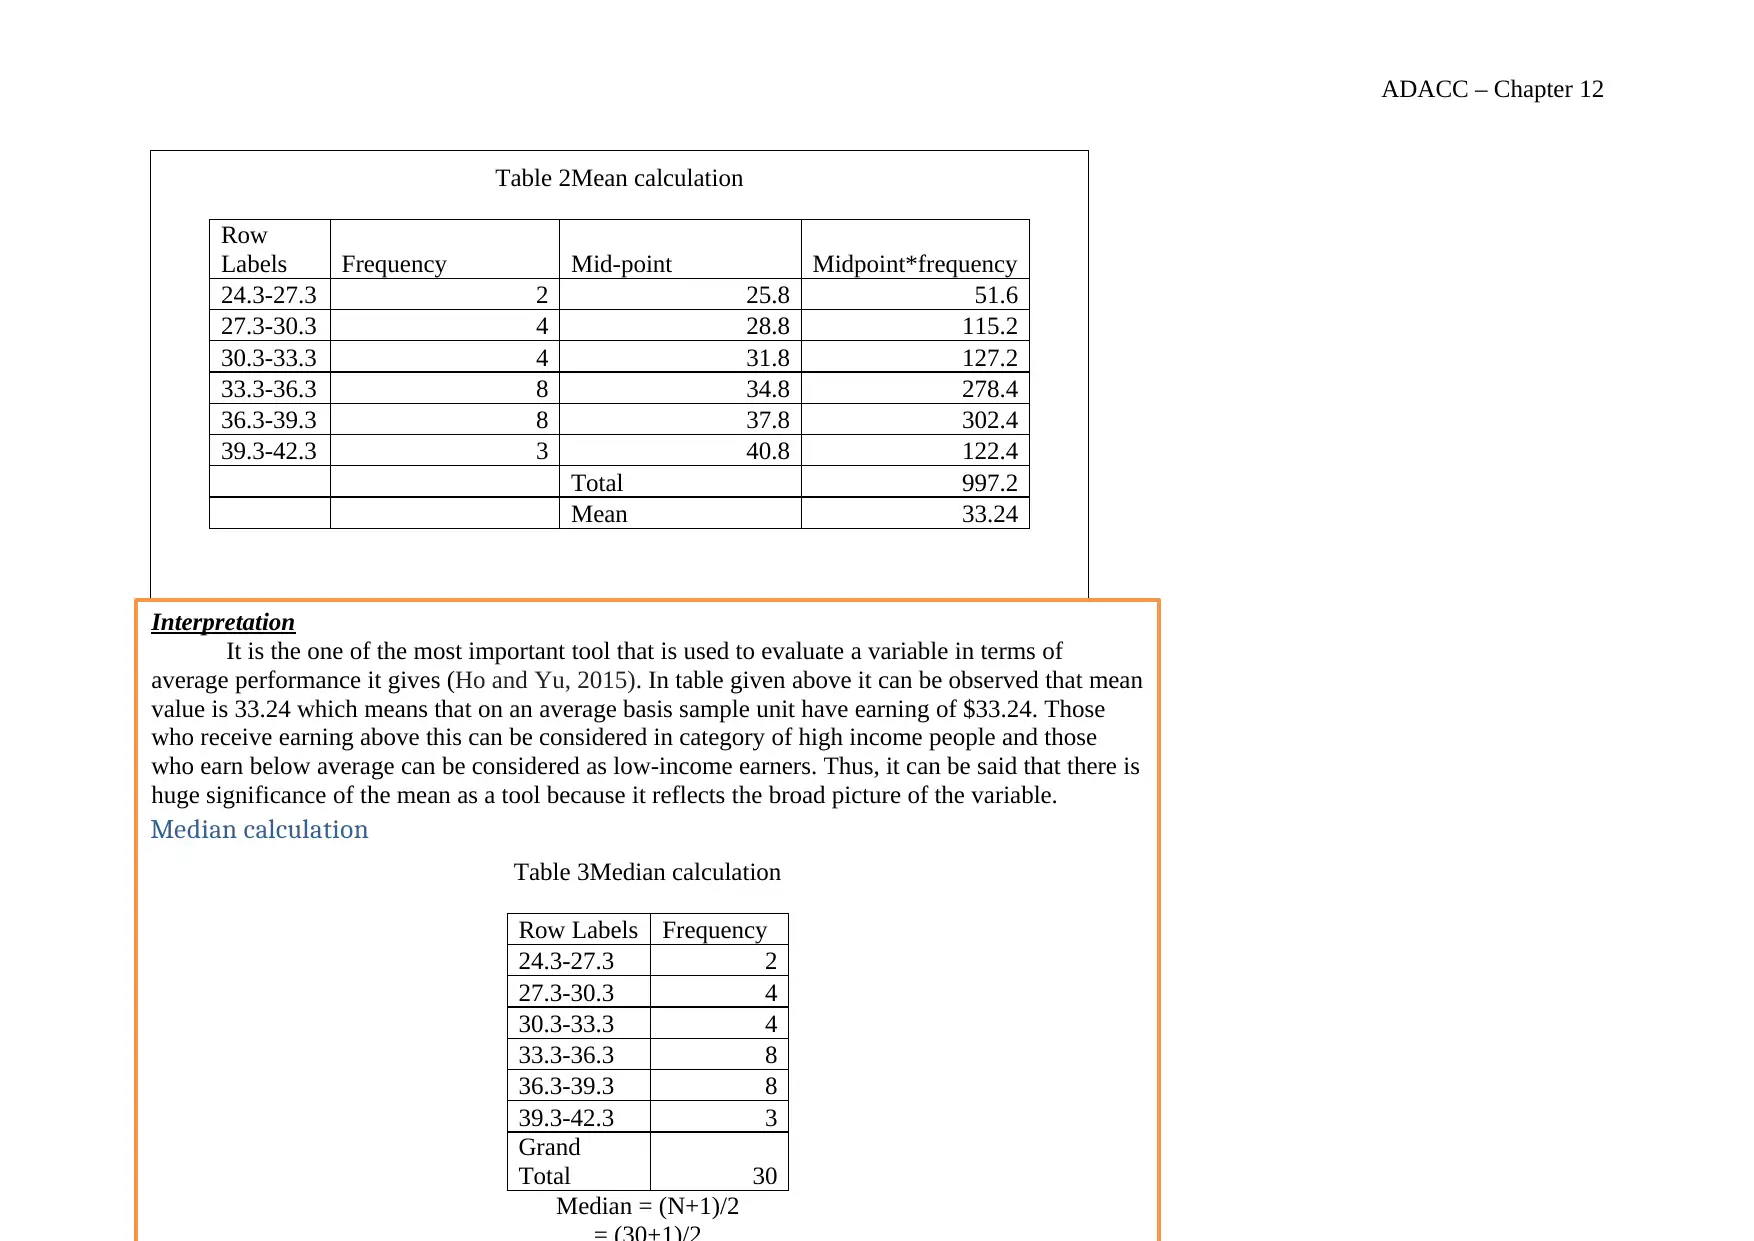
Table 2Mean calculation
Row
Labels Frequency Mid-point Midpoint*frequency
24.3-27.3 2 25.8 51.6
27.3-30.3 4 28.8 115.2
30.3-33.3 4 31.8 127.2
33.3-36.3 8 34.8 278.4
36.3-39.3 8 37.8 302.4
39.3-42.3 3 40.8 122.4
Total 997.2
Mean 33.24
Interpretation
It is the one of the most important tool that is used to evaluate a variable in terms of
average performance it gives (Ho and Yu, 2015). In table given above it can be observed that mean
value is 33.24 which means that on an average basis sample unit have earning of $33.24. Those
who receive earning above this can be considered in category of high income people and those
who earn below average can be considered as low-income earners. Thus, it can be said that there is
huge significance of the mean as a tool because it reflects the broad picture of the variable.
Median calculation
Table 3Median calculation
Row Labels Frequency
24.3-27.3 2
27.3-30.3 4
30.3-33.3 4
33.3-36.3 8
36.3-39.3 8
39.3-42.3 3
Grand
Total 30
Median = (N+1)/2
Paraphrase This Document
Need a fresh take? Get an instant paraphrase of this document with our AI Paraphraser
ADACC – Chapter 12
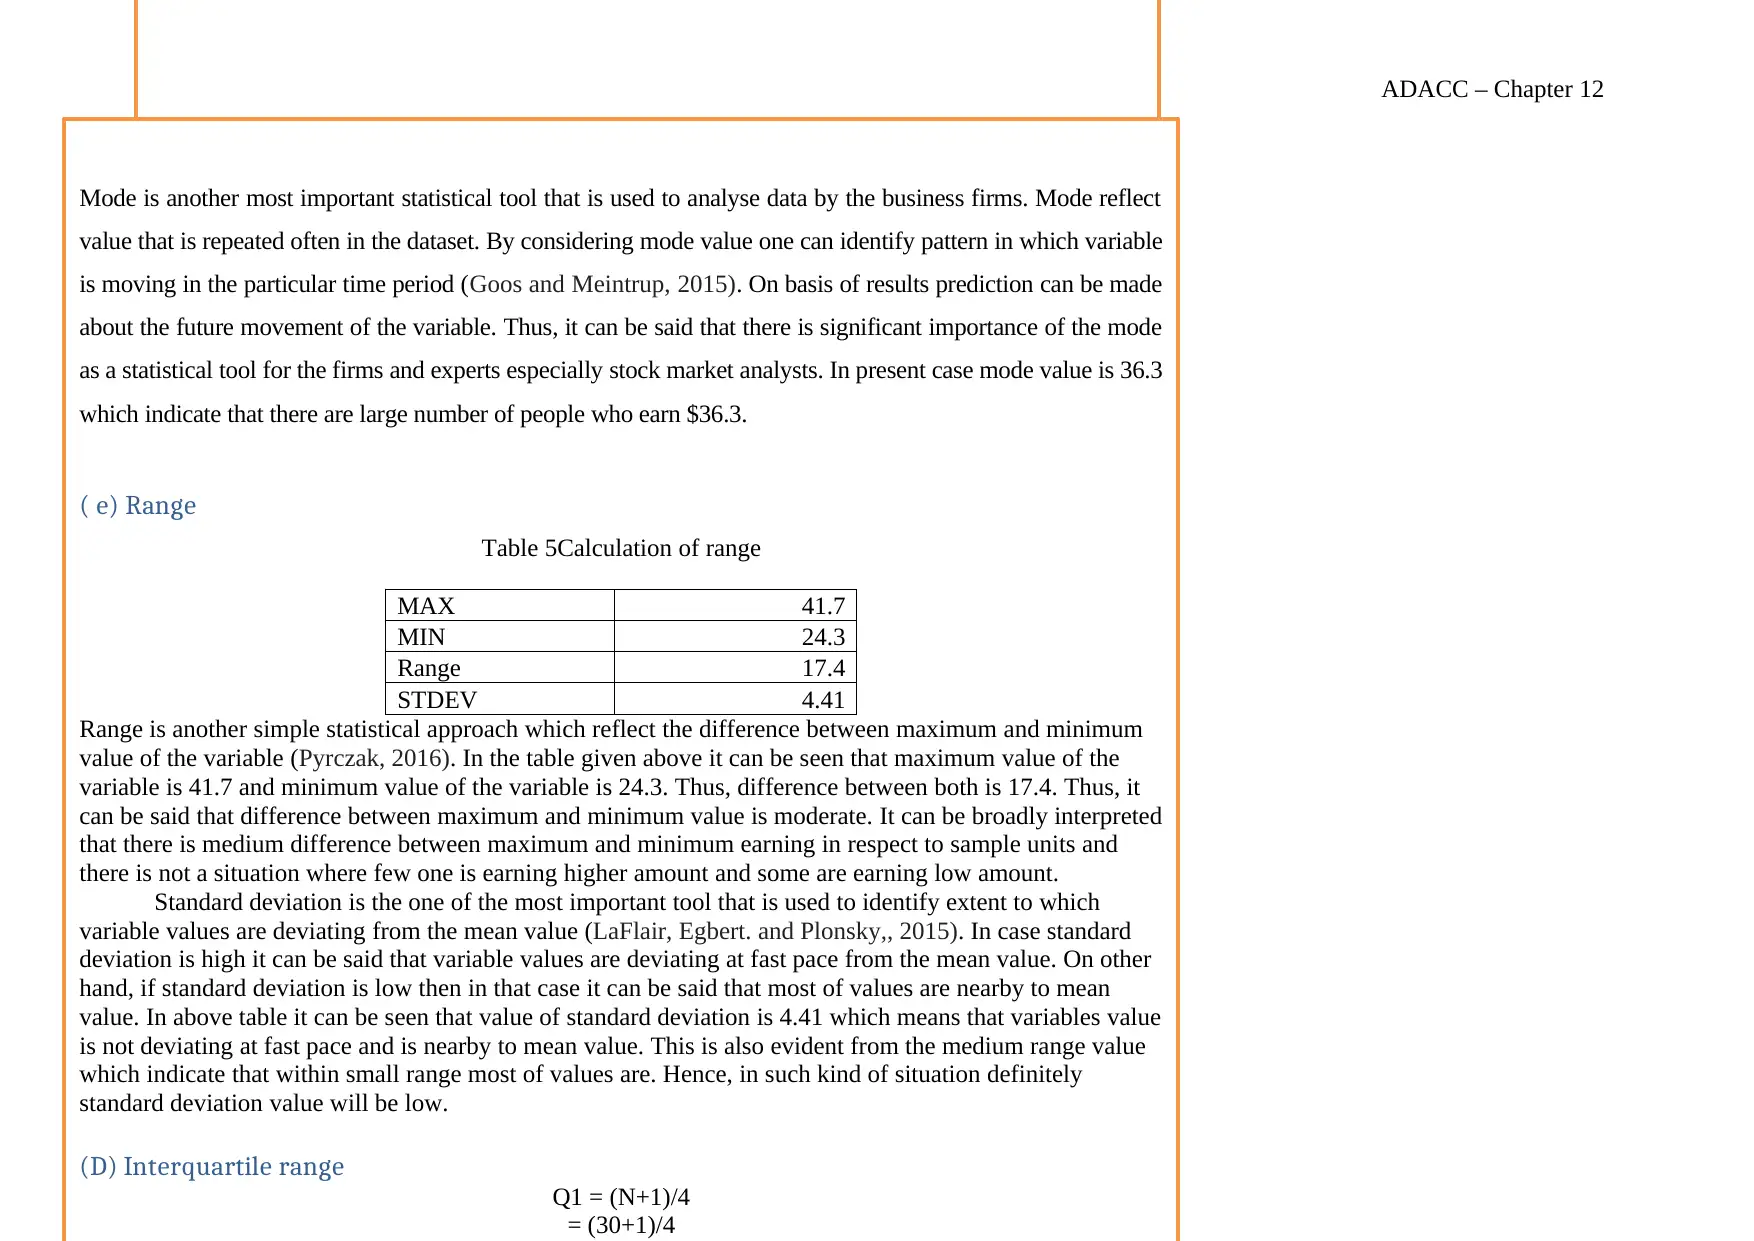
Mode is another most important statistical tool that is used to analyse data by the business firms. Mode reflect
value that is repeated often in the dataset. By considering mode value one can identify pattern in which variable
is moving in the particular time period (Goos and Meintrup, 2015). On basis of results prediction can be made
about the future movement of the variable. Thus, it can be said that there is significant importance of the mode
as a statistical tool for the firms and experts especially stock market analysts. In present case mode value is 36.3
which indicate that there are large number of people who earn $36.3.
( e) Range
Table 5Calculation of range
MAX 41.7
MIN 24.3
Range 17.4
STDEV 4.41
Range is another simple statistical approach which reflect the difference between maximum and minimum
value of the variable (Pyrczak, 2016). In the table given above it can be seen that maximum value of the
variable is 41.7 and minimum value of the variable is 24.3. Thus, difference between both is 17.4. Thus, it
can be said that difference between maximum and minimum value is moderate. It can be broadly interpreted
that there is medium difference between maximum and minimum earning in respect to sample units and
there is not a situation where few one is earning higher amount and some are earning low amount.
Standard deviation is the one of the most important tool that is used to identify extent to which
variable values are deviating from the mean value (LaFlair, Egbert. and Plonsky,, 2015). In case standard
deviation is high it can be said that variable values are deviating at fast pace from the mean value. On other
hand, if standard deviation is low then in that case it can be said that most of values are nearby to mean
value. In above table it can be seen that value of standard deviation is 4.41 which means that variables value
is not deviating at fast pace and is nearby to mean value. This is also evident from the medium range value
which indicate that within small range most of values are. Hence, in such kind of situation definitely
standard deviation value will be low.
(D) Interquartile range
Q1 = (N+1)/4
= (30+1)/4
ADACC – Chapter 12
Short Answer Question 2:
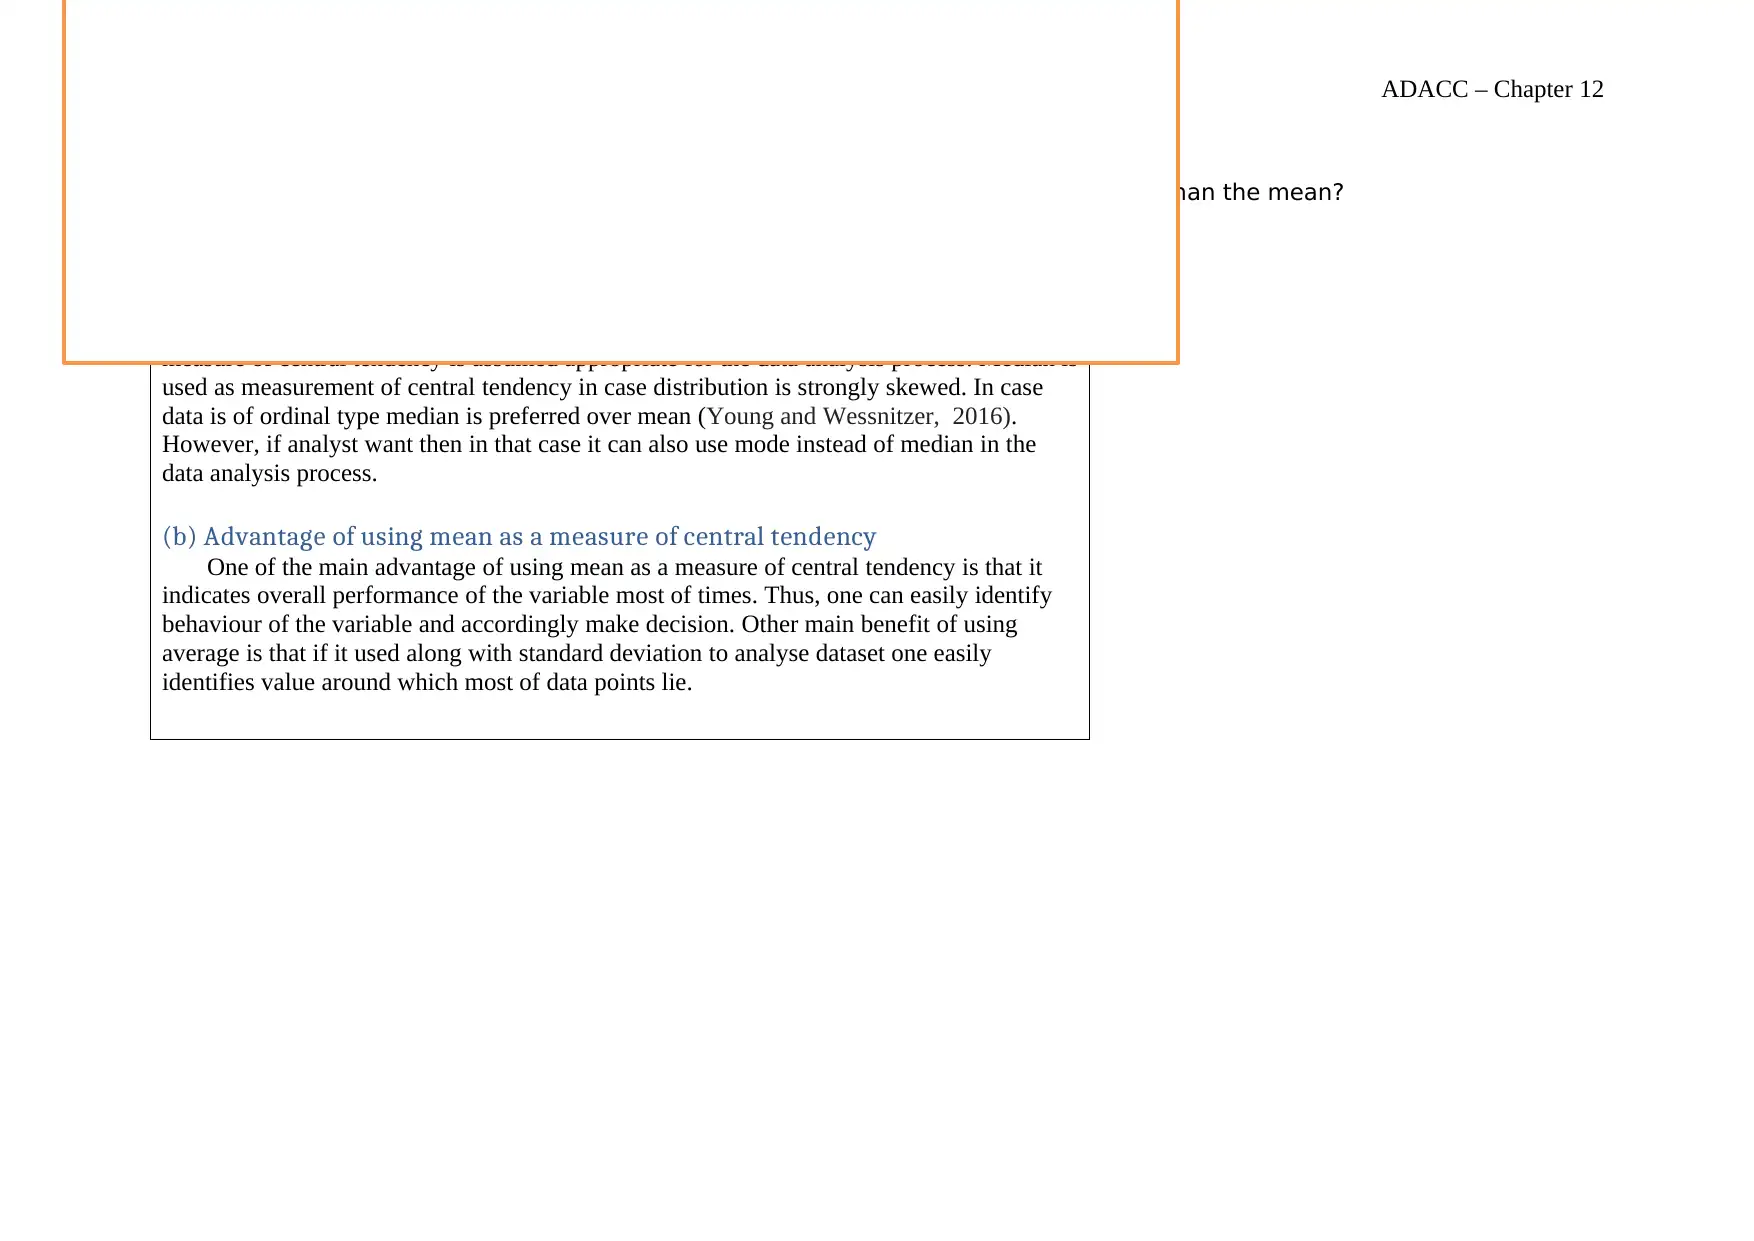
a) When is it more appropriate to use the median as a measure of central tendency than the mean?
b) List two advantages of using the mean as a measure of central tendency.
(a)Appropriateness of median then mean as measure of central tendency
There is no best measure of central tendency. It depends on the data type that which of
measure of central tendency is assumed appropriate for the data analysis process. Median is
used as measurement of central tendency in case distribution is strongly skewed. In case
data is of ordinal type median is preferred over mean (Young and Wessnitzer, 2016).
However, if analyst want then in that case it can also use mode instead of median in the
data analysis process.
(b) Advantage of using mean as a measure of central tendency
One of the main advantage of using mean as a measure of central tendency is that it
indicates overall performance of the variable most of times. Thus, one can easily identify
behaviour of the variable and accordingly make decision. Other main benefit of using
average is that if it used along with standard deviation to analyse dataset one easily
identifies value around which most of data points lie.
Short Answer Question 2:
a) When is it more appropriate to use the median as a measure of central tendency than the mean?
b) List two advantages of using the mean as a measure of central tendency.
(a)Appropriateness of median then mean as measure of central tendency
There is no best measure of central tendency. It depends on the data type that which of
measure of central tendency is assumed appropriate for the data analysis process. Median is
used as measurement of central tendency in case distribution is strongly skewed. In case
data is of ordinal type median is preferred over mean (Young and Wessnitzer, 2016).
However, if analyst want then in that case it can also use mode instead of median in the
data analysis process.
(b) Advantage of using mean as a measure of central tendency
One of the main advantage of using mean as a measure of central tendency is that it
indicates overall performance of the variable most of times. Thus, one can easily identify
behaviour of the variable and accordingly make decision. Other main benefit of using
average is that if it used along with standard deviation to analyse dataset one easily
identifies value around which most of data points lie.
⊘ This is a preview!⊘
Do you want full access?
Subscribe today to unlock all pages.
Trusted by 1+ million students worldwide
ADACC – Chapter 12
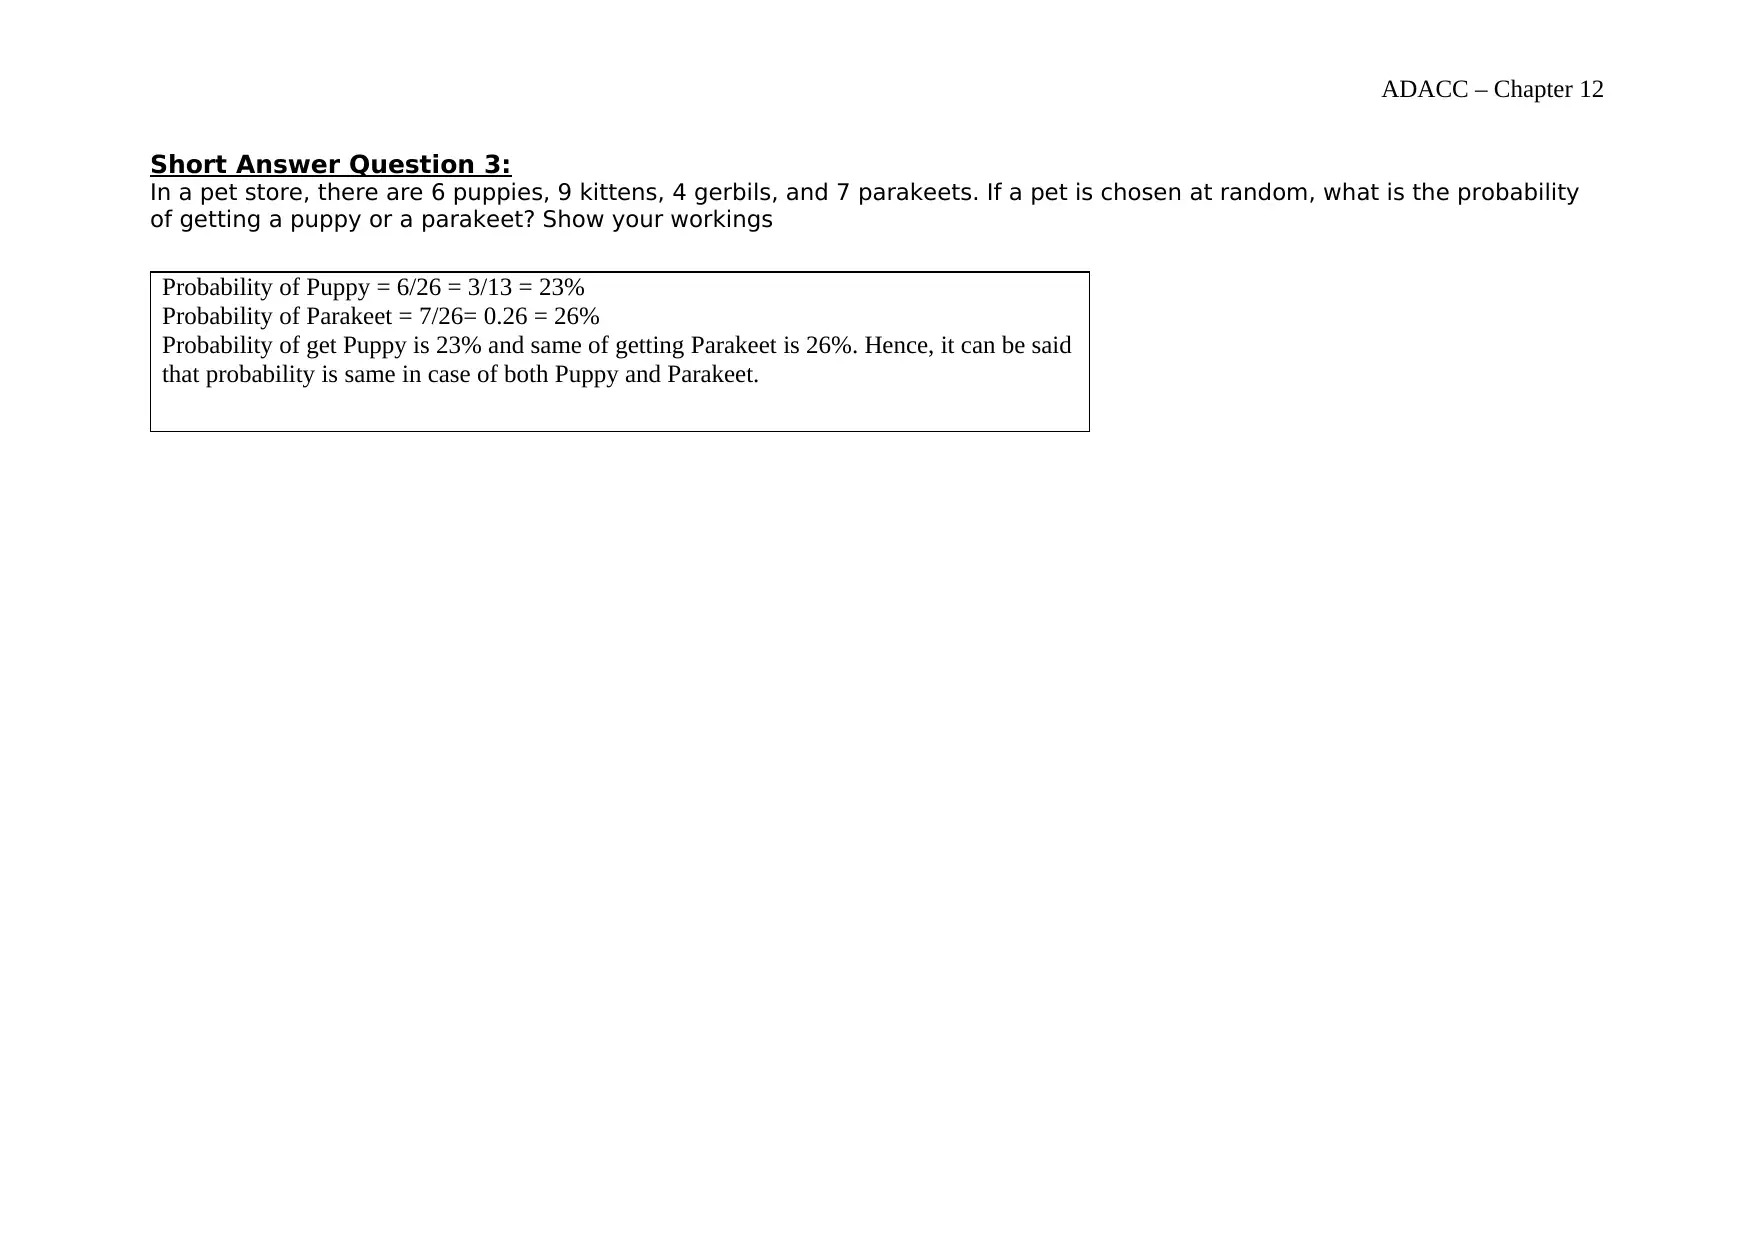
Short Answer Question 3:
In a pet store, there are 6 puppies, 9 kittens, 4 gerbils, and 7 parakeets. If a pet is chosen at random, what is the probability
of getting a puppy or a parakeet? Show your workings
Probability of Puppy = 6/26 = 3/13 = 23%
Probability of Parakeet = 7/26= 0.26 = 26%
Probability of get Puppy is 23% and same of getting Parakeet is 26%. Hence, it can be said
that probability is same in case of both Puppy and Parakeet.
Paraphrase This Document
Need a fresh take? Get an instant paraphrase of this document with our AI Paraphraser
ADACC – Chapter 12
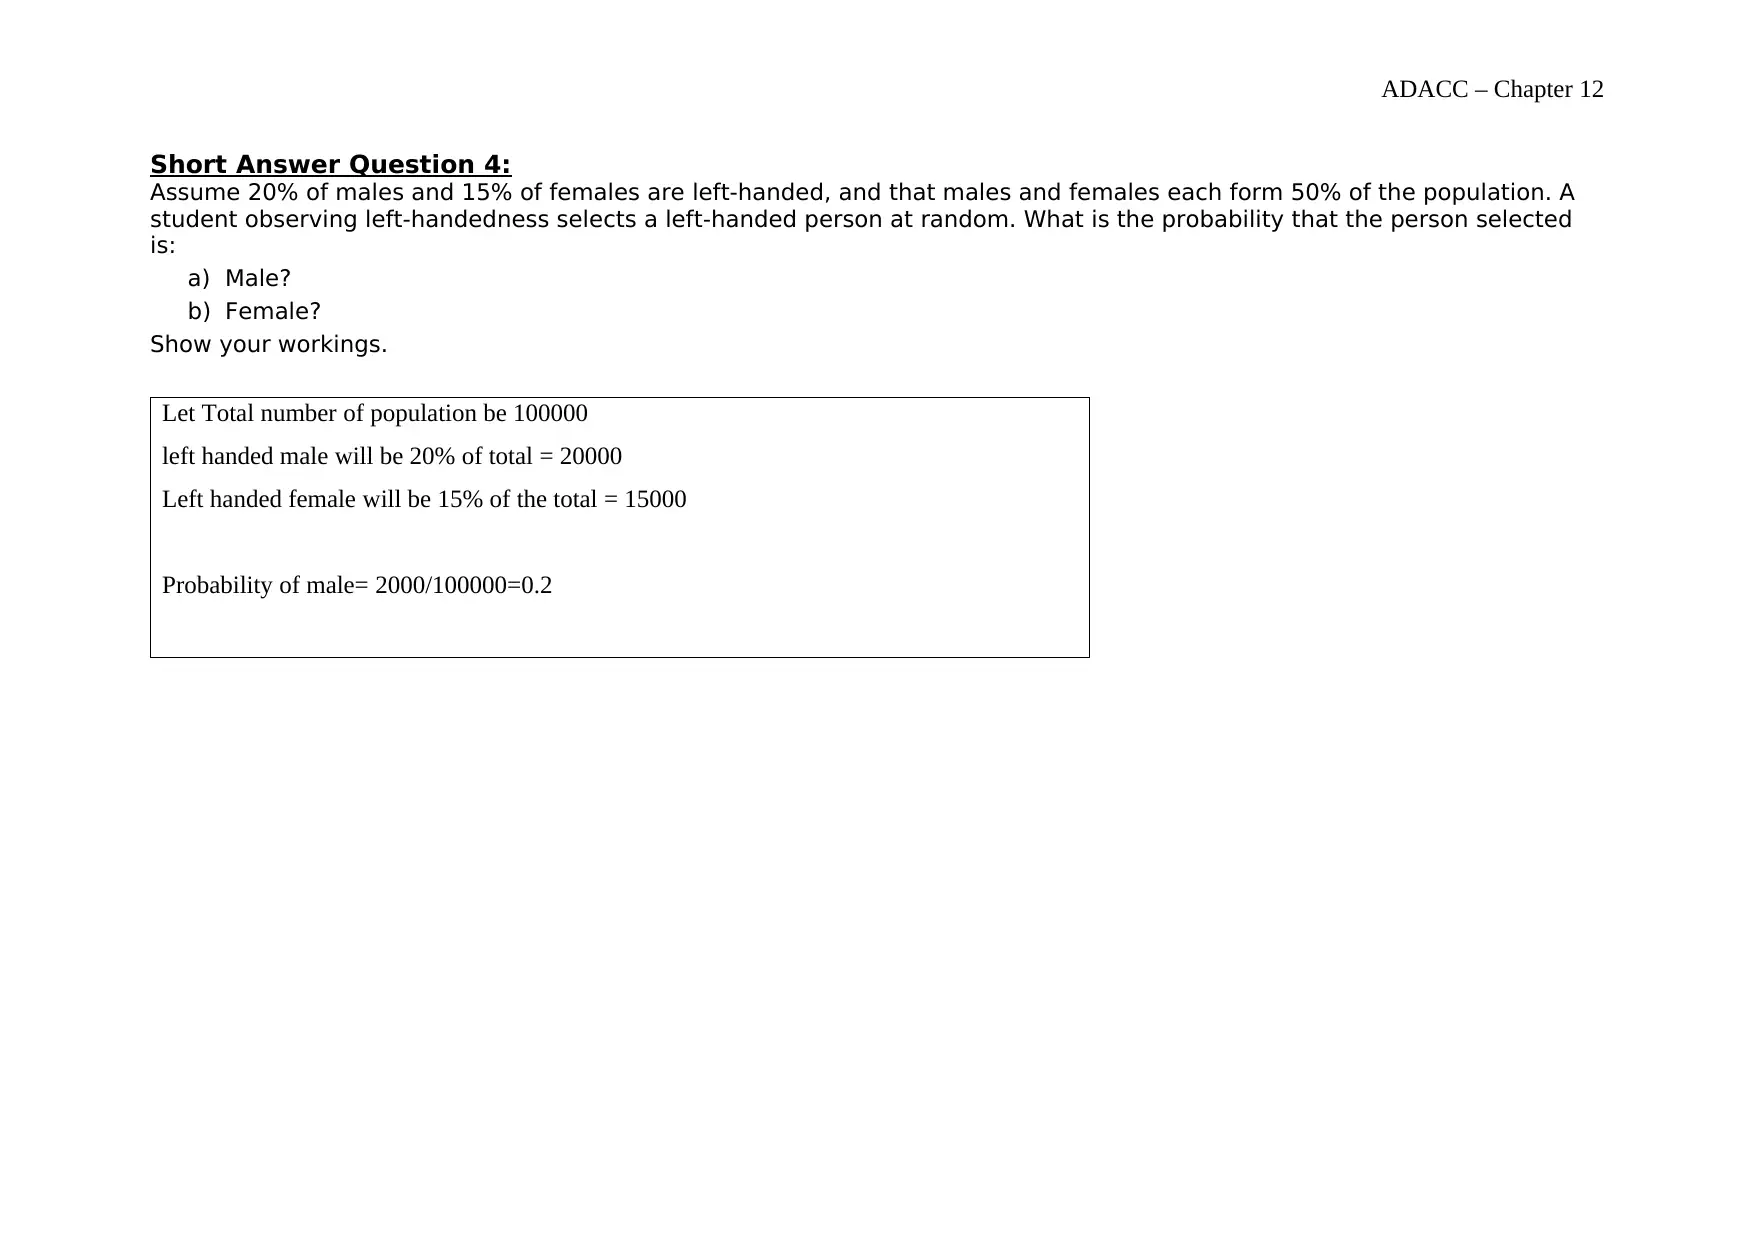
Short Answer Question 4:
Assume 20% of males and 15% of females are left-handed, and that males and females each form 50% of the population. A
student observing left-handedness selects a left-handed person at random. What is the probability that the person selected
is:
a) Male?
b) Female?
Show your workings.
Let Total number of population be 100000
left handed male will be 20% of total = 20000
Left handed female will be 15% of the total = 15000
Probability of male= 2000/100000=0.2
ADACC – Chapter 12
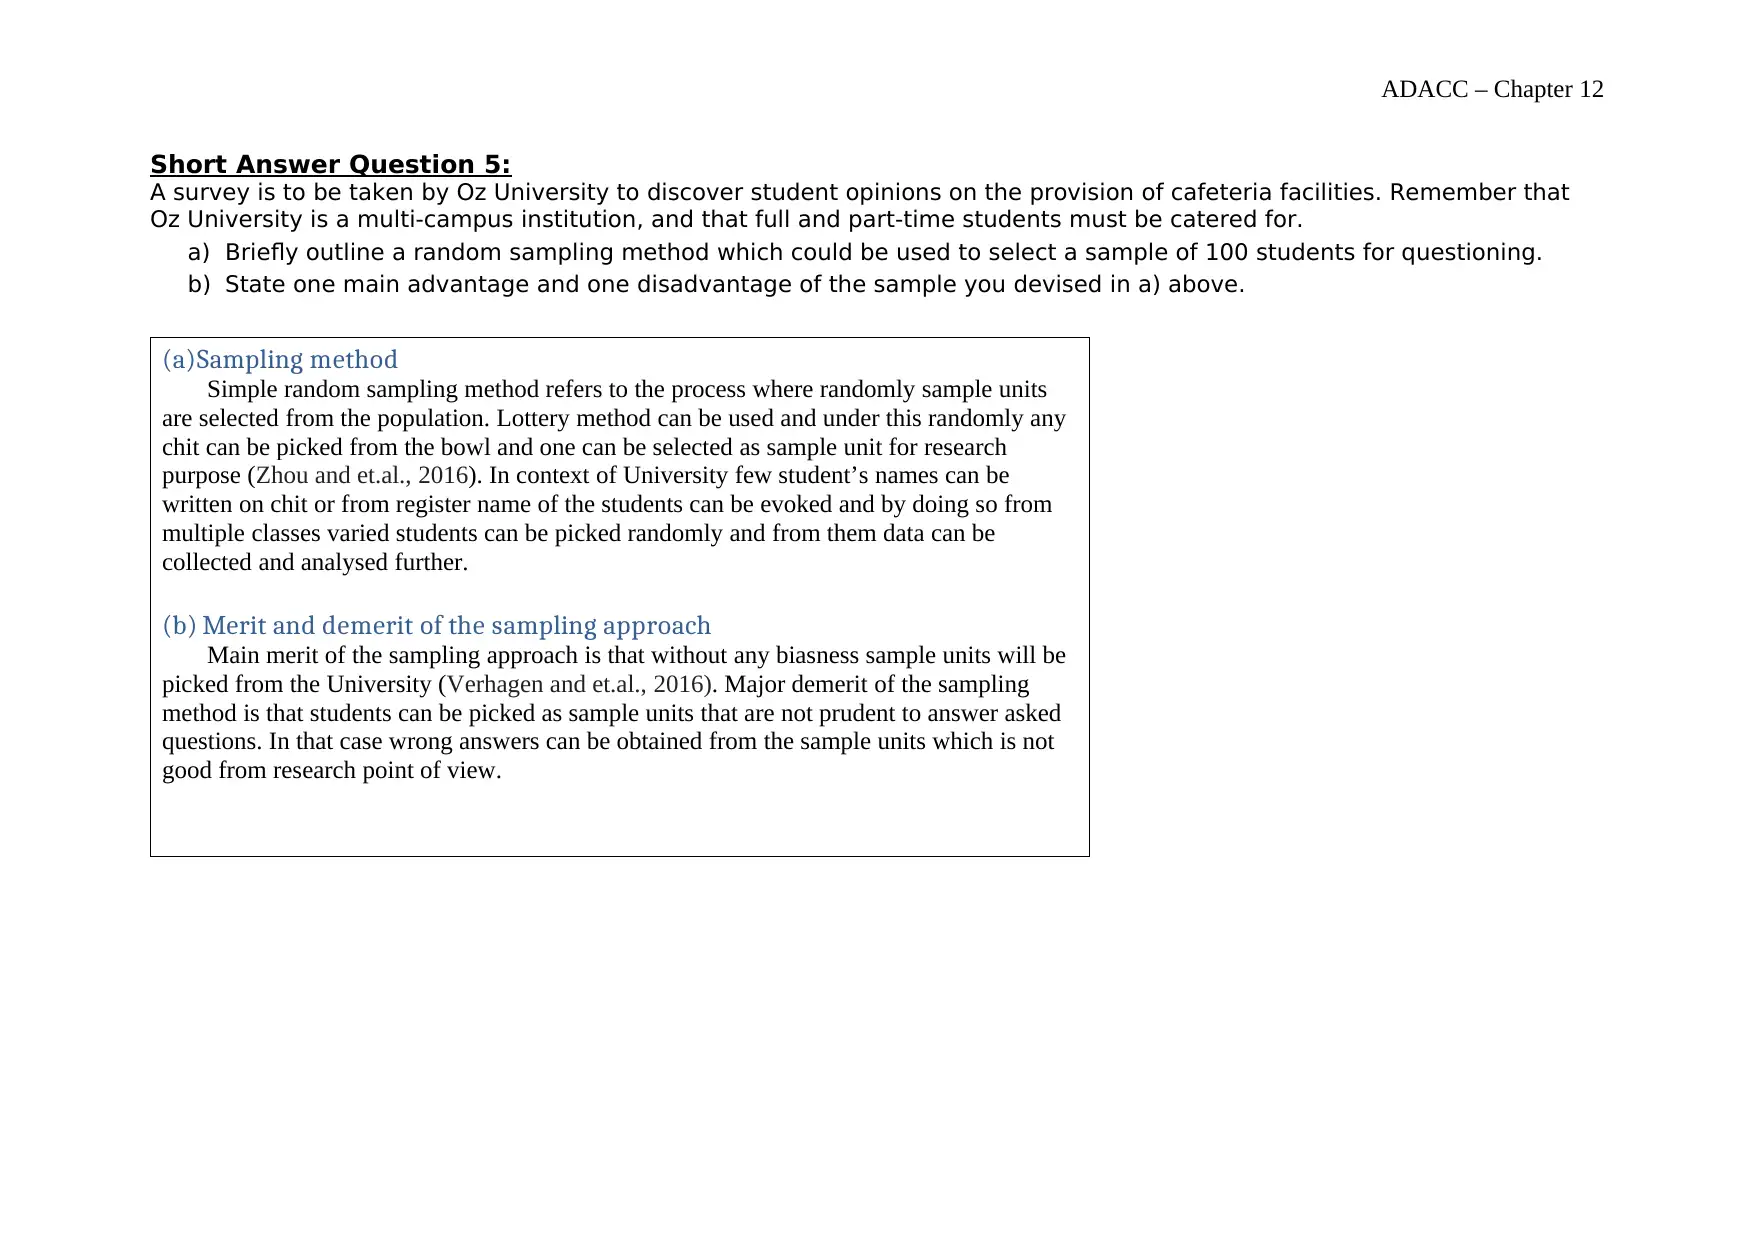
Short Answer Question 5:
A survey is to be taken by Oz University to discover student opinions on the provision of cafeteria facilities. Remember that
Oz University is a multi-campus institution, and that full and part-time students must be catered for.
a) Briefly outline a random sampling method which could be used to select a sample of 100 students for questioning.
b) State one main advantage and one disadvantage of the sample you devised in a) above.
(a)Sampling method
Simple random sampling method refers to the process where randomly sample units
are selected from the population. Lottery method can be used and under this randomly any
chit can be picked from the bowl and one can be selected as sample unit for research
purpose (Zhou and et.al., 2016). In context of University few student’s names can be
written on chit or from register name of the students can be evoked and by doing so from
multiple classes varied students can be picked randomly and from them data can be
collected and analysed further.
(b) Merit and demerit of the sampling approach
Main merit of the sampling approach is that without any biasness sample units will be
picked from the University (Verhagen and et.al., 2016). Major demerit of the sampling
method is that students can be picked as sample units that are not prudent to answer asked
questions. In that case wrong answers can be obtained from the sample units which is not
good from research point of view.
⊘ This is a preview!⊘
Do you want full access?
Subscribe today to unlock all pages.
Trusted by 1+ million students worldwide
1 out of 30
Related Documents


Your All-in-One AI-Powered Toolkit for Academic Success.
+13062052269
info@desklib.com
Available 24*7 on WhatsApp / Email
![[object Object]](/_next/static/media/star-bottom.7253800d.svg)
Unlock your academic potential
Copyright © 2020–2026 A2Z Services. All Rights Reserved. Developed and managed by ZUCOL.