Financial Analysis Report: Adelaide Brighton Ltd (ABC) - Investment
VerifiedAdded on 2019/09/30
|24
|6798
|162
Report
AI Summary
This report presents a detailed financial analysis of Adelaide Brighton Ltd (ABC), an Australian company operating in the building, construction, and infrastructure markets. The analysis examines the company's financial performance through key metrics, including liquidity (current ratio), profitability (net profit margin and return on assets), capital structure (debt ratio and interest cover ratio), and market value (price-earning ratio). The report compares ABC's performance to industry averages, providing insights into the company's competitive advantage and efficiency. Furthermore, the report includes a share valuation using the constant dividend discount model and concludes with an investment recommendation based on the financial analysis and market indicators. The analysis suggests a sustainable financial position with potential for growth, but the investor market indicates a no-buy position. The report uses data from ABC's financial statements and IBISWorld reports to support its findings.
Executive Summary
The subject of this analysis is Adelaide Brighton Ltd, established in 1882, distributed in
strategic locations across Australia. Adelaide Brighton, the largest importer of cement in
Australia, supplies building, construction and infrastructure markets with material. Proactive
management has kept costs under control with a reliable and efficient asset base.
The prime motive for business is to make a profit and for investors to have a return on their
investments. The analysis of the financial statements looked at liquidity, profitability, capital
structure and share value providing a rounded analysis. The ratios representing liquidity,
profitability and capital structure show an organisation that is sustainable in the long-term
and supports investment. Analysis of the capital structure shows potential for the
organisation to grow the capital base.
The response from the investor market shows a share value that is above the share value
calculated using the constant dividend discount model. The financial statements lean
towards a recommendation to invest, while the investor market indicates a no-buy position.
Paraphrase This Document
Need a fresh take? Get an instant paraphrase of this document with our AI Paraphraser
Contents
1. Introduction...........................................................................................................................................1
2. Financial Analysis...................................................................................................................................1
2.1 Liquidity: Current ratio...................................................................................................................1
2.2 Profitability: Net profit margin ratio and Return on total assets...................................................3
2.3 Capital structure: Debt ratio and Interest cover ratio....................................................................5
2.4 Market value: Price-earning (P/E) ratio.........................................................................................6
3. Share Valuation - Constant Dividend Discount Model...........................................................................8
4. Recommendation................................................................................................................................10
5. Conclusion...........................................................................................................................................11
References...................................................................................................................................................12
6. Appendix 1...........................................................................................................................................14
1 Financials.........................................................................................................................................14
2 Growth & Ratios..............................................................................................................................15
3 Industry Averages............................................................................................................................16
4 Competitive Environment................................................................................................................17
7. Appendix 2...........................................................................................................................................21
1. Introduction
Adelaide Brighton Ltd is a publicly owned company, established in 1882 and is registered on the
Australian Stock Exchange (ASX) under the code ABC. Adelaide Brighton (ABC) manufactures and
distributes material across the building construction and infrastructure markets as well as
mineral processing market. Major manufacturing facilities are strategically located in South
Australia, Western Australia and the Northern Territory, enabling ABL to supply all Australian
major centres. To support this, ABL have distribution joint ventures in Victoria and Queensland.
The majority of revenue, 104.92%, for ABC is derived from the cement, lime, concrete and
aggregates segment with concrete products providing 10.09% and unallocated industry
segments returning -15.01% (IBISWorld 2015). Adelaide Brighton has a 38.6% share of the
cement and lime-manufacturing segment, followed by Cement Australia Holdings Pty Ltd and
Boral Ltd (IBISWorld 2015).
This report on the financial analysis of ABC, to support or not support investment in ABC, will
look at liquidity using the current ratio, profitability using net profit margin and return on total
assets, and finally the capital structure using debt ratio and interest cover ratio. The results of
the analysis will be presented in the recommendation section of this report with concluding
remarks in the conclusion.
Towards the end of November 2015 the shares recovered to an upward trend. The past five
years has seen patterns of upward and downward trends. Overall, there has been an upward
trend in the share price. The cyclical nature of the share price trends for ABC has seen drops in
price close the beginning of the year with recovery around July. Recovery for 2016 was early,
around January reflecting the possibility that the share price might be over inflated and due for a
downward trend.
2. Financial Analysis
The financial analysis from financial records published by ABC and reported on by IBISWorld
(2016).
2.1 Liquidity: Current ratio
Note: Unless otherwise stated, the values used are from Appendix 1.
Page | 1
⊘ This is a preview!⊘
Do you want full access?
Subscribe today to unlock all pages.
Trusted by 1+ million students worldwide
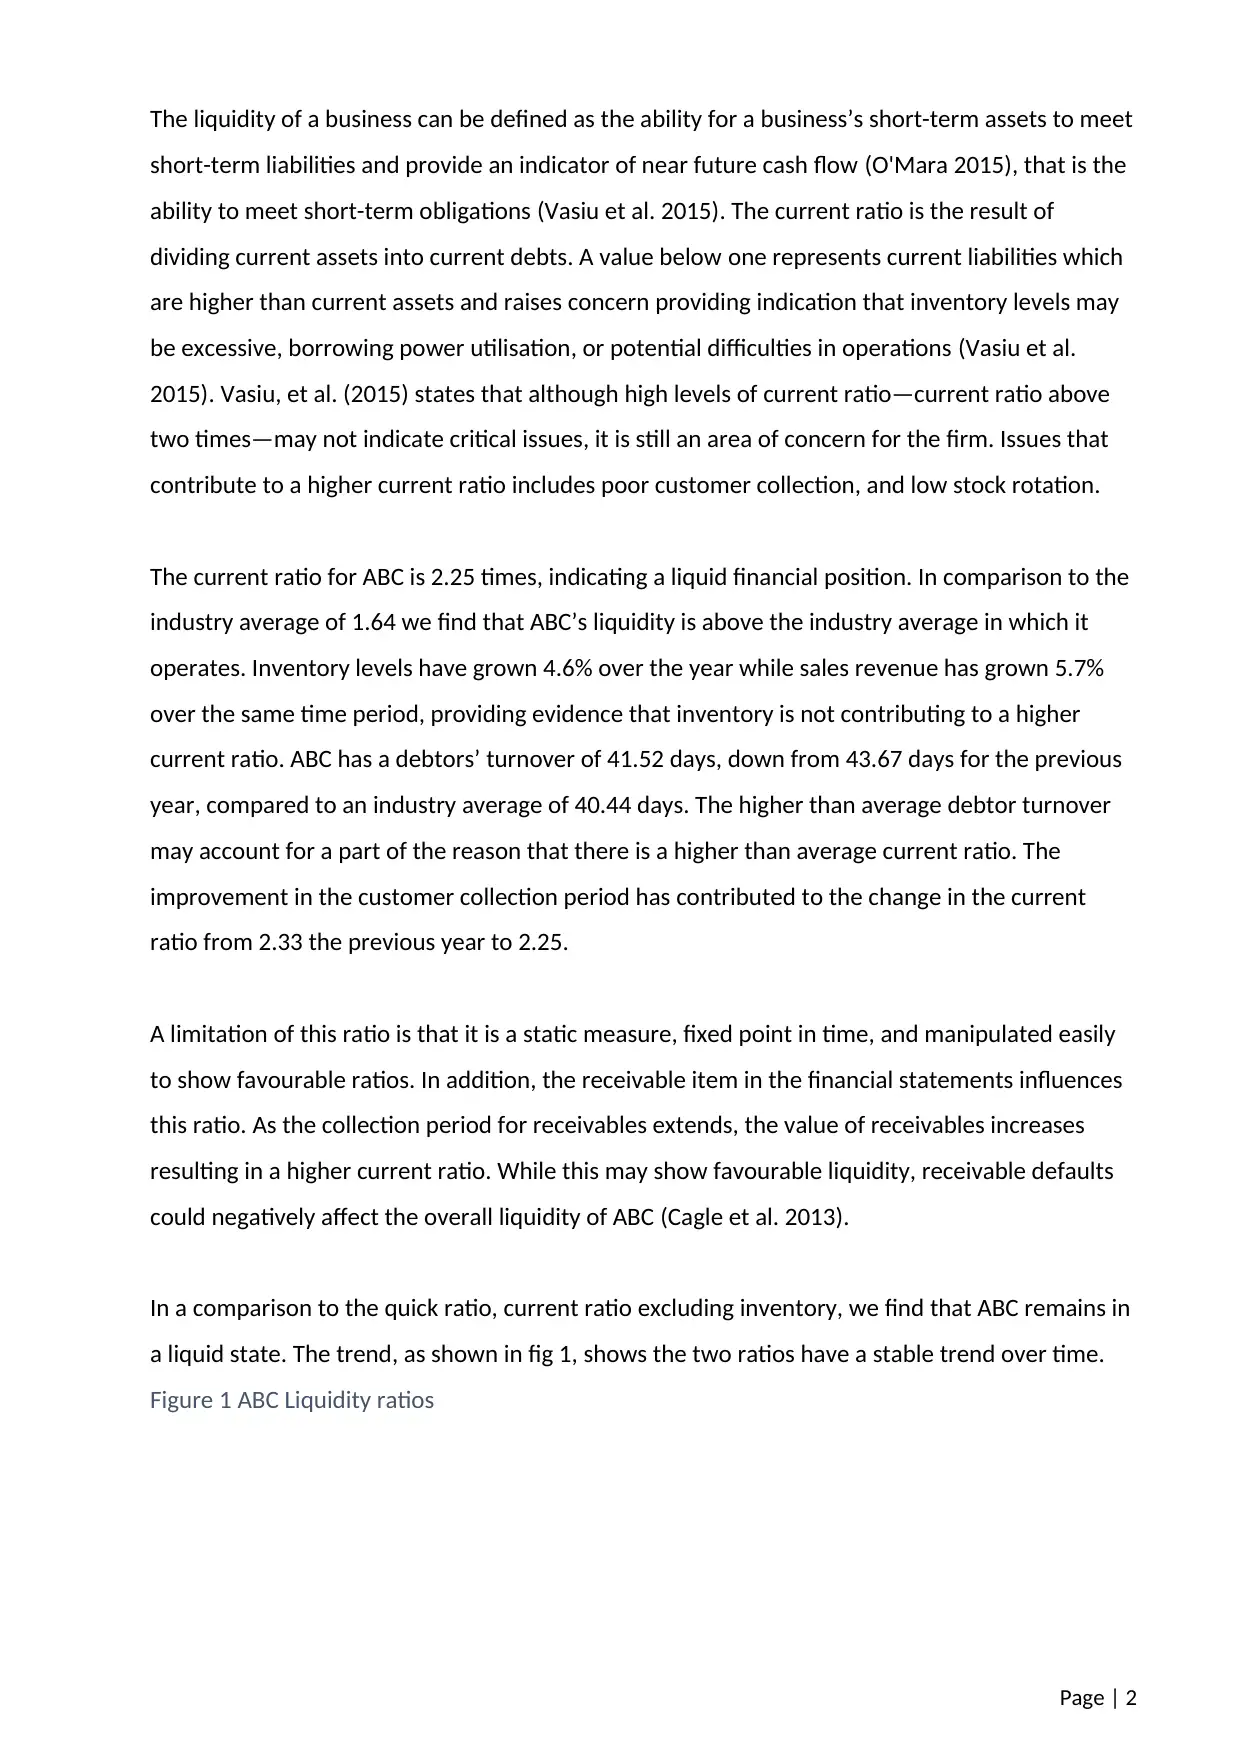
The liquidity of a business can be defined as the ability for a business’s short-term assets to meet
short-term liabilities and provide an indicator of near future cash flow (O'Mara 2015), that is the
ability to meet short-term obligations (Vasiu et al. 2015). The current ratio is the result of
dividing current assets into current debts. A value below one represents current liabilities which
are higher than current assets and raises concern providing indication that inventory levels may
be excessive, borrowing power utilisation, or potential difficulties in operations (Vasiu et al.
2015). Vasiu, et al. (2015) states that although high levels of current ratio—current ratio above
two times—may not indicate critical issues, it is still an area of concern for the firm. Issues that
contribute to a higher current ratio includes poor customer collection, and low stock rotation.
The current ratio for ABC is 2.25 times, indicating a liquid financial position. In comparison to the
industry average of 1.64 we find that ABC’s liquidity is above the industry average in which it
operates. Inventory levels have grown 4.6% over the year while sales revenue has grown 5.7%
over the same time period, providing evidence that inventory is not contributing to a higher
current ratio. ABC has a debtors’ turnover of 41.52 days, down from 43.67 days for the previous
year, compared to an industry average of 40.44 days. The higher than average debtor turnover
may account for a part of the reason that there is a higher than average current ratio. The
improvement in the customer collection period has contributed to the change in the current
ratio from 2.33 the previous year to 2.25.
A limitation of this ratio is that it is a static measure, fixed point in time, and manipulated easily
to show favourable ratios. In addition, the receivable item in the financial statements influences
this ratio. As the collection period for receivables extends, the value of receivables increases
resulting in a higher current ratio. While this may show favourable liquidity, receivable defaults
could negatively affect the overall liquidity of ABC (Cagle et al. 2013).
In a comparison to the quick ratio, current ratio excluding inventory, we find that ABC remains in
a liquid state. The trend, as shown in fig 1, shows the two ratios have a stable trend over time.
Figure 1 ABC Liquidity ratios
Page | 2
Paraphrase This Document
Need a fresh take? Get an instant paraphrase of this document with our AI Paraphraser
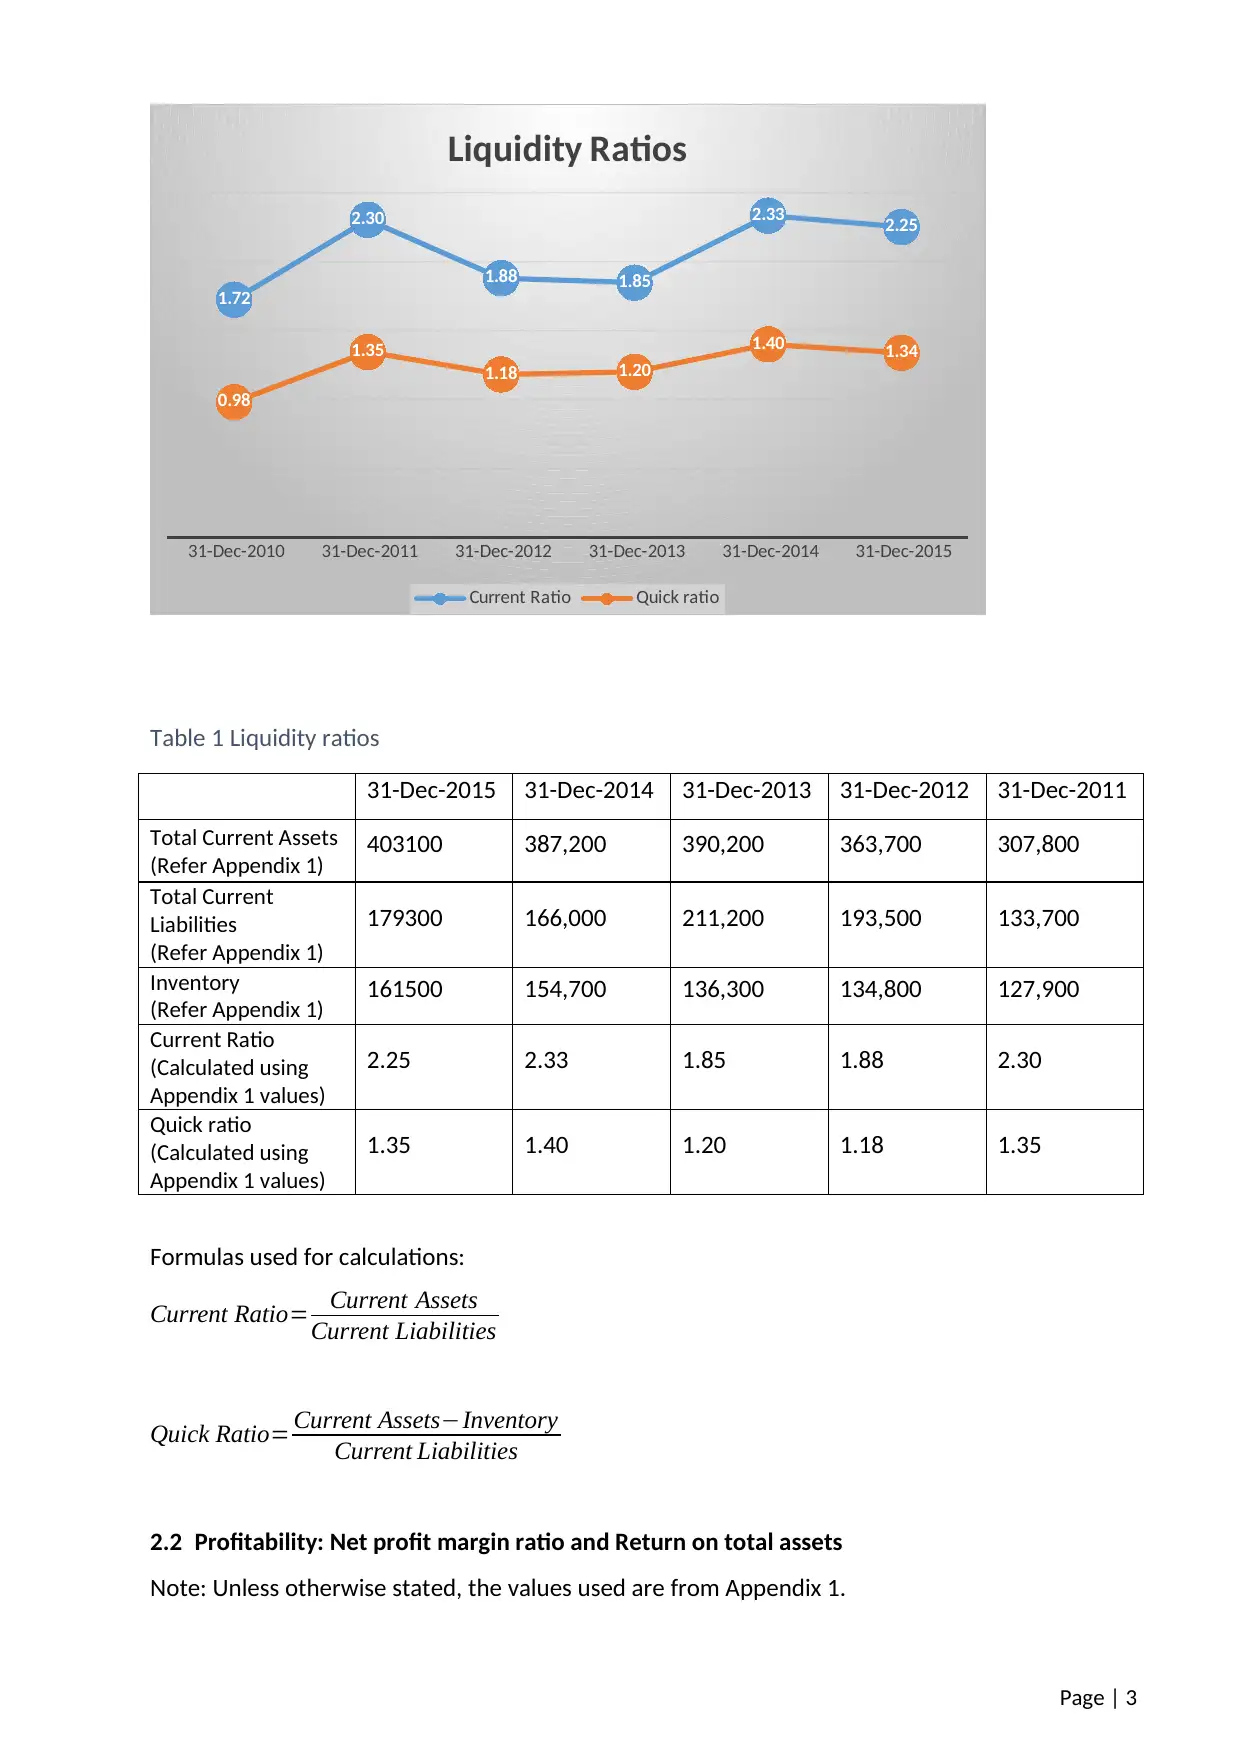
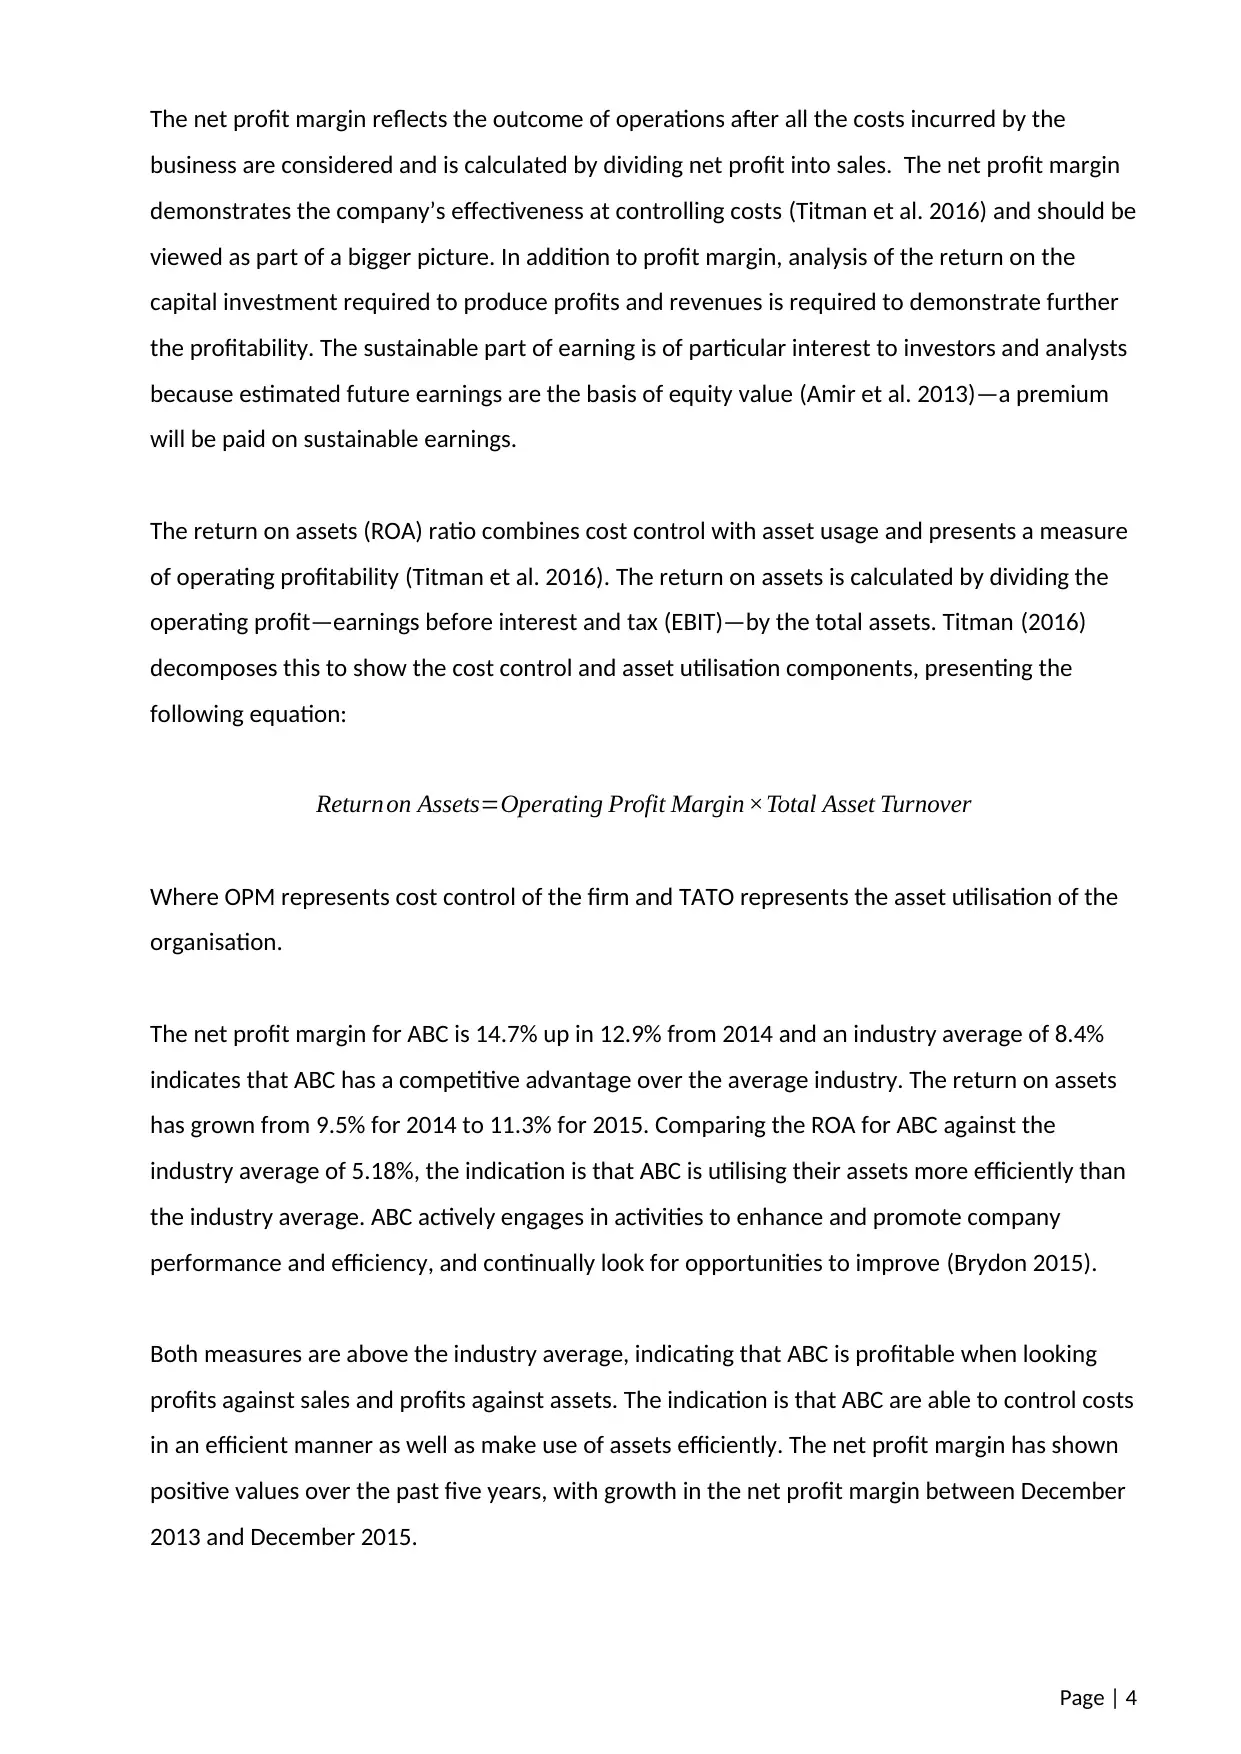
Table 1 Liquidity ratios
31-Dec-2015 31-Dec-2014 31-Dec-2013 31-Dec-2012 31-Dec-2011
Total Current Assets
(Refer Appendix 1) 403100 387,200 390,200 363,700 307,800
Total Current
Liabilities
(Refer Appendix 1)
179300 166,000 211,200 193,500 133,700
Inventory
(Refer Appendix 1) 161500 154,700 136,300 134,800 127,900
Current Ratio
(Calculated using
Appendix 1 values)
2.25 2.33 1.85 1.88 2.30
Quick ratio
(Calculated using
Appendix 1 values)
1.35 1.40 1.20 1.18 1.35
Formulas used for calculations:
Current Ratio= Current Assets
Current Liabilities
Quick Ratio= Current Assets−Inventory
Current Liabilities
2.2 Profitability: Net profit margin ratio and Return on total assets
Note: Unless otherwise stated, the values used are from Appendix 1.
Page | 3
31-Dec-2010 31-Dec-2011 31-Dec-2012 31-Dec-2013 31-Dec-2014 31-Dec-2015
1.72
2.30
1.88 1.85
2.33 2.25
0.98
1.35
1.18 1.20
1.40 1.34
Liquidity Ratios
Current Ratio Quick ratio
The net profit margin reflects the outcome of operations after all the costs incurred by the
business are considered and is calculated by dividing net profit into sales. The net profit margin
demonstrates the company’s effectiveness at controlling costs (Titman et al. 2016) and should be
viewed as part of a bigger picture. In addition to profit margin, analysis of the return on the
capital investment required to produce profits and revenues is required to demonstrate further
the profitability. The sustainable part of earning is of particular interest to investors and analysts
because estimated future earnings are the basis of equity value (Amir et al. 2013)—a premium
will be paid on sustainable earnings.
The return on assets (ROA) ratio combines cost control with asset usage and presents a measure
of operating profitability (Titman et al. 2016). The return on assets is calculated by dividing the
operating profit—earnings before interest and tax (EBIT)—by the total assets. Titman (2016)
decomposes this to show the cost control and asset utilisation components, presenting the
following equation:
Returnon Assets=Operating Profit Margin ×Total Asset Turnover
Where OPM represents cost control of the firm and TATO represents the asset utilisation of the
organisation.
The net profit margin for ABC is 14.7% up in 12.9% from 2014 and an industry average of 8.4%
indicates that ABC has a competitive advantage over the average industry. The return on assets
has grown from 9.5% for 2014 to 11.3% for 2015. Comparing the ROA for ABC against the
industry average of 5.18%, the indication is that ABC is utilising their assets more efficiently than
the industry average. ABC actively engages in activities to enhance and promote company
performance and efficiency, and continually look for opportunities to improve (Brydon 2015).
Both measures are above the industry average, indicating that ABC is profitable when looking
profits against sales and profits against assets. The indication is that ABC are able to control costs
in an efficient manner as well as make use of assets efficiently. The net profit margin has shown
positive values over the past five years, with growth in the net profit margin between December
2013 and December 2015.
Page | 4
⊘ This is a preview!⊘
Do you want full access?
Subscribe today to unlock all pages.
Trusted by 1+ million students worldwide
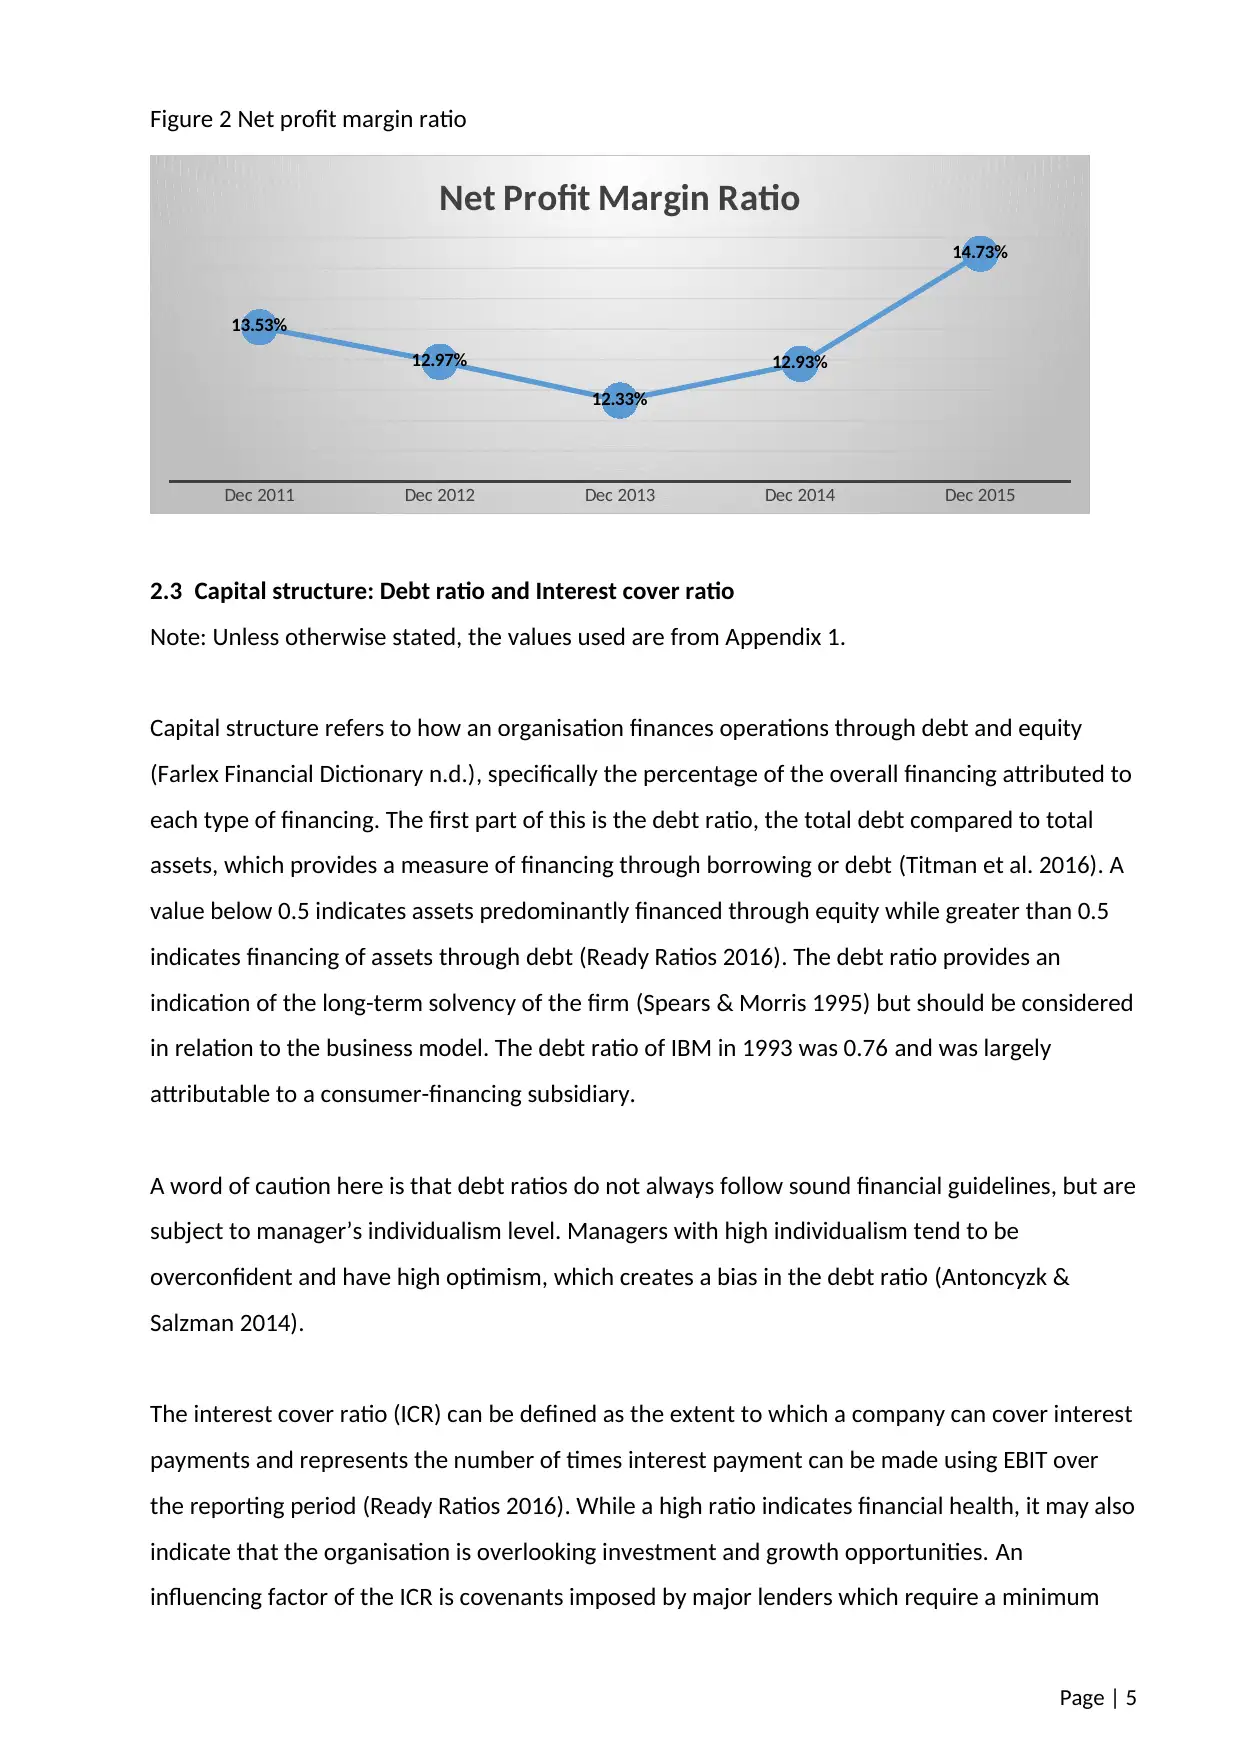
Figure 2 Net profit margin ratio
Dec 2011 Dec 2012 Dec 2013 Dec 2014 Dec 2015
13.53%
12.97%
12.33%
12.93%
14.73%
Net Profit Margin Ratio
2.3 Capital structure: Debt ratio and Interest cover ratio
Note: Unless otherwise stated, the values used are from Appendix 1.
Capital structure refers to how an organisation finances operations through debt and equity
(Farlex Financial Dictionary n.d.), specifically the percentage of the overall financing attributed to
each type of financing. The first part of this is the debt ratio, the total debt compared to total
assets, which provides a measure of financing through borrowing or debt (Titman et al. 2016). A
value below 0.5 indicates assets predominantly financed through equity while greater than 0.5
indicates financing of assets through debt (Ready Ratios 2016). The debt ratio provides an
indication of the long-term solvency of the firm (Spears & Morris 1995) but should be considered
in relation to the business model. The debt ratio of IBM in 1993 was 0.76 and was largely
attributable to a consumer-financing subsidiary.
A word of caution here is that debt ratios do not always follow sound financial guidelines, but are
subject to manager’s individualism level. Managers with high individualism tend to be
overconfident and have high optimism, which creates a bias in the debt ratio (Antoncyzk &
Salzman 2014).
The interest cover ratio (ICR) can be defined as the extent to which a company can cover interest
payments and represents the number of times interest payment can be made using EBIT over
the reporting period (Ready Ratios 2016). While a high ratio indicates financial health, it may also
indicate that the organisation is overlooking investment and growth opportunities. An
influencing factor of the ICR is covenants imposed by major lenders which require a minimum
Page | 5
Paraphrase This Document
Need a fresh take? Get an instant paraphrase of this document with our AI Paraphraser
level ICR be maintained by the firm resulting in the reduction of optimal leverage and lowers
distress costs (Dothan 2006).
The debt ratio for ABC indicates that 34.33% of assets are financed through debt, compared to
an industry average of 44.81%. This indicates that ABC has sufficient assets to support additional
borrowings for growth. In considering this position, the capability of ABC to cover interest
payments should be assessed. The interest cover rates for ABC is 20.70 times, well above the
industry average of 7.81 times. The higher than average ratio provides evidence that ABC is
capable of meeting interest payments easily.
2.4 Market value: Price-earning (P/E) ratio.
Note: Unless otherwise stated, the values used are from Appendix 1.
The price-earning (P/E) ratio is a widely used as a stock valuation measure and calculated by the
share price divided by the earnings per share. The P/E ratio is an expression of the value of
shares in relative terms, price per dollar earned, which allows us to compare various shares
(Titman et al. 2016). The variation between P/E ratios and shares can vary widely, attributable to
the risk and expected growth of the individual firms (Titman et al. 2016). Shares can be
evaluated using the P/E ratio at current market prices or alternatively calculated future value
using require P/E and estimated future earnings. The price assessed in this analysis is the daily
close price for the share. Other prices that are used include the opening price, daily high price
and daily low price.
The measure of the P/E ratio has been shown to provide an indication of real return over the
following 10 years (Weigand & Irons 2007). Siegel, cited in Weiand & Irons (2007), states that
high P/E ratios, due to earning decline, result in real return on equities average around 9.7% per
annum for the following five years. In contrast, high P/E ratios due to rising share prices display a
real return average of only 1.1%. Values between 20 and 25 for the P/E ratio are considered high
(Weigand & Irons 2007).
The P/E ratio for ABC as at 31 December 2015 was 14.84, with a minimum of 12.75 and
maximum of 15.49 for the period December 2011 to December 2015. The growth of dividends is
a contributor towards a higher P/E ratio (Titman et al. 2016). ABC have consistently paid
dividends over the past five years, however the growth of dividends has remained at zero
Page | 6
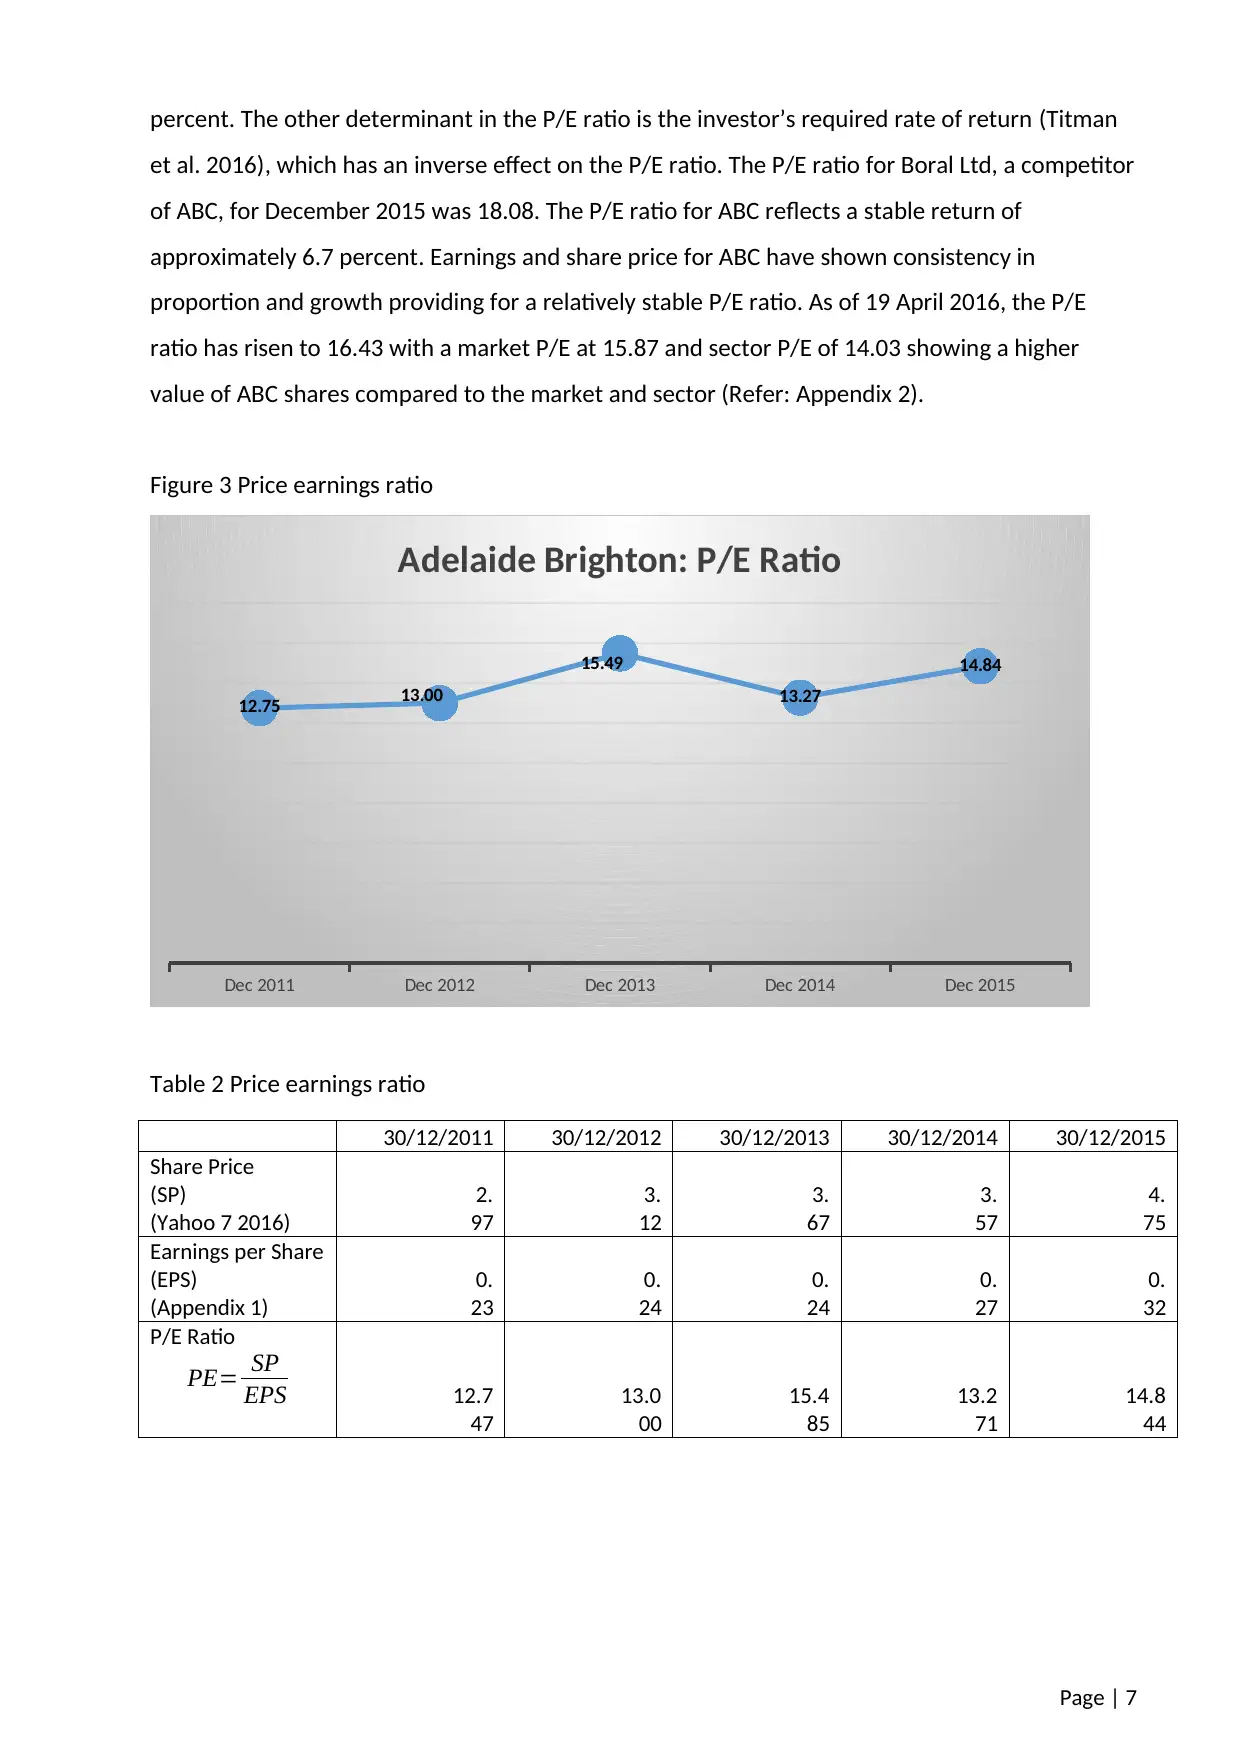
percent. The other determinant in the P/E ratio is the investor’s required rate of return (Titman
et al. 2016), which has an inverse effect on the P/E ratio. The P/E ratio for Boral Ltd, a competitor
of ABC, for December 2015 was 18.08. The P/E ratio for ABC reflects a stable return of
approximately 6.7 percent. Earnings and share price for ABC have shown consistency in
proportion and growth providing for a relatively stable P/E ratio. As of 19 April 2016, the P/E
ratio has risen to 16.43 with a market P/E at 15.87 and sector P/E of 14.03 showing a higher
value of ABC shares compared to the market and sector (Refer: Appendix 2).
Figure 3 Price earnings ratio
Dec 2011 Dec 2012 Dec 2013 Dec 2014 Dec 2015
12.75 13.00
15.49
13.27
14.84
Adelaide Brighton: P/E Ratio
Table 2 Price earnings ratio
30/12/2011 30/12/2012 30/12/2013 30/12/2014 30/12/2015
Share Price
(SP)
(Yahoo 7 2016)
2.
97
3.
12
3.
67
3.
57
4.
75
Earnings per Share
(EPS)
(Appendix 1)
0.
23
0.
24
0.
24
0.
27
0.
32
P/E Ratio
PE= SP
EPS 12.7
47
13.0
00
15.4
85
13.2
71
14.8
44
Page | 7
⊘ This is a preview!⊘
Do you want full access?
Subscribe today to unlock all pages.
Trusted by 1+ million students worldwide
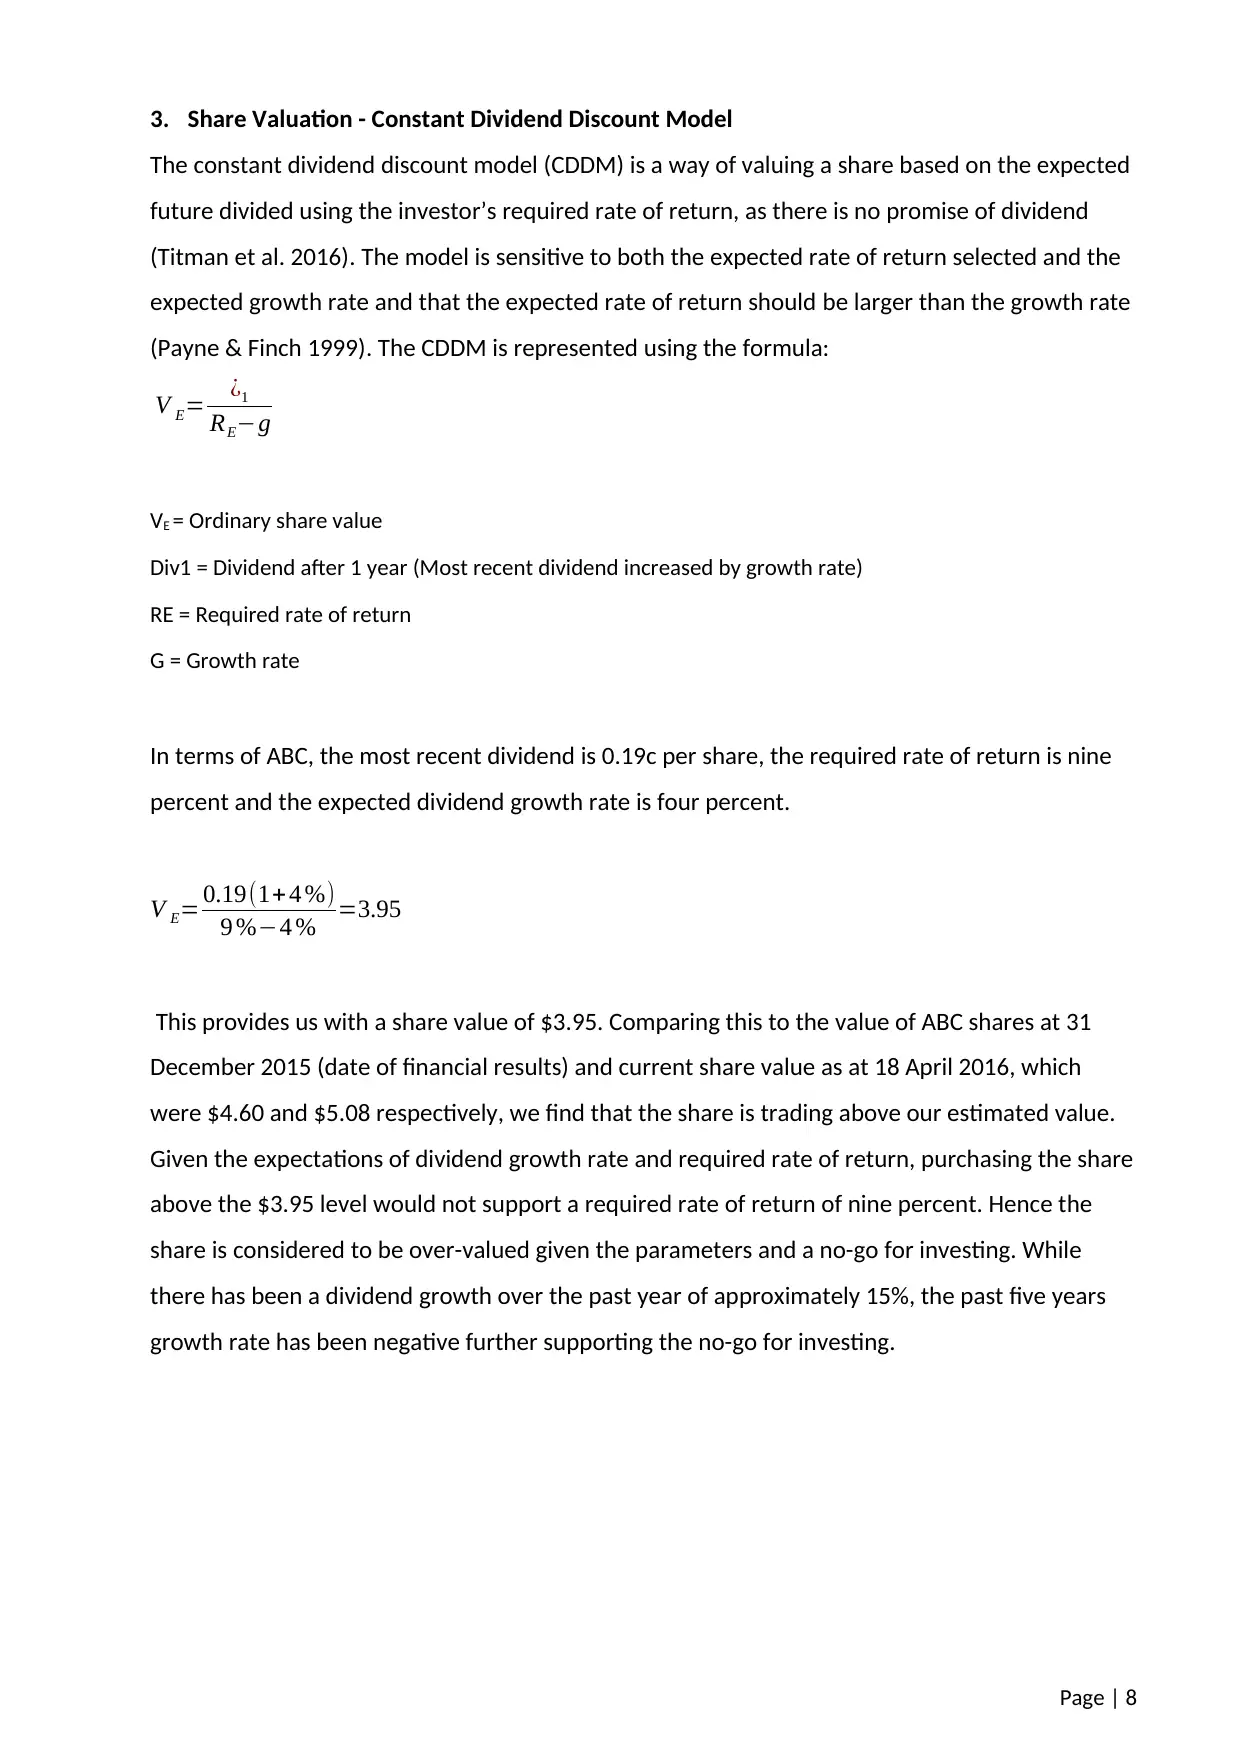
3. Share Valuation - Constant Dividend Discount Model
The constant dividend discount model (CDDM) is a way of valuing a share based on the expected
future divided using the investor’s required rate of return, as there is no promise of dividend
(Titman et al. 2016). The model is sensitive to both the expected rate of return selected and the
expected growth rate and that the expected rate of return should be larger than the growth rate
(Payne & Finch 1999). The CDDM is represented using the formula:
V E= ¿1
RE−g
VE = Ordinary share value
Div1 = Dividend after 1 year (Most recent dividend increased by growth rate)
RE = Required rate of return
G = Growth rate
In terms of ABC, the most recent dividend is 0.19c per share, the required rate of return is nine
percent and the expected dividend growth rate is four percent.
V E= 0.19(1+ 4 %)
9 %−4 % =3.95
This provides us with a share value of $3.95. Comparing this to the value of ABC shares at 31
December 2015 (date of financial results) and current share value as at 18 April 2016, which
were $4.60 and $5.08 respectively, we find that the share is trading above our estimated value.
Given the expectations of dividend growth rate and required rate of return, purchasing the share
above the $3.95 level would not support a required rate of return of nine percent. Hence the
share is considered to be over-valued given the parameters and a no-go for investing. While
there has been a dividend growth over the past year of approximately 15%, the past five years
growth rate has been negative further supporting the no-go for investing.
Page | 8
Paraphrase This Document
Need a fresh take? Get an instant paraphrase of this document with our AI Paraphraser
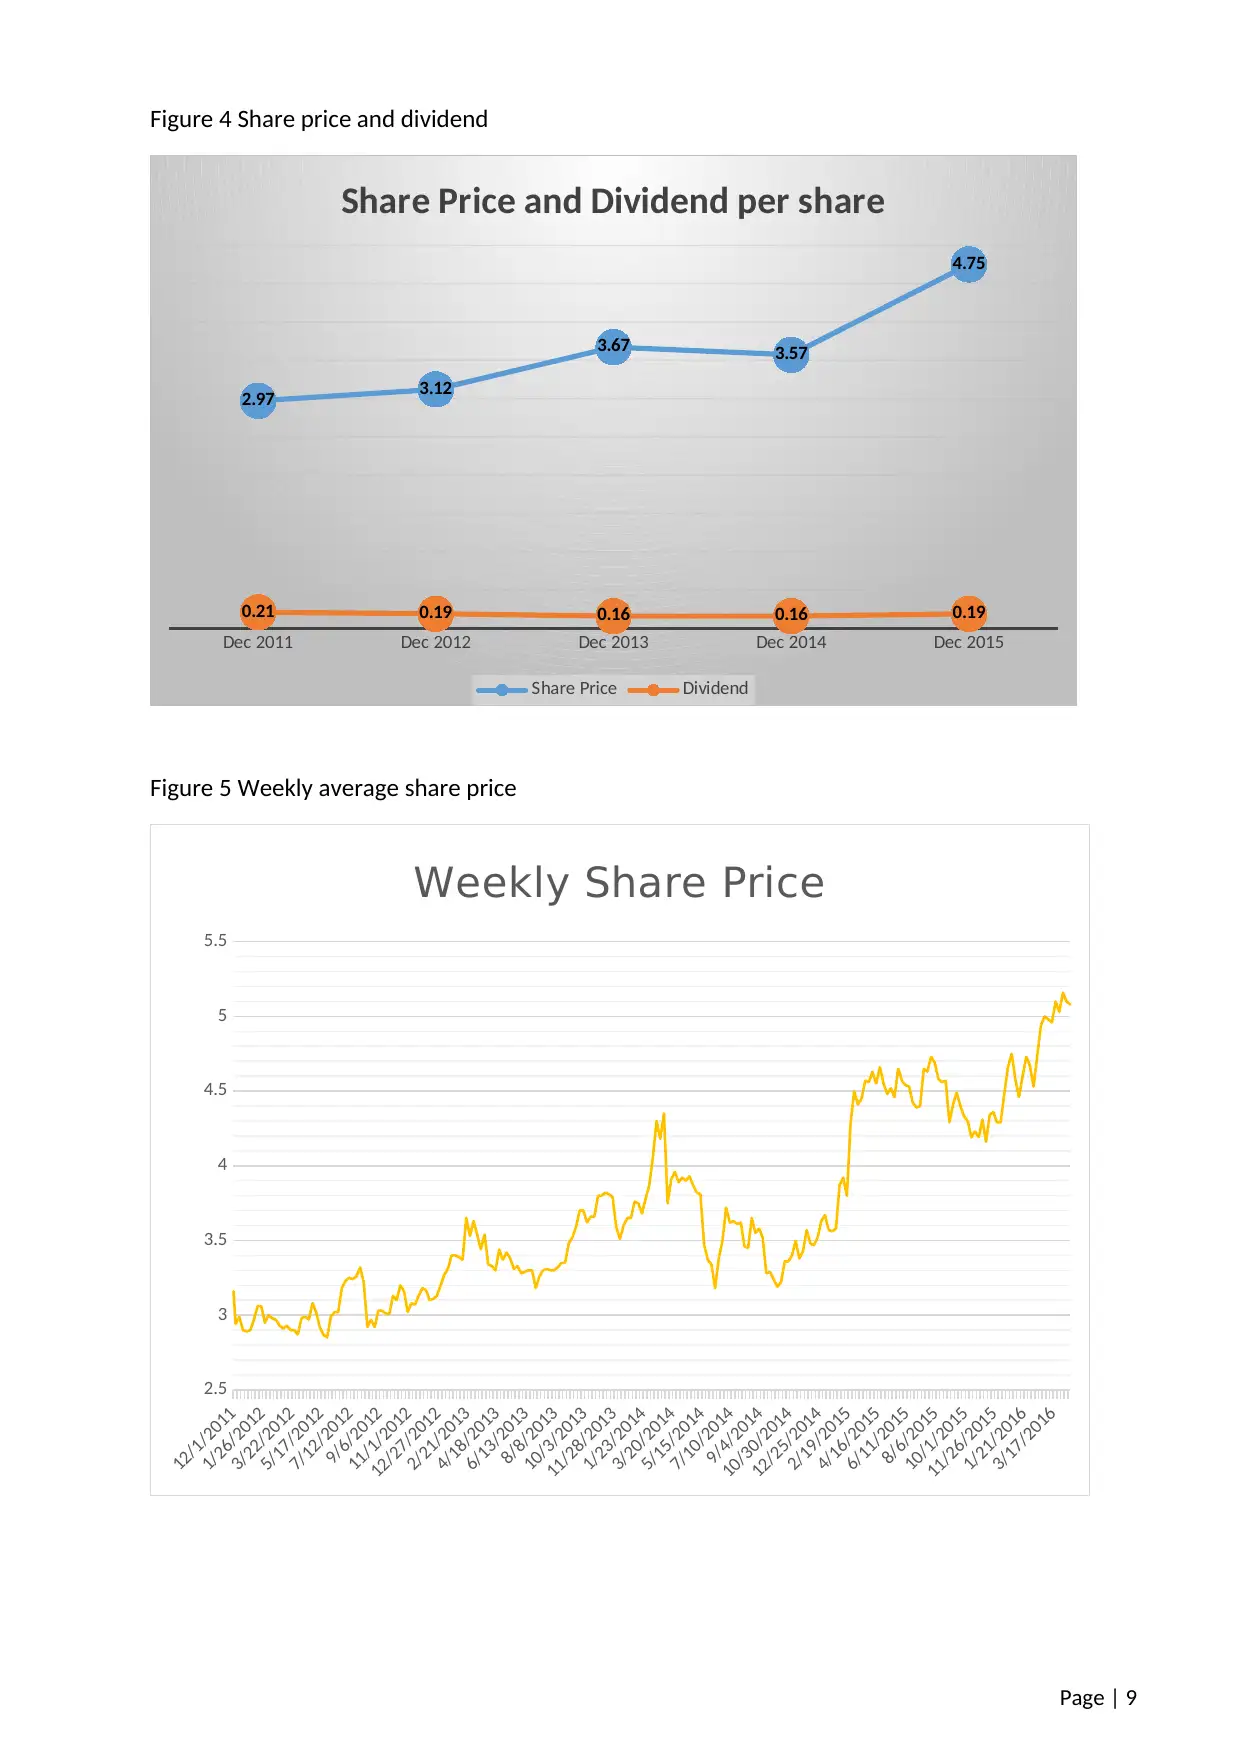
Figure 4 Share price and dividend
Dec 2011 Dec 2012 Dec 2013 Dec 2014 Dec 2015
2.97 3.12
3.67 3.57
4.75
0.21 0.19 0.16 0.16 0.19
Share Price and Dividend per share
Share Price Dividend
Figure 5 Weekly average share price
12/1/2011
1/26/2012
3/22/2012
5/17/2012
7/12/2012
9/6/2012
11/1/2012
12/27/2012
2/21/2013
4/18/2013
6/13/2013
8/8/2013
10/3/2013
11/28/2013
1/23/2014
3/20/2014
5/15/2014
7/10/2014
9/4/2014
10/30/2014
12/25/2014
2/19/2015
4/16/2015
6/11/2015
8/6/2015
10/1/2015
11/26/2015
1/21/2016
3/17/2016
2.5
3
3.5
4
4.5
5
5.5
Weekly Share Price
Page | 9
4. Recommendation
Adelaide Brighton is in a liquid position showing a current ratio of 2.25, and is in a position to
support the vertical integration strategy (Brydon 2015). Although there have been some land
sales totalling AUD 48 million, there has also been investment in operations and the purchase of
additional quarries. The outlook from a liquidity perspective is positive and supports an
investment decision from a liquidity perspective.
The above industry net profit margin and an increase in the return on assets supports the
statement in the annual general meeting report that ABC have invested in making operations
more efficient (Brydon 2015). ABC have engaged in a strategy of vertical integration (Brydon
2015), providing improved returns while keeping asset and liability variations to a minimum. ABC
retains a competitive advantage in the industry with efficient use of assts. A decision to invest
based on a profitability perspective is supported by the net profit margin and return on assets.
The capital structure reflects financing that has an equity bias. There is potential for additional
growth of the company through debt financing. The interest cover ratio adequately provides for
existing interest payments and can further service additional debt. The capital structure of ABC
further supports investment decision from a capital growth perspective in the long term.
The share market is a reflection of the overall performance of the firm and the perception of risk
in the firm by investors. The P/E ratio for ABC has remained consistent over the past five years
with a variance of 1.19 indicating stability in earnings and price growth with static risk
assessment. Investment from market perspective is that ABC is suited to long term investment
with predictable dividends and stable growth with low risk. Note that short term (less than three
years) investing shows little correlation between the P/E ratio and average returns, with long
term (five or more years) showing lower returns when P/E ratios are high (Trevino & Robertson
2002). This supports a long term investment strategy in ABC.
The CDDM provides a level of share value given the expectations of share and company
performance in terms of dividend payout. The share value calculated using CDDM is below the
market value and thus the final recommendation would be to not invest in Adelaide Brighton
Ltd.
Page | 10
⊘ This is a preview!⊘
Do you want full access?
Subscribe today to unlock all pages.
Trusted by 1+ million students worldwide
1 out of 24
Related Documents


Your All-in-One AI-Powered Toolkit for Academic Success.
+13062052269
info@desklib.com
Available 24*7 on WhatsApp / Email
![[object Object]](/_next/static/media/star-bottom.7253800d.svg)
Unlock your academic potential
Copyright © 2020–2026 A2Z Services. All Rights Reserved. Developed and managed by ZUCOL.