Finance Report: Adelaide Brighton Cement Financial Analysis
VerifiedAdded on 2021/06/17
|20
|4212
|65
Report
AI Summary
This report provides a comprehensive financial analysis of Adelaide Brighton Cement, an Australian cement manufacturing group. It examines the company's ownership structure, including substantial shareholders and key governance personnel. The report computes various financial ratios, including short-term and long-term solvency, asset utilization, profitability, and market value ratios. It presents graphical descriptions of share price movements and compares them to the All Ords Index, identifying factors influencing the share price. Furthermore, it calculates the company's Beta and expected rate of return using the CAPM model, justifying a conservative investment approach. The report also discusses the weighted average cost of capital (WACC), debt ratio, and dividend policy, offering recommendations for investment in Adelaide Brighton Cement.
Running head: FINANCE FOR BUSINESS
Finance for Business
Name of the Student
Name of the University
Authors Note
Course ID
Finance for Business
Name of the Student
Name of the University
Authors Note
Course ID
Paraphrase This Document
Need a fresh take? Get an instant paraphrase of this document with our AI Paraphraser
1FINANCE FOR BUSINESS
Table of Contents
Introduction:...............................................................................................................................3
Description of Company:...........................................................................................................3
Ownership and structure of governance of the company:..........................................................4
Main Substantial Shareholders:..............................................................................................4
Main people involved in Company’s Governance:................................................................5
Computation of Fundamental Ratios:........................................................................................7
Short Term Solvency:............................................................................................................7
Long Term Solvency:.............................................................................................................7
Asset Utilization:....................................................................................................................8
Profitability Ratios:................................................................................................................8
Market Value Ratios:.............................................................................................................9
Graphical Descriptions of Results:.............................................................................................9
Movement in Monthly Share Price:.......................................................................................9
Comparative Analysis of Movement in Share Price Index to All Ords Index:........................10
Identifications of factors that influences the share price of the company:...........................10
Calculations of Beta and the Expected Rate of Returns using CAPM:...................................12
Computed Beta of the Company:.........................................................................................12
Calculations of the required rate of Return using CAPM Model:.......................................12
Justification behind the “Conservative Investment”............................................................12
Explanation of WACC has on management evaluation of investment prospective:...............14
2FINANCE FOR BUSINESS
Debt Ratio:...............................................................................................................................14
Dividend policy:.......................................................................................................................15
Letter of Recommendations.....................................................................................................15
Conclusion:..............................................................................................................................16
References................................................................................................................................18
⊘ This is a preview!⊘
Do you want full access?
Subscribe today to unlock all pages.
Trusted by 1+ million students worldwide
3FINANCE FOR BUSINESS
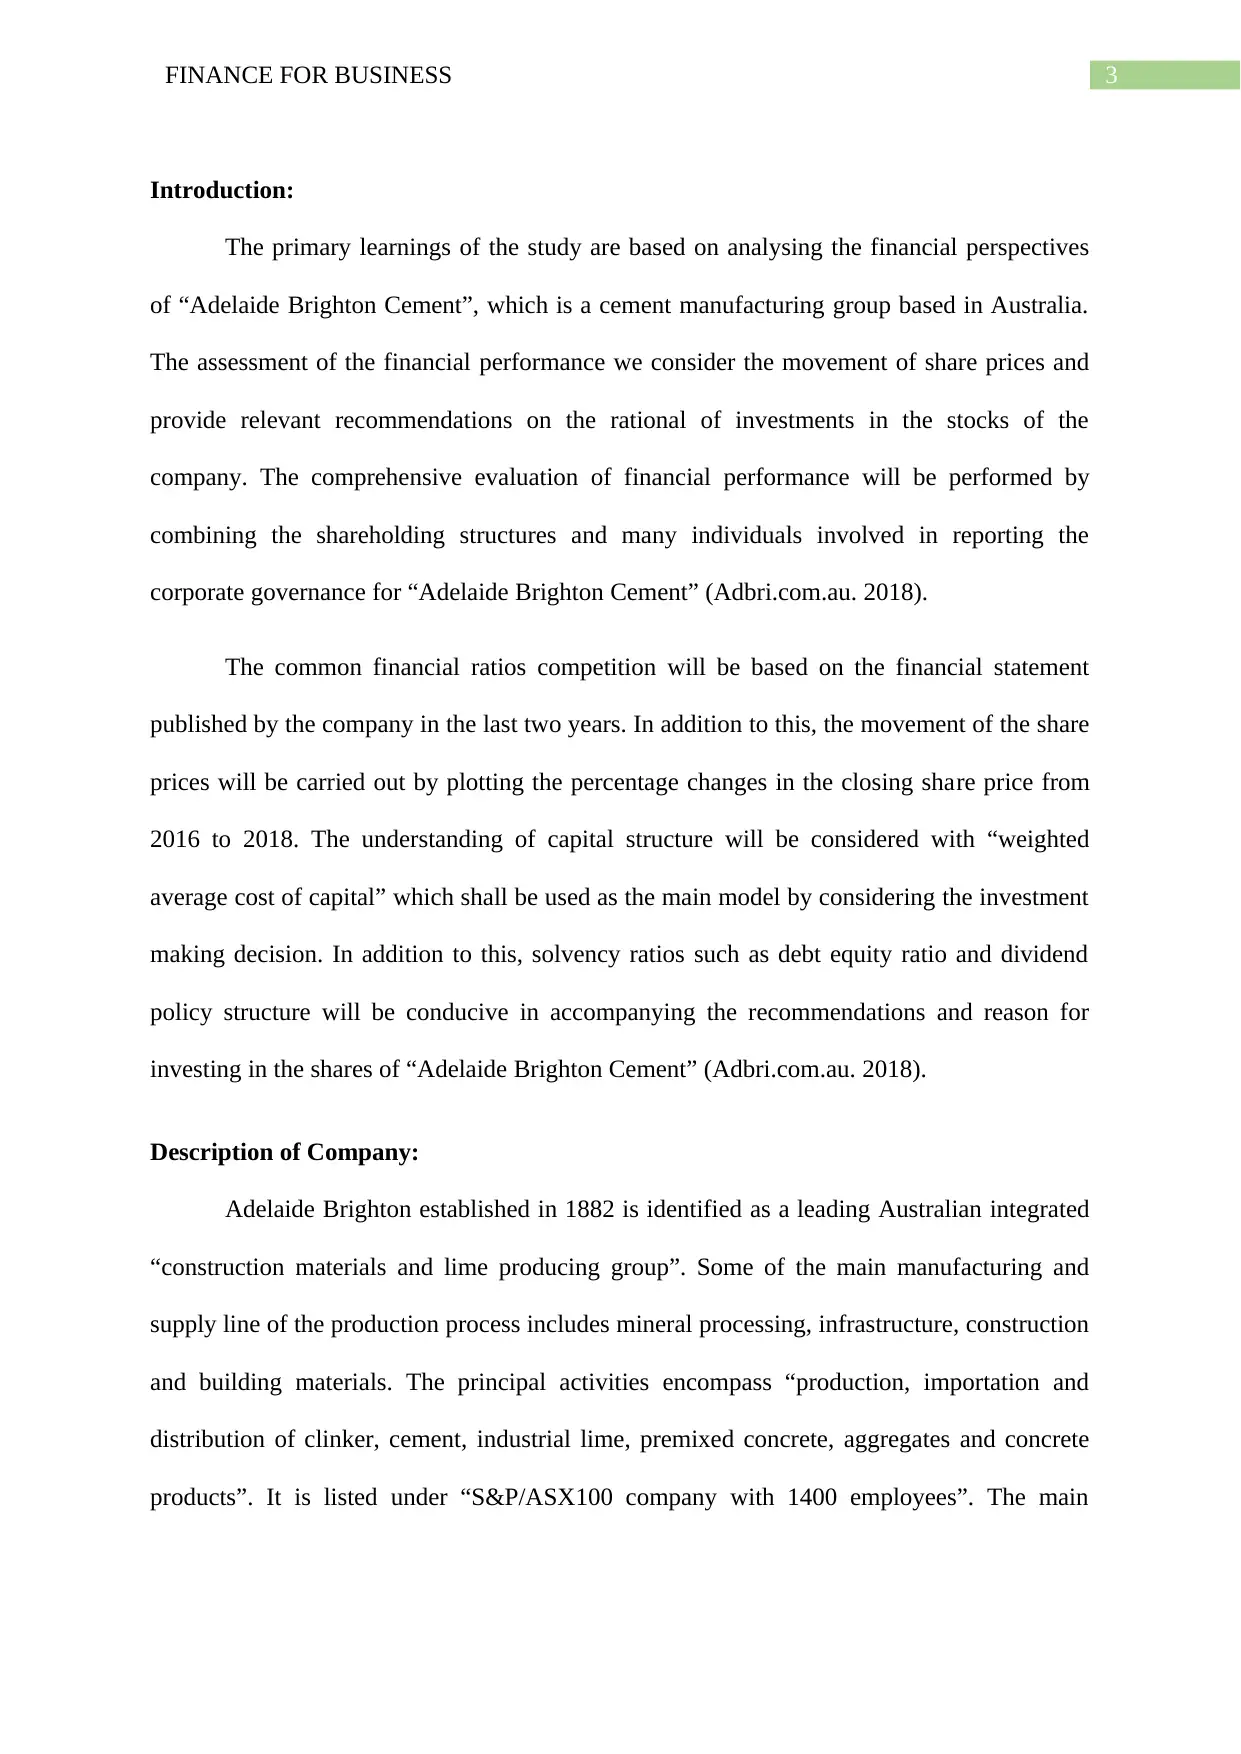
Introduction:
The primary learnings of the study are based on analysing the financial perspectives
of “Adelaide Brighton Cement”, which is a cement manufacturing group based in Australia.
The assessment of the financial performance we consider the movement of share prices and
provide relevant recommendations on the rational of investments in the stocks of the
company. The comprehensive evaluation of financial performance will be performed by
combining the shareholding structures and many individuals involved in reporting the
corporate governance for “Adelaide Brighton Cement” (Adbri.com.au. 2018).
The common financial ratios competition will be based on the financial statement
published by the company in the last two years. In addition to this, the movement of the share
prices will be carried out by plotting the percentage changes in the closing share price from
2016 to 2018. The understanding of capital structure will be considered with “weighted
average cost of capital” which shall be used as the main model by considering the investment
making decision. In addition to this, solvency ratios such as debt equity ratio and dividend
policy structure will be conducive in accompanying the recommendations and reason for
investing in the shares of “Adelaide Brighton Cement” (Adbri.com.au. 2018).
Description of Company:
Adelaide Brighton established in 1882 is identified as a leading Australian integrated
“construction materials and lime producing group”. Some of the main manufacturing and
supply line of the production process includes mineral processing, infrastructure, construction
and building materials. The principal activities encompass “production, importation and
distribution of clinker, cement, industrial lime, premixed concrete, aggregates and concrete
products”. It is listed under “S&P/ASX100 company with 1400 employees”. The main
Paraphrase This Document
Need a fresh take? Get an instant paraphrase of this document with our AI Paraphraser
4FINANCE FOR BUSINESS
culture of the companies seen to be culturally diverse and built on an environment friendly
work atmosphere (Adbri.com.au. 2018).
Adelaide Brighton has distribution and manufacturing facilities across South
Australia, in areas including “Northern Territory, Fyansford, Victoria and New South
Wales”. Some of the importance of plate end of the products of Adelaide Brighton is
discerned with “building, construction, infrastructure and mineral processing” throughout the
country. In terms of cement it has major production facilities across “Western Australia and
South Australia”. It is also considered as a market leader in Northern Territory. Apart from
excelling in terms of domestic production, Adelaide Brighton is also recognized as the largest
importer of “cement, clinker and slag” (Adbri.com.au. 2018). The coastal network of the
company is depicted to supply across every capital city located in the mainland. The lime
production facilities of the company are concentrated in the production plants of “South
Australia, Northern Territory and Western Australia”. The company is further seen to be
committed to follow an inclusive workplace culture which promotes diversity and values.
Adelaide Brighton is identified with one of the best “diverse workforce, extending across
different cultures, backgrounds, nationalities and languages” (Adbri.com.au. 2018).
Some of the other sustainability initiatives is presented in terms of range of initiatives
and actions that are implemented throughout organizations. It is believed that the
sustainability aspect is not only the responsibility for environment but also is seen to be
economically beneficial thereby assisting the various types of long-term commitment for a
prolonged business performance (Adbri.com.au. 2018).
5FINANCE FOR BUSINESS
Ownership and structure of governance of the company:
Main Substantial Shareholders:
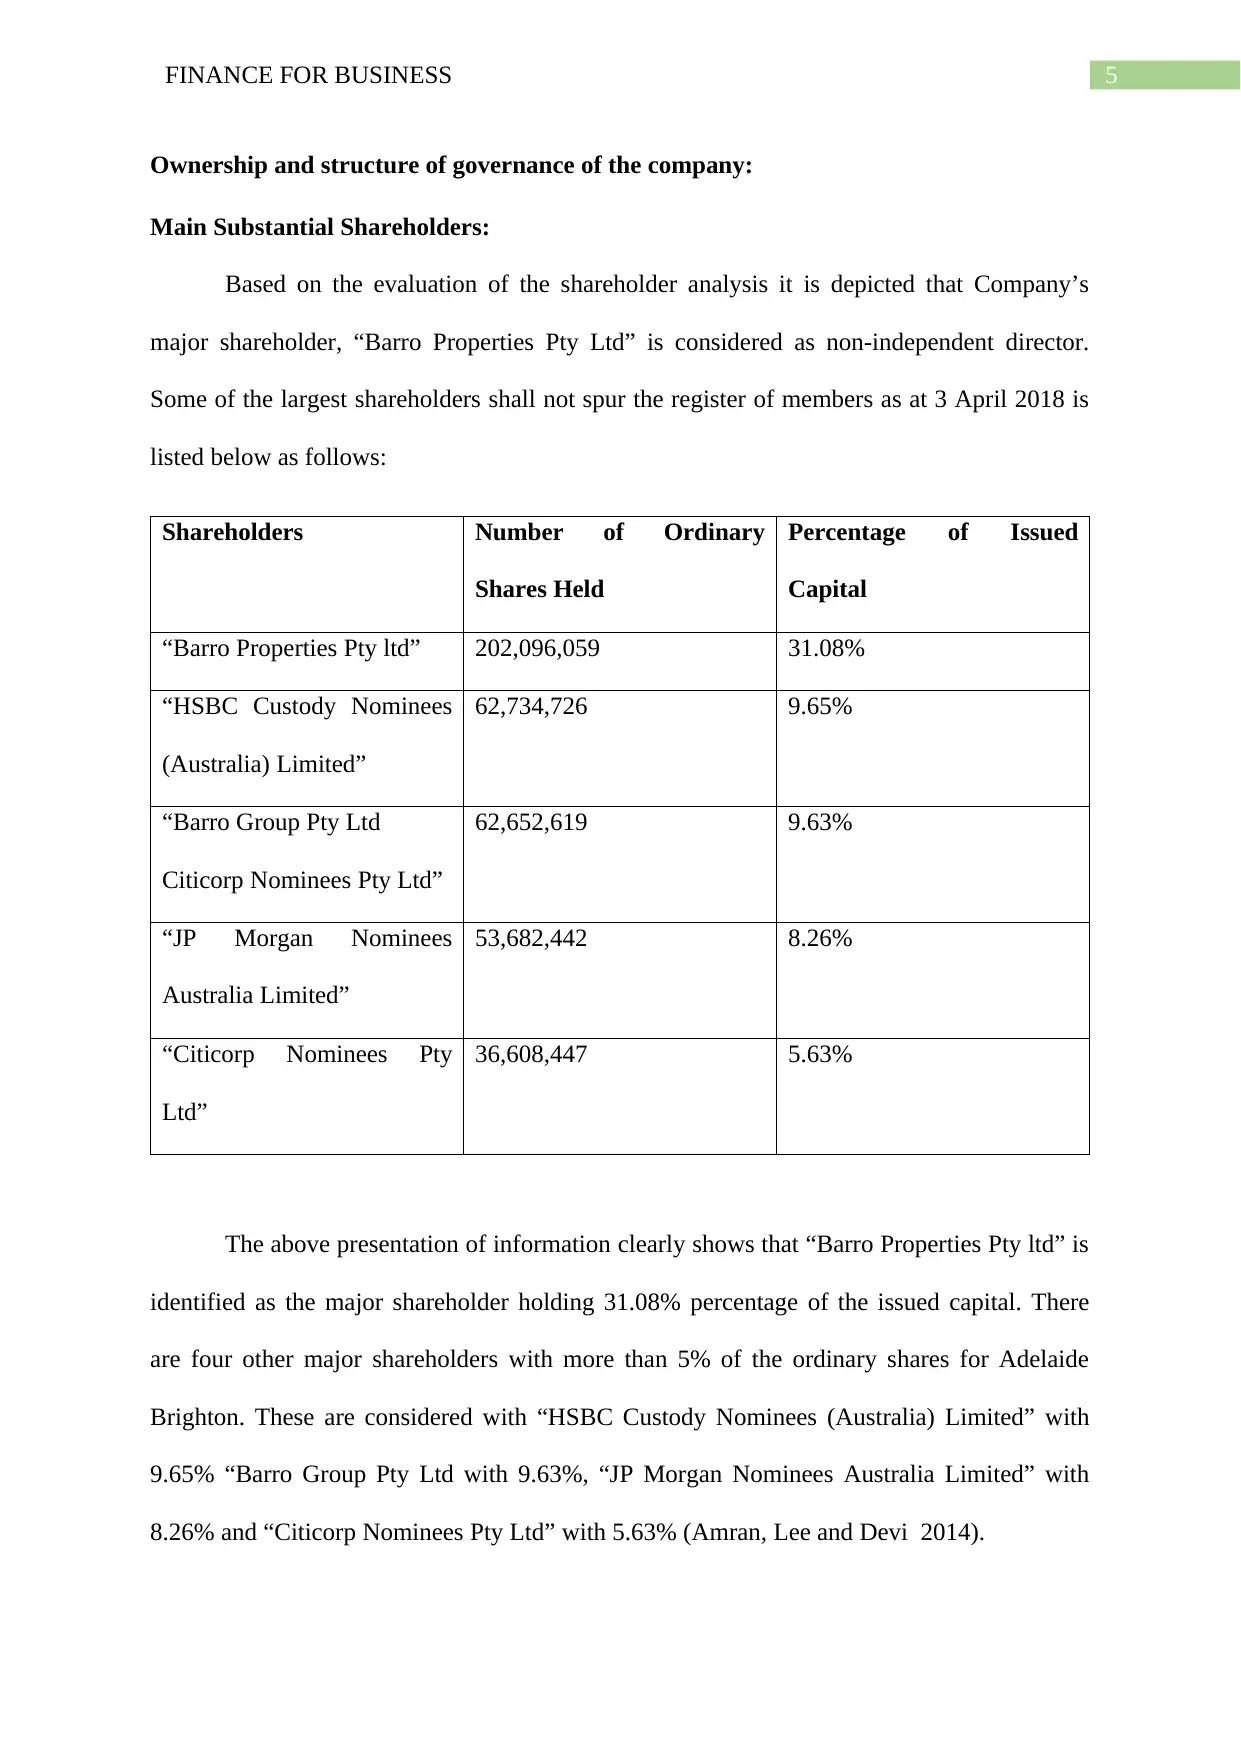
Based on the evaluation of the shareholder analysis it is depicted that Company’s
major shareholder, “Barro Properties Pty Ltd” is considered as non-independent director.
Some of the largest shareholders shall not spur the register of members as at 3 April 2018 is
listed below as follows:
Shareholders Number of Ordinary
Shares Held
Percentage of Issued
Capital
“Barro Properties Pty ltd” 202,096,059 31.08%
“HSBC Custody Nominees
(Australia) Limited”
62,734,726 9.65%
“Barro Group Pty Ltd
Citicorp Nominees Pty Ltd”
62,652,619 9.63%
“JP Morgan Nominees
Australia Limited”
53,682,442 8.26%
“Citicorp Nominees Pty
Ltd”
36,608,447 5.63%
The above presentation of information clearly shows that “Barro Properties Pty ltd” is
identified as the major shareholder holding 31.08% percentage of the issued capital. There
are four other major shareholders with more than 5% of the ordinary shares for Adelaide
Brighton. These are considered with “HSBC Custody Nominees (Australia) Limited” with
9.65% “Barro Group Pty Ltd with 9.63%, “JP Morgan Nominees Australia Limited” with
8.26% and “Citicorp Nominees Pty Ltd” with 5.63% (Amran, Lee and Devi 2014).
Ownership and structure of governance of the company:
Main Substantial Shareholders:
Based on the evaluation of the shareholder analysis it is depicted that Company’s
major shareholder, “Barro Properties Pty Ltd” is considered as non-independent director.
Some of the largest shareholders shall not spur the register of members as at 3 April 2018 is
listed below as follows:
Shareholders Number of Ordinary
Shares Held
Percentage of Issued
Capital
“Barro Properties Pty ltd” 202,096,059 31.08%
“HSBC Custody Nominees
(Australia) Limited”
62,734,726 9.65%
“Barro Group Pty Ltd
Citicorp Nominees Pty Ltd”
62,652,619 9.63%
“JP Morgan Nominees
Australia Limited”
53,682,442 8.26%
“Citicorp Nominees Pty
Ltd”
36,608,447 5.63%
The above presentation of information clearly shows that “Barro Properties Pty ltd” is
identified as the major shareholder holding 31.08% percentage of the issued capital. There
are four other major shareholders with more than 5% of the ordinary shares for Adelaide
Brighton. These are considered with “HSBC Custody Nominees (Australia) Limited” with
9.65% “Barro Group Pty Ltd with 9.63%, “JP Morgan Nominees Australia Limited” with
8.26% and “Citicorp Nominees Pty Ltd” with 5.63% (Amran, Lee and Devi 2014).
⊘ This is a preview!⊘
Do you want full access?
Subscribe today to unlock all pages.
Trusted by 1+ million students worldwide
6FINANCE FOR BUSINESS
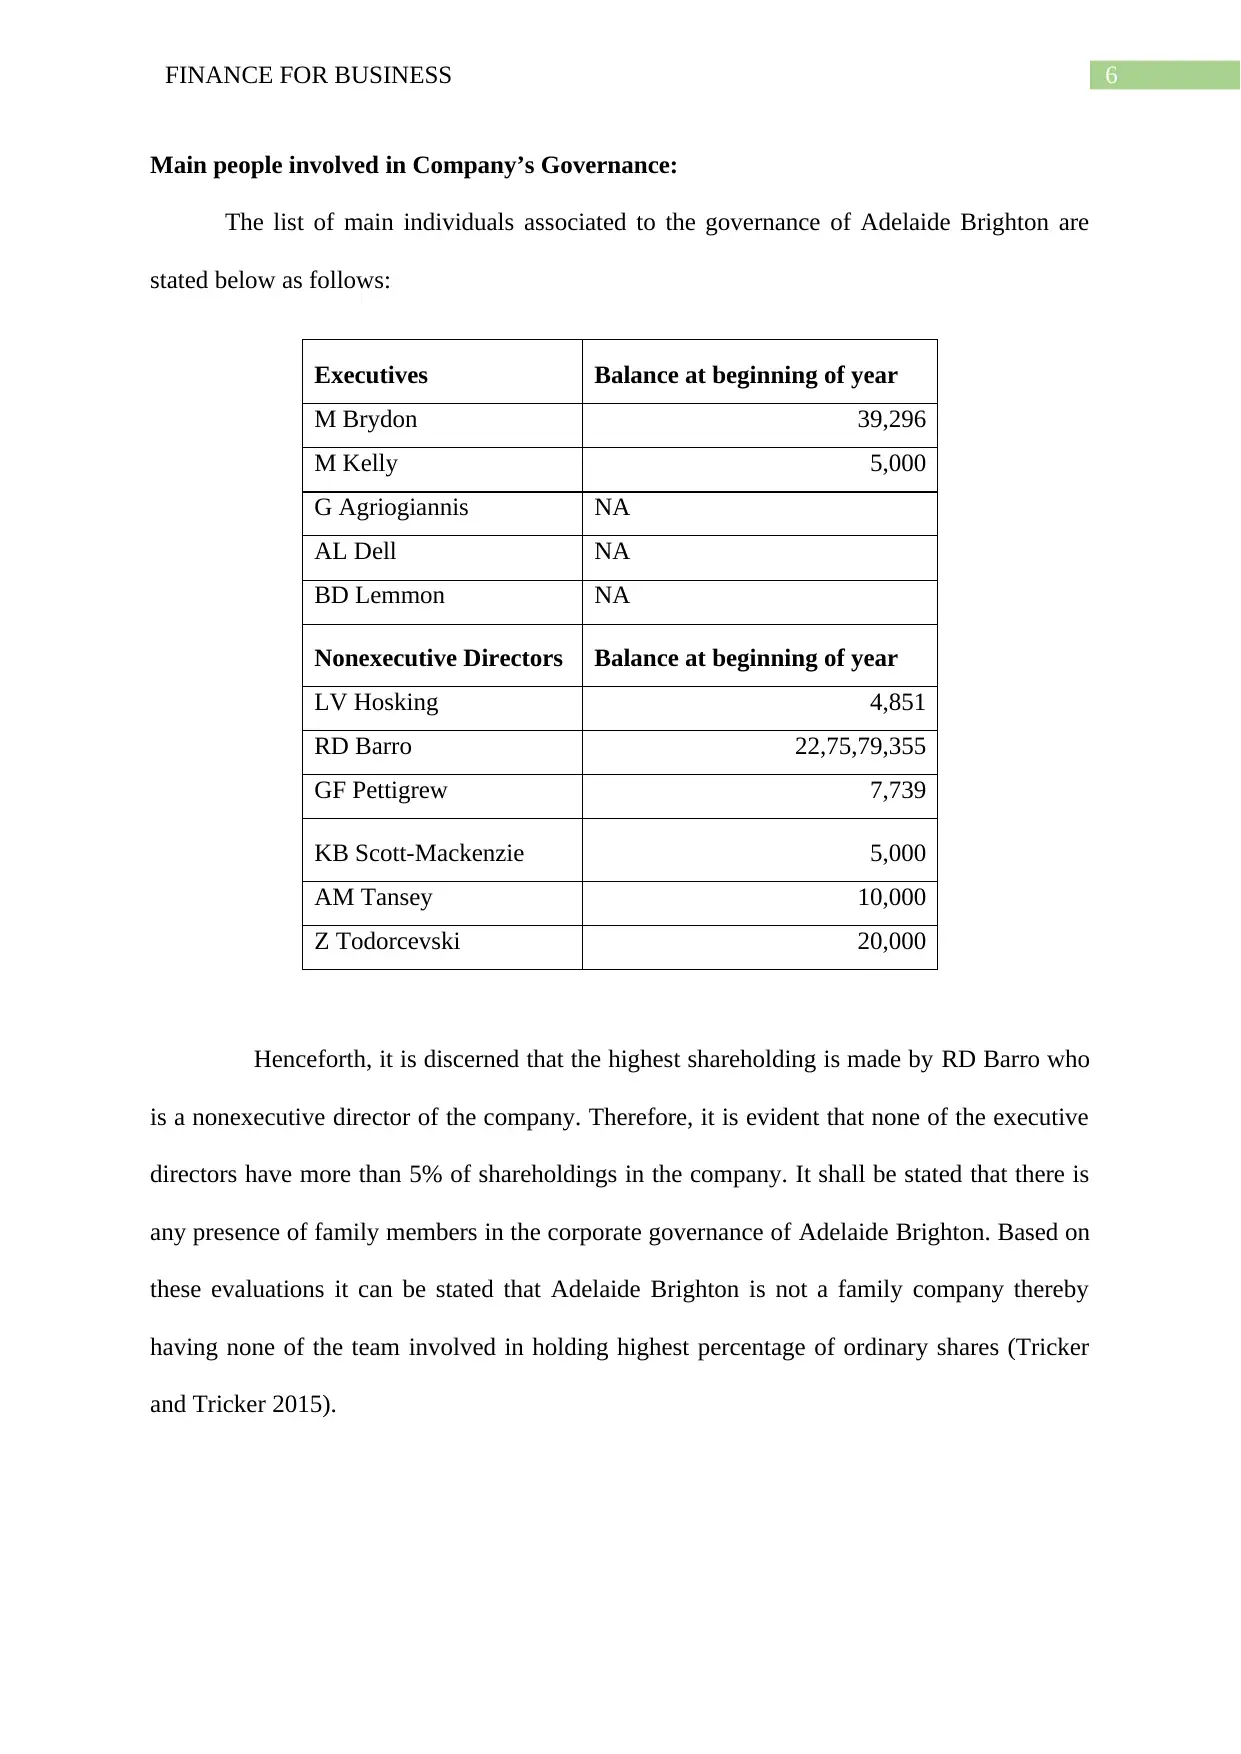
Main people involved in Company’s Governance:
The list of main individuals associated to the governance of Adelaide Brighton are
stated below as follows:
Executives Balance at beginning of year
M Brydon 39,296
M Kelly 5,000
G Agriogiannis NA
AL Dell NA
BD Lemmon NA
Nonexecutive Directors Balance at beginning of year
LV Hosking 4,851
RD Barro 22,75,79,355
GF Pettigrew 7,739
KB Scott-Mackenzie 5,000
AM Tansey 10,000
Z Todorcevski 20,000
Henceforth, it is discerned that the highest shareholding is made by RD Barro who
is a nonexecutive director of the company. Therefore, it is evident that none of the executive
directors have more than 5% of shareholdings in the company. It shall be stated that there is
any presence of family members in the corporate governance of Adelaide Brighton. Based on
these evaluations it can be stated that Adelaide Brighton is not a family company thereby
having none of the team involved in holding highest percentage of ordinary shares (Tricker
and Tricker 2015).
Paraphrase This Document
Need a fresh take? Get an instant paraphrase of this document with our AI Paraphraser
7FINANCE FOR BUSINESS
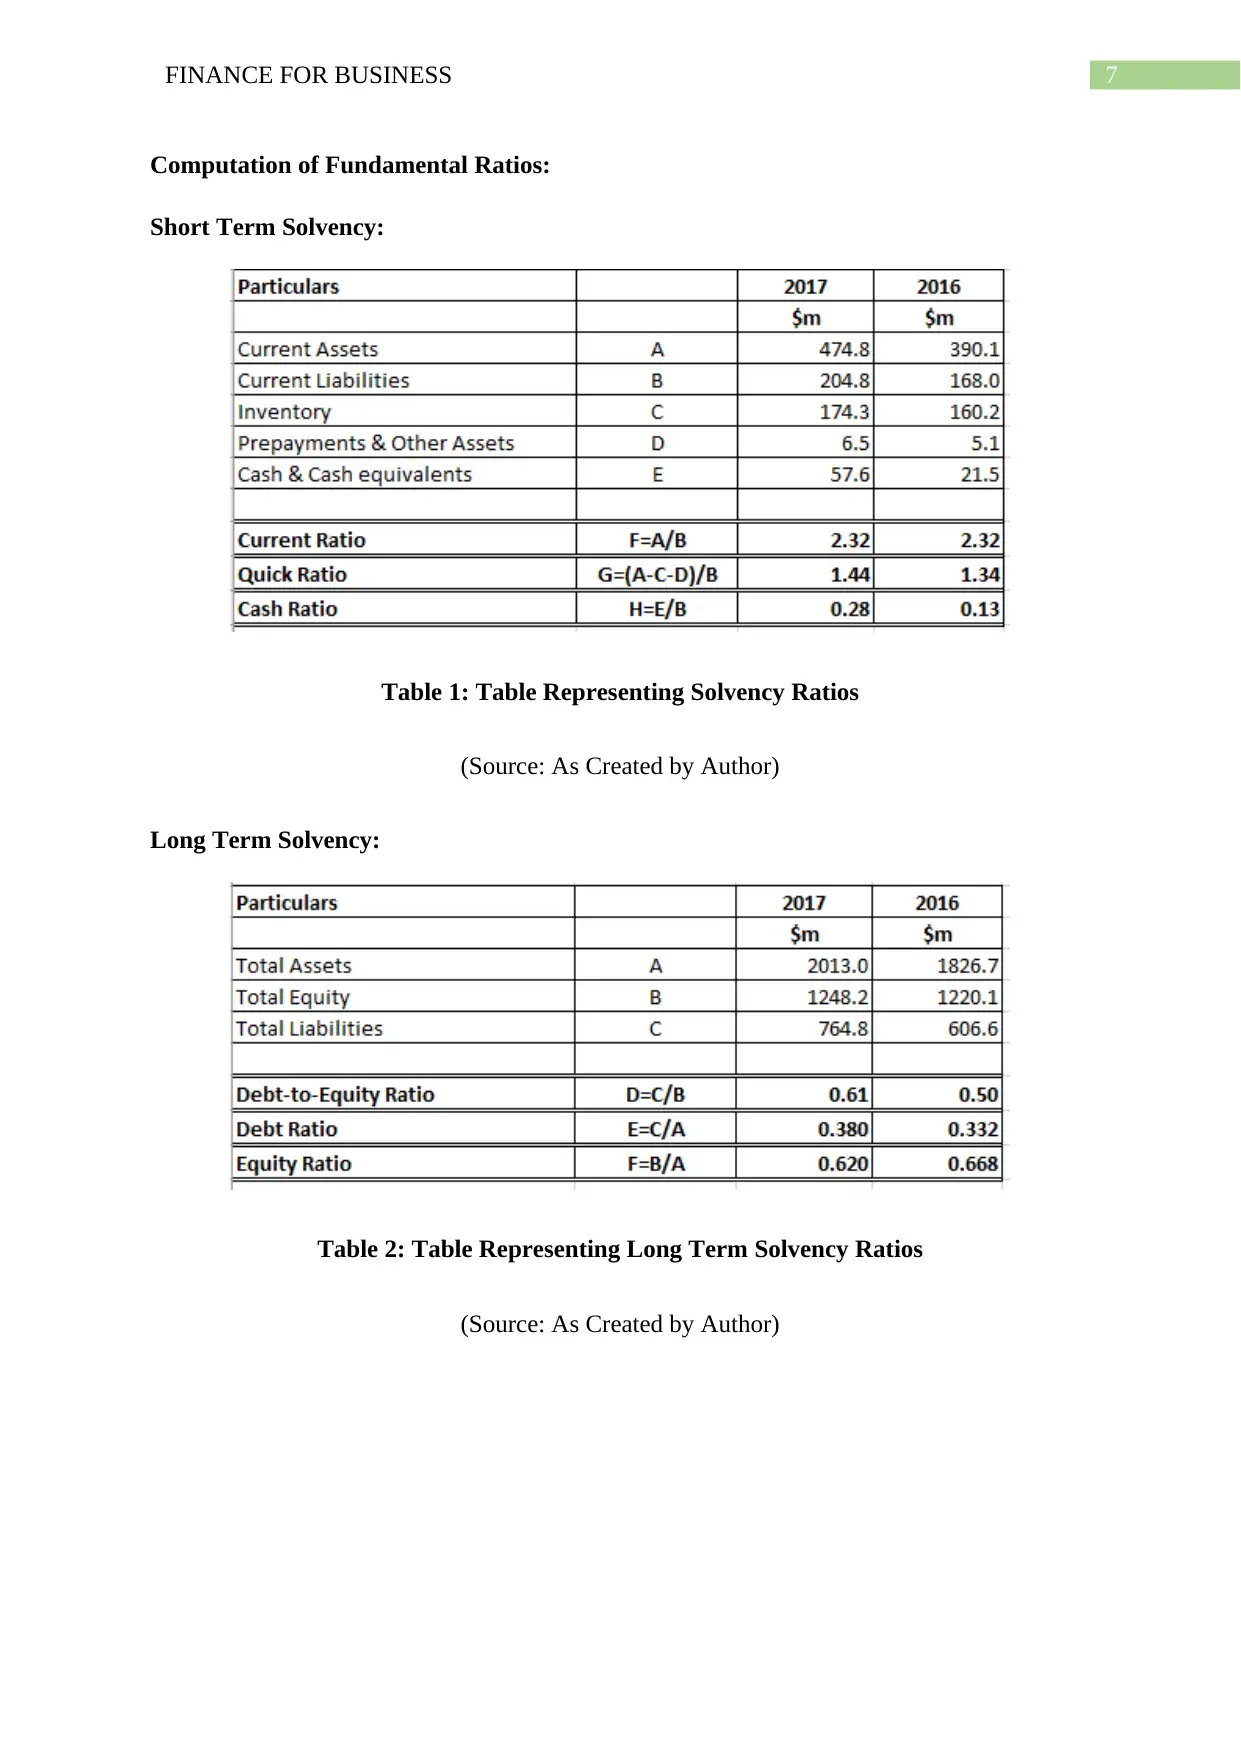
Computation of Fundamental Ratios:
Short Term Solvency:
Table 1: Table Representing Solvency Ratios
(Source: As Created by Author)
Long Term Solvency:
Table 2: Table Representing Long Term Solvency Ratios
(Source: As Created by Author)
Computation of Fundamental Ratios:
Short Term Solvency:
Table 1: Table Representing Solvency Ratios
(Source: As Created by Author)
Long Term Solvency:
Table 2: Table Representing Long Term Solvency Ratios
(Source: As Created by Author)
8FINANCE FOR BUSINESS
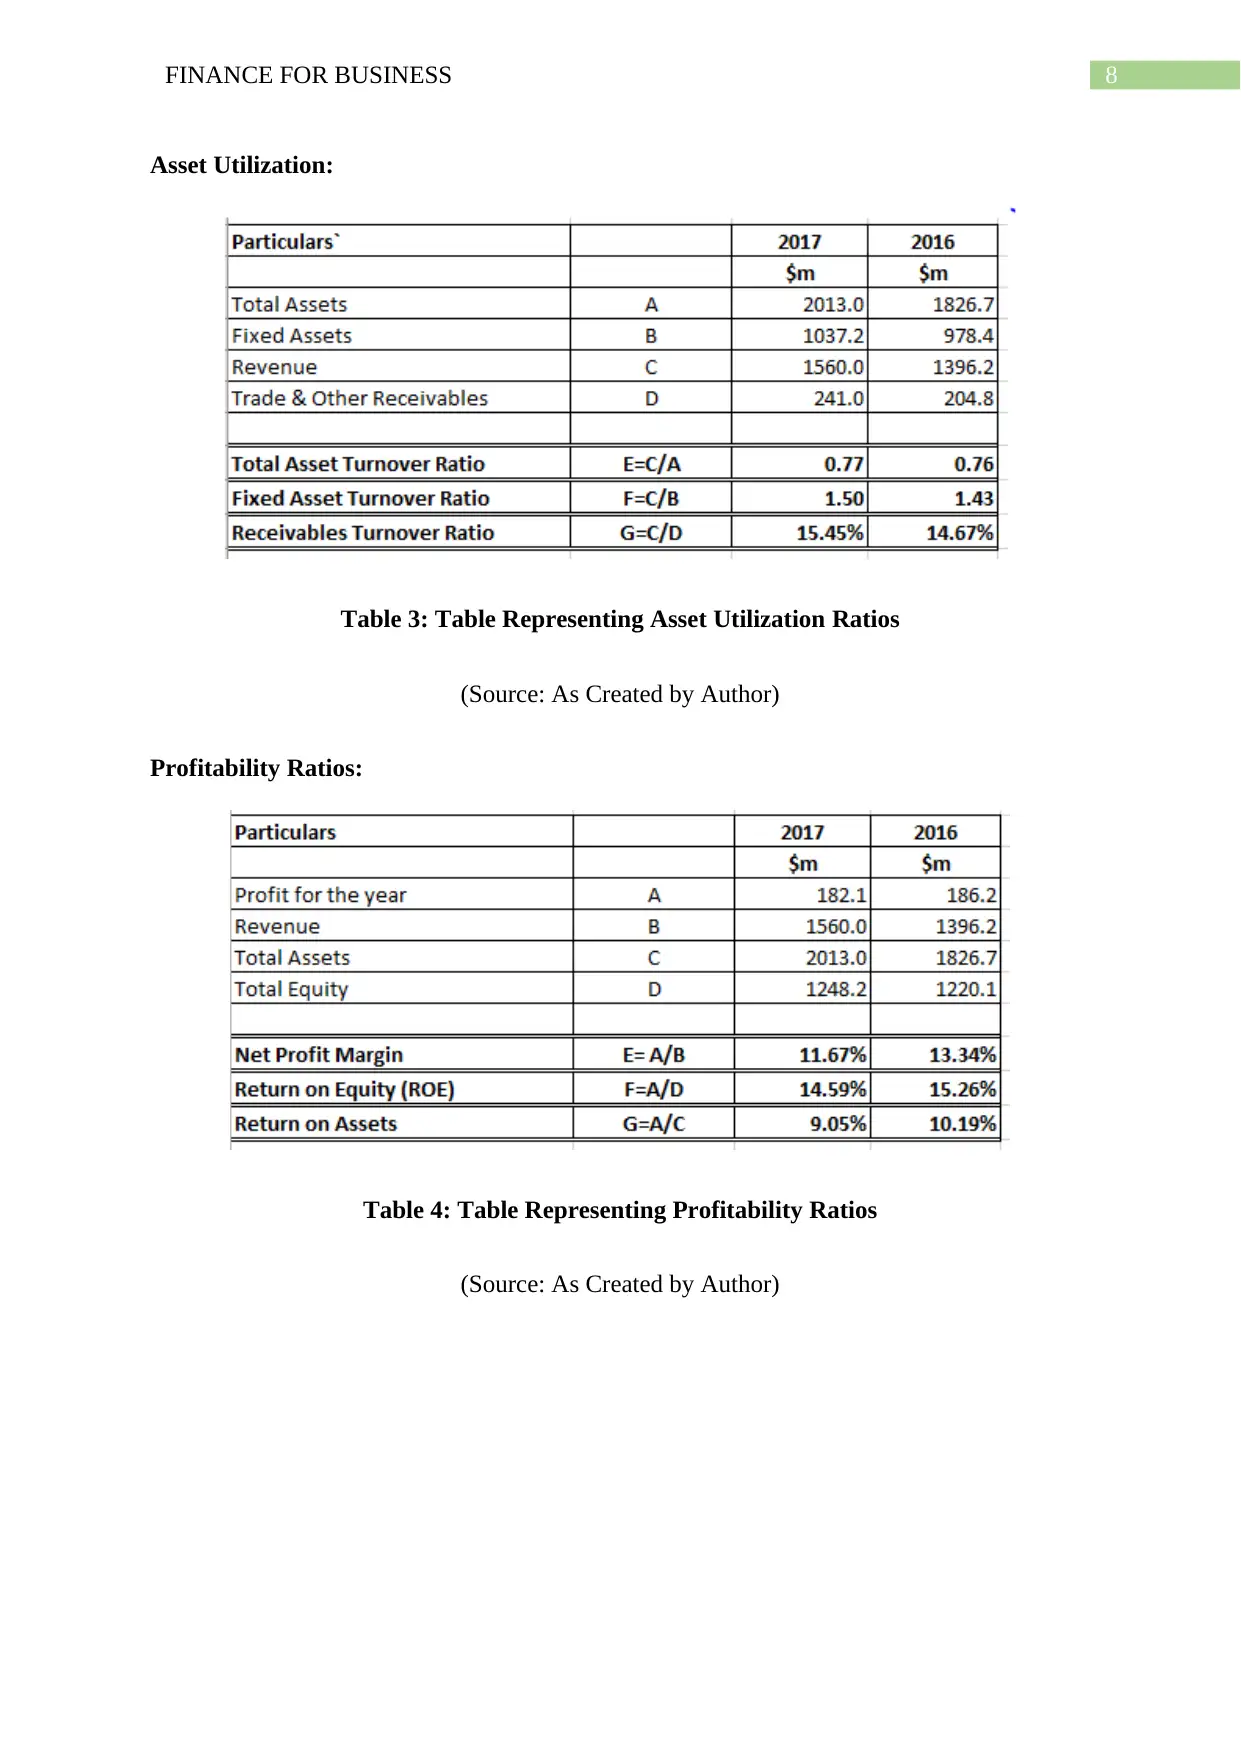
Asset Utilization:
Table 3: Table Representing Asset Utilization Ratios
(Source: As Created by Author)
Profitability Ratios:
Table 4: Table Representing Profitability Ratios
(Source: As Created by Author)
Asset Utilization:
Table 3: Table Representing Asset Utilization Ratios
(Source: As Created by Author)
Profitability Ratios:
Table 4: Table Representing Profitability Ratios
(Source: As Created by Author)
⊘ This is a preview!⊘
Do you want full access?
Subscribe today to unlock all pages.
Trusted by 1+ million students worldwide
9FINANCE FOR BUSINESS
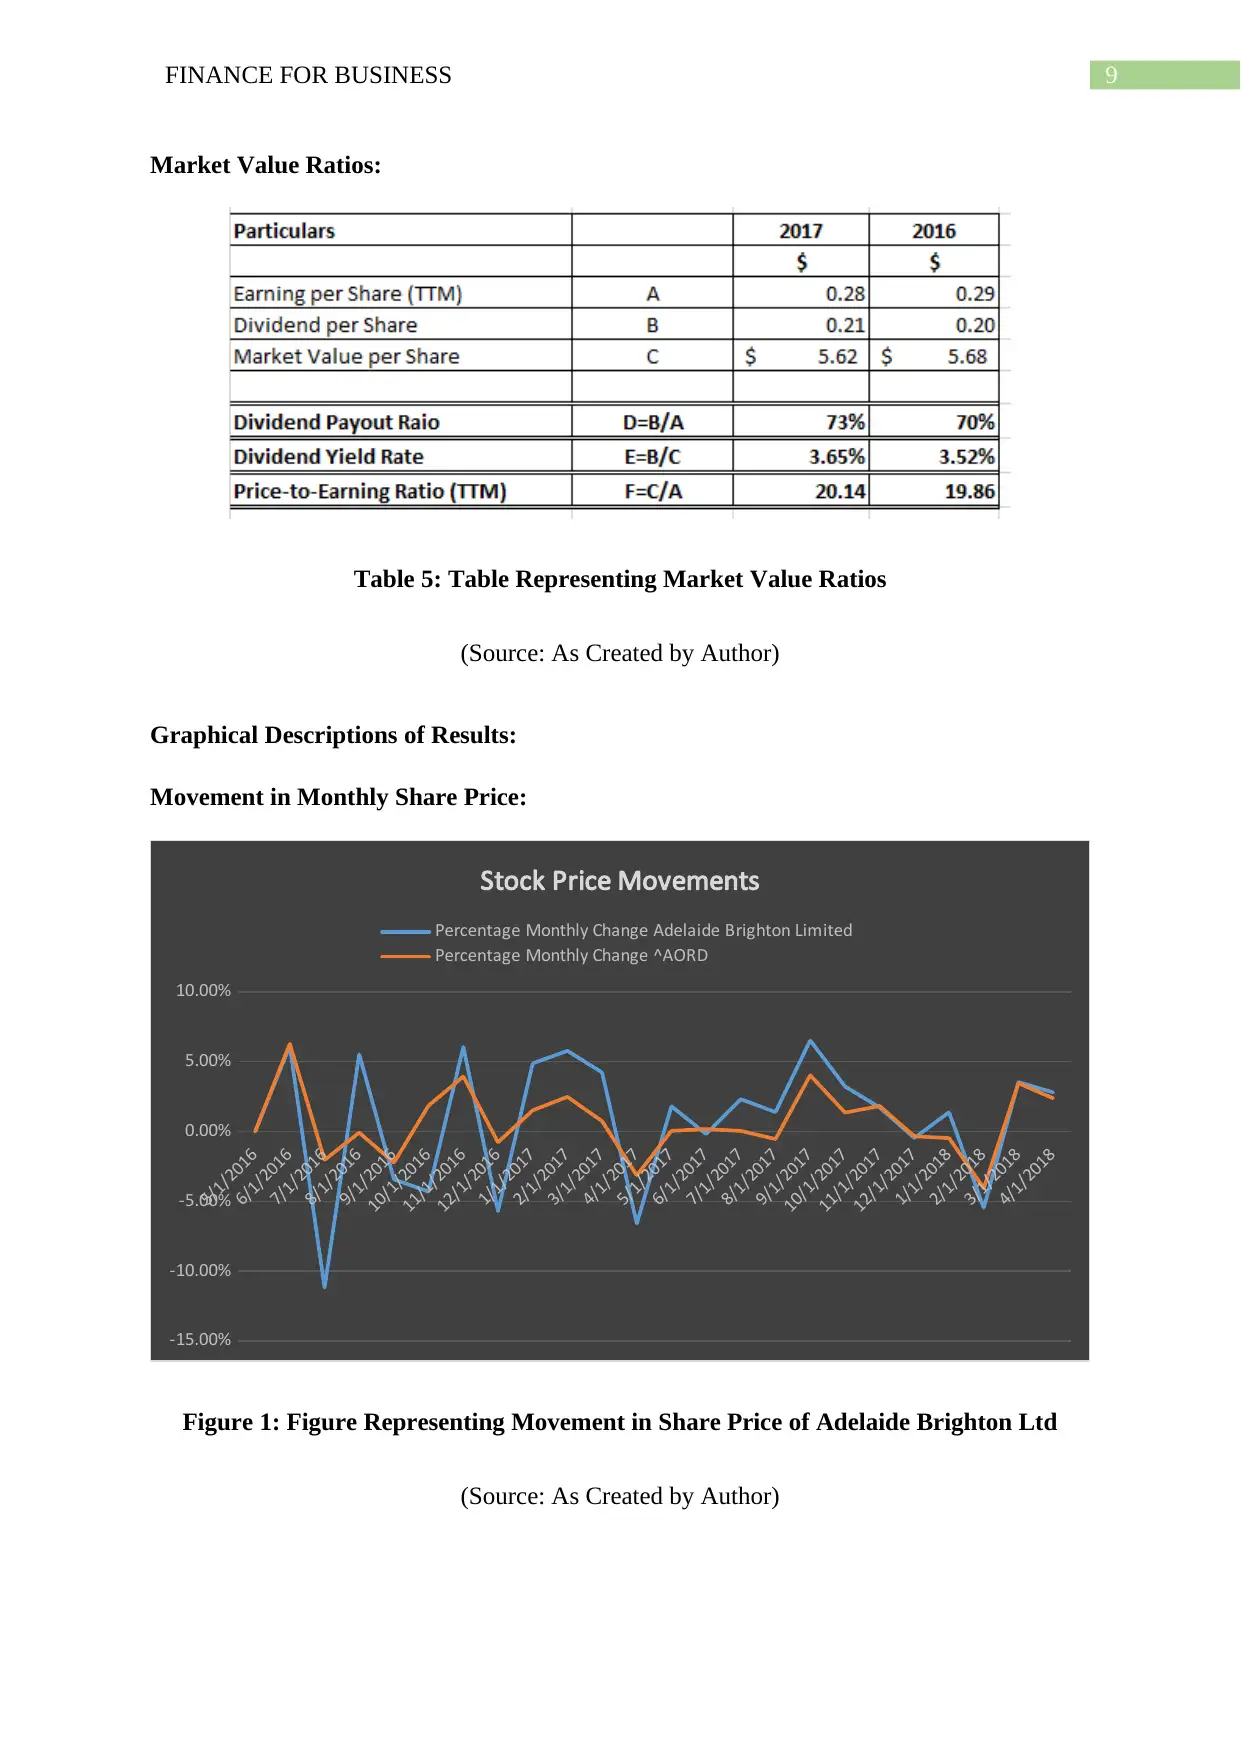
Market Value Ratios:
Table 5: Table Representing Market Value Ratios
(Source: As Created by Author)
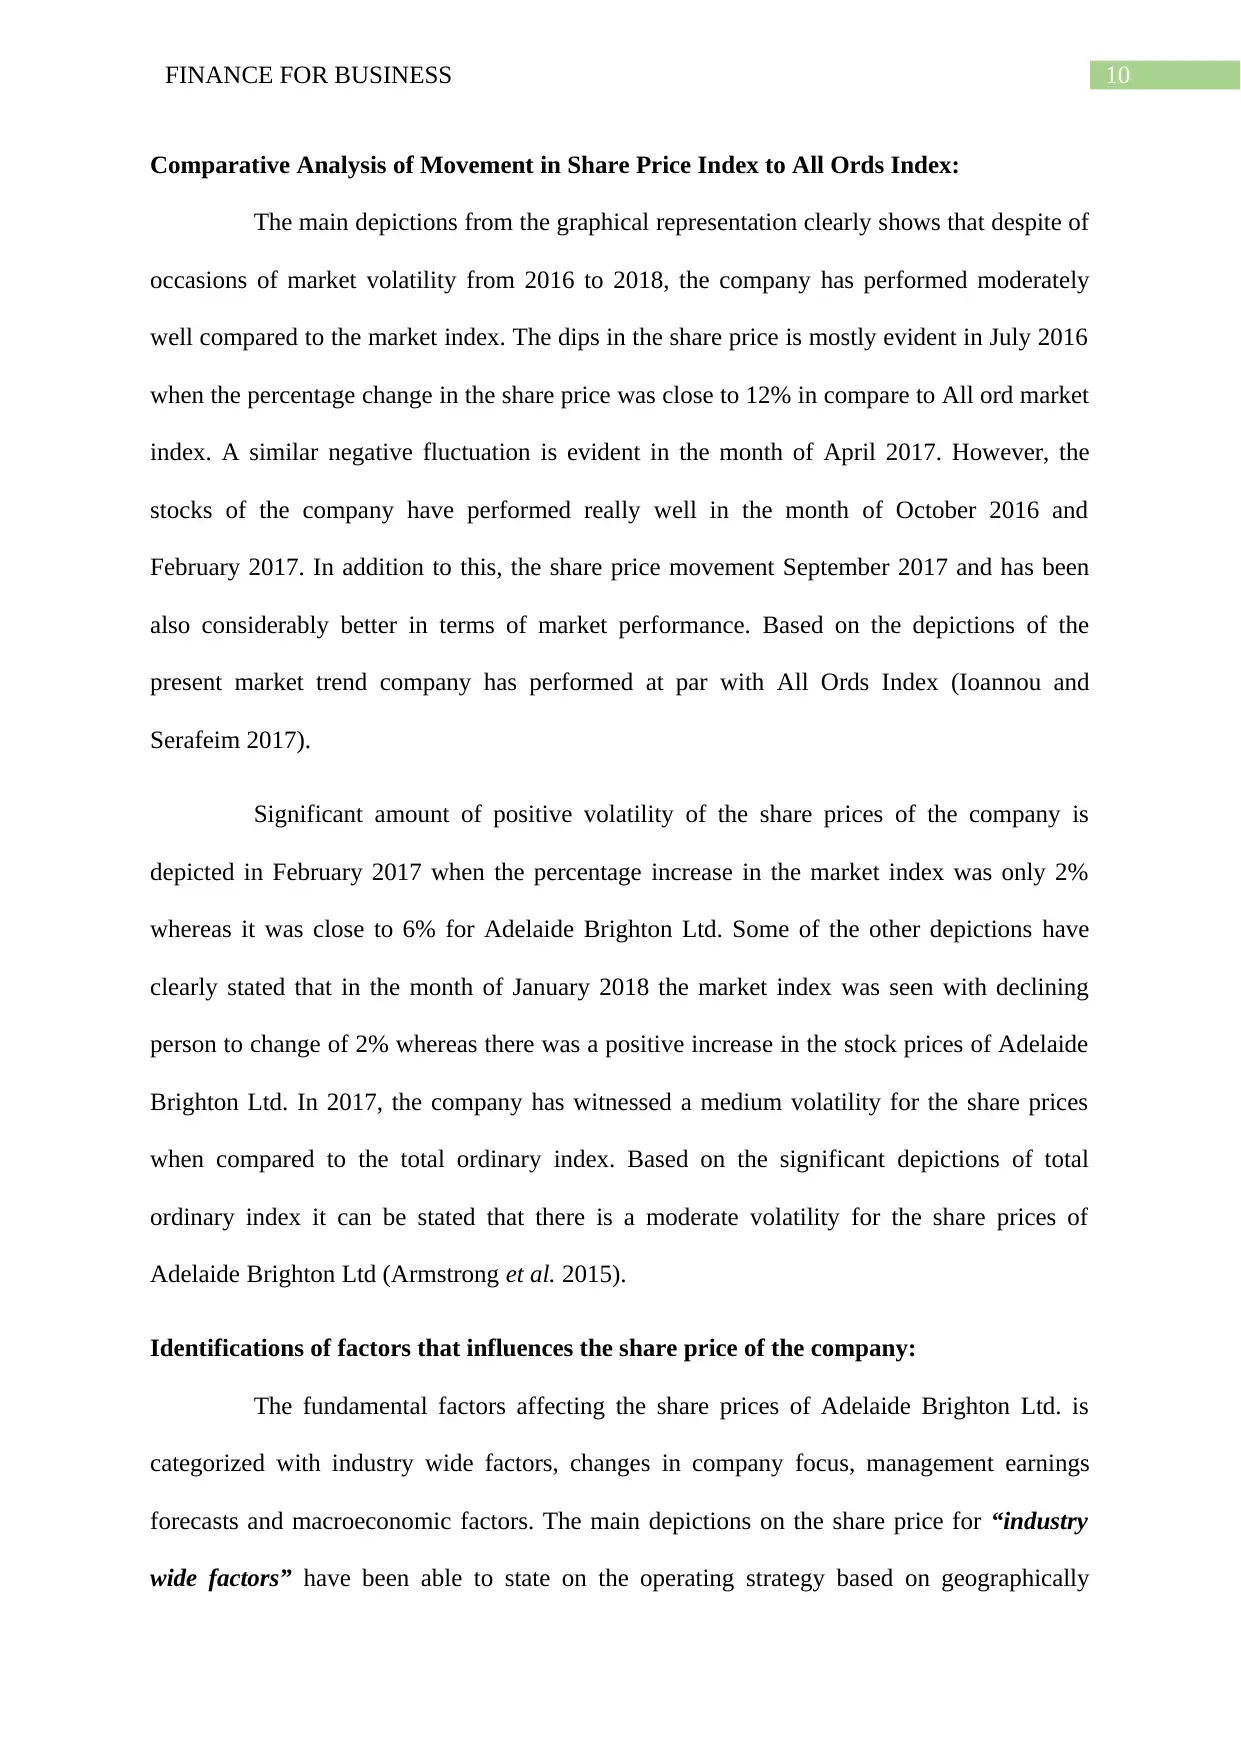
Graphical Descriptions of Results:
Movement in Monthly Share Price:
5/1/2016
6/1/2016
7/1/2016
8/1/2016
9/1/2016
10/1/2016
11/1/2016
12/1/2016
1/1/2017
2/1/2017
3/1/2017
4/1/2017
5/1/2017
6/1/2017
7/1/2017
8/1/2017
9/1/2017
10/1/2017
11/1/2017
12/1/2017
1/1/2018
2/1/2018
3/1/2018
4/1/2018
-15.00%
-10.00%
-5.00%
0.00%
5.00%
10.00%
Stock Price Movements
Percentage Monthly Change Adelaide Brighton Limited
Percentage Monthly Change ^AORD
Figure 1: Figure Representing Movement in Share Price of Adelaide Brighton Ltd
(Source: As Created by Author)
Market Value Ratios:
Table 5: Table Representing Market Value Ratios
(Source: As Created by Author)
Graphical Descriptions of Results:
Movement in Monthly Share Price:
5/1/2016
6/1/2016
7/1/2016
8/1/2016
9/1/2016
10/1/2016
11/1/2016
12/1/2016
1/1/2017
2/1/2017
3/1/2017
4/1/2017
5/1/2017
6/1/2017
7/1/2017
8/1/2017
9/1/2017
10/1/2017
11/1/2017
12/1/2017
1/1/2018
2/1/2018
3/1/2018
4/1/2018
-15.00%
-10.00%
-5.00%
0.00%
5.00%
10.00%
Stock Price Movements
Percentage Monthly Change Adelaide Brighton Limited
Percentage Monthly Change ^AORD
Figure 1: Figure Representing Movement in Share Price of Adelaide Brighton Ltd
(Source: As Created by Author)
Paraphrase This Document
Need a fresh take? Get an instant paraphrase of this document with our AI Paraphraser
10FINANCE FOR BUSINESS
Comparative Analysis of Movement in Share Price Index to All Ords Index:
The main depictions from the graphical representation clearly shows that despite of
occasions of market volatility from 2016 to 2018, the company has performed moderately
well compared to the market index. The dips in the share price is mostly evident in July 2016
when the percentage change in the share price was close to 12% in compare to All ord market
index. A similar negative fluctuation is evident in the month of April 2017. However, the
stocks of the company have performed really well in the month of October 2016 and
February 2017. In addition to this, the share price movement September 2017 and has been
also considerably better in terms of market performance. Based on the depictions of the
present market trend company has performed at par with All Ords Index (Ioannou and
Serafeim 2017).
Significant amount of positive volatility of the share prices of the company is
depicted in February 2017 when the percentage increase in the market index was only 2%
whereas it was close to 6% for Adelaide Brighton Ltd. Some of the other depictions have
clearly stated that in the month of January 2018 the market index was seen with declining
person to change of 2% whereas there was a positive increase in the stock prices of Adelaide
Brighton Ltd. In 2017, the company has witnessed a medium volatility for the share prices
when compared to the total ordinary index. Based on the significant depictions of total
ordinary index it can be stated that there is a moderate volatility for the share prices of
Adelaide Brighton Ltd (Armstrong et al. 2015).
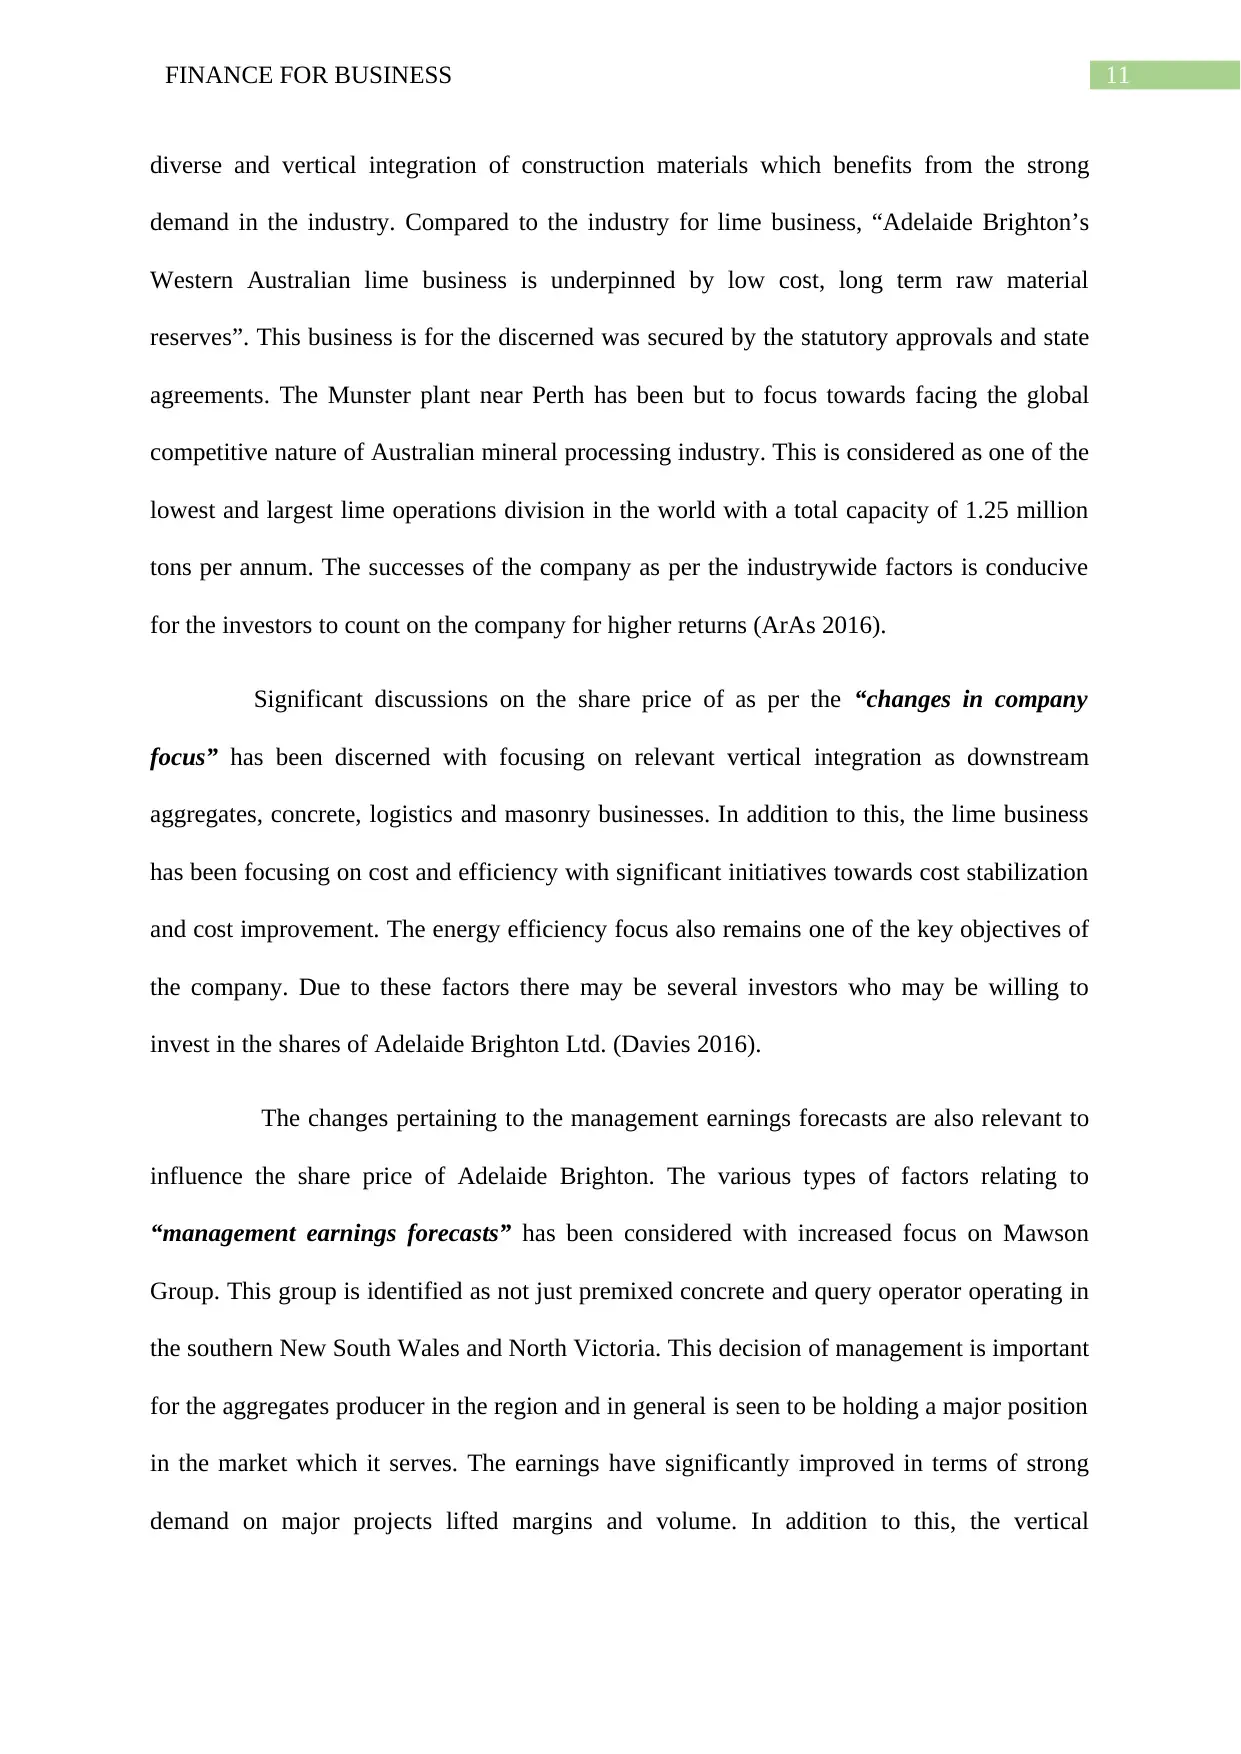
Identifications of factors that influences the share price of the company:
The fundamental factors affecting the share prices of Adelaide Brighton Ltd. is
categorized with industry wide factors, changes in company focus, management earnings
forecasts and macroeconomic factors. The main depictions on the share price for “industry
wide factors” have been able to state on the operating strategy based on geographically
Comparative Analysis of Movement in Share Price Index to All Ords Index:
The main depictions from the graphical representation clearly shows that despite of
occasions of market volatility from 2016 to 2018, the company has performed moderately
well compared to the market index. The dips in the share price is mostly evident in July 2016
when the percentage change in the share price was close to 12% in compare to All ord market
index. A similar negative fluctuation is evident in the month of April 2017. However, the
stocks of the company have performed really well in the month of October 2016 and
February 2017. In addition to this, the share price movement September 2017 and has been
also considerably better in terms of market performance. Based on the depictions of the
present market trend company has performed at par with All Ords Index (Ioannou and
Serafeim 2017).
Significant amount of positive volatility of the share prices of the company is
depicted in February 2017 when the percentage increase in the market index was only 2%
whereas it was close to 6% for Adelaide Brighton Ltd. Some of the other depictions have
clearly stated that in the month of January 2018 the market index was seen with declining
person to change of 2% whereas there was a positive increase in the stock prices of Adelaide
Brighton Ltd. In 2017, the company has witnessed a medium volatility for the share prices
when compared to the total ordinary index. Based on the significant depictions of total
ordinary index it can be stated that there is a moderate volatility for the share prices of
Adelaide Brighton Ltd (Armstrong et al. 2015).
Identifications of factors that influences the share price of the company:
The fundamental factors affecting the share prices of Adelaide Brighton Ltd. is
categorized with industry wide factors, changes in company focus, management earnings
forecasts and macroeconomic factors. The main depictions on the share price for “industry
wide factors” have been able to state on the operating strategy based on geographically
11FINANCE FOR BUSINESS
diverse and vertical integration of construction materials which benefits from the strong
demand in the industry. Compared to the industry for lime business, “Adelaide Brighton’s
Western Australian lime business is underpinned by low cost, long term raw material
reserves”. This business is for the discerned was secured by the statutory approvals and state
agreements. The Munster plant near Perth has been but to focus towards facing the global
competitive nature of Australian mineral processing industry. This is considered as one of the
lowest and largest lime operations division in the world with a total capacity of 1.25 million
tons per annum. The successes of the company as per the industrywide factors is conducive
for the investors to count on the company for higher returns (ArAs 2016).
Significant discussions on the share price of as per the “changes in company
focus” has been discerned with focusing on relevant vertical integration as downstream
aggregates, concrete, logistics and masonry businesses. In addition to this, the lime business
has been focusing on cost and efficiency with significant initiatives towards cost stabilization
and cost improvement. The energy efficiency focus also remains one of the key objectives of
the company. Due to these factors there may be several investors who may be willing to
invest in the shares of Adelaide Brighton Ltd. (Davies 2016).
The changes pertaining to the management earnings forecasts are also relevant to
influence the share price of Adelaide Brighton. The various types of factors relating to
“management earnings forecasts” has been considered with increased focus on Mawson
Group. This group is identified as not just premixed concrete and query operator operating in
the southern New South Wales and North Victoria. This decision of management is important
for the aggregates producer in the region and in general is seen to be holding a major position
in the market which it serves. The earnings have significantly improved in terms of strong
demand on major projects lifted margins and volume. In addition to this, the vertical
⊘ This is a preview!⊘
Do you want full access?
Subscribe today to unlock all pages.
Trusted by 1+ million students worldwide
1 out of 20
Related Documents


Your All-in-One AI-Powered Toolkit for Academic Success.
+13062052269
info@desklib.com
Available 24*7 on WhatsApp / Email
![[object Object]](/_next/static/media/star-bottom.7253800d.svg)
Unlock your academic potential
Copyright © 2020–2026 A2Z Services. All Rights Reserved. Developed and managed by ZUCOL.