Experimental Determination of Adiabatic Index of Air & Error Analysis
VerifiedAdded on 2023/06/12
|6
|1822
|169
Practical Assignment
AI Summary
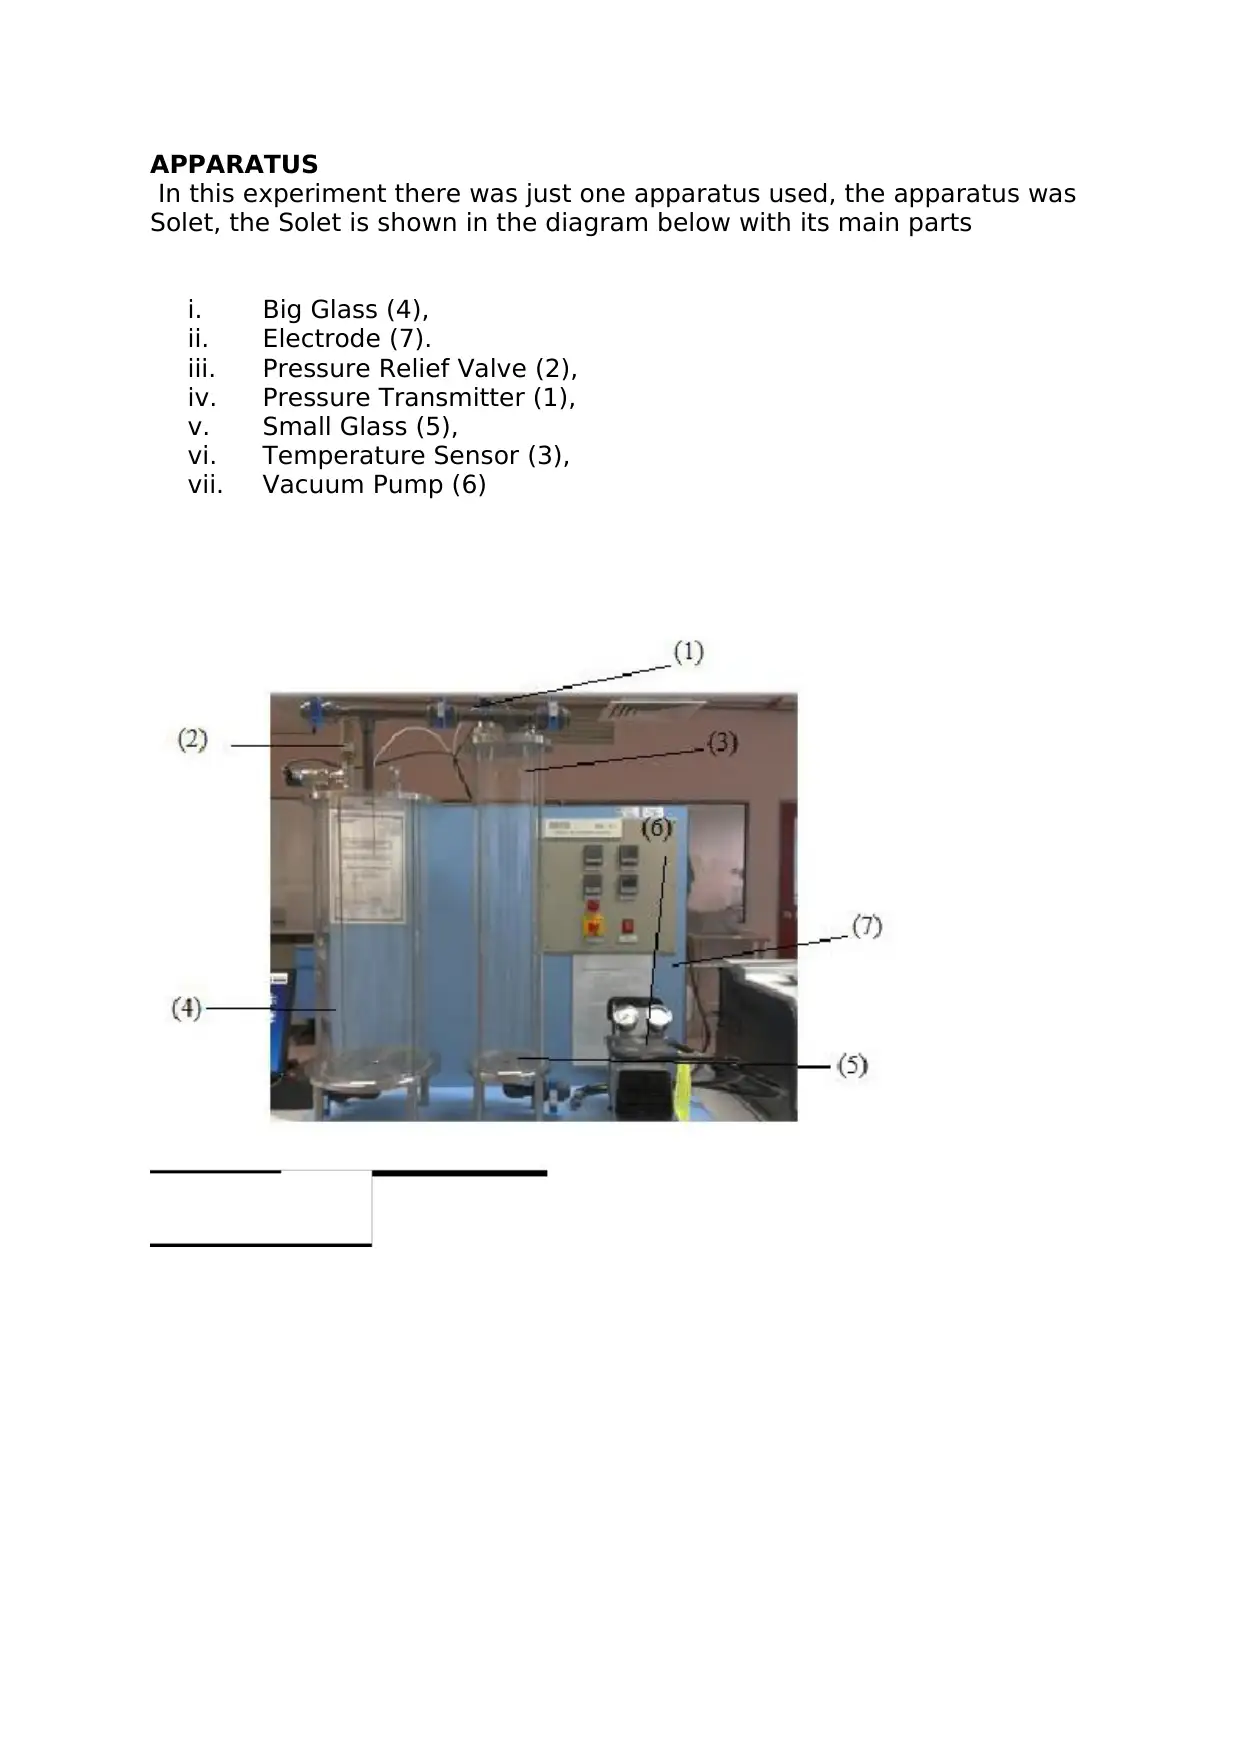
This assignment presents an experiment conducted to determine the adiabatic index of air at room temperature by simulating the rapid expansion of pressurized air within a container. The experiment involved measuring initial, intermediate, and final pressures to calculate the adiabatic index using the First Law of Thermodynamics and the Ideal Gas Law. The methodology included recording atmospheric pressure, pressurizing a cylinder, and abruptly releasing air while noting pressure changes. Multiple trials were performed to obtain a mean value for the adiabatic index, with error analysis and standard deviation calculated to assess the consistency of the experiment. The experiment also covered the verification of Gay-Lussac's and Boyle's laws, and determination of heat capacity and volume ratio, using an ideal gas expansion apparatus, and discusses the relationship between pressure, temperature, and volume for perfect gases.

Abstract
The main objective of experiment was to obtain the adiabatic index of air in a temperature of
250 C through simulation of expression expansion of air which is put in a container. The
values of the adiabatic could be easily calculated through using relevant measurement and
recording the pressure in the container. Comparatively small value of standard deviation as
well as the percentage error in the average value and the reading obtained were actually very
near to the anticipated value result to the conclusion that the simulated and experiment of the
adiabatic expressions were very consistent.
Introduction
This experiment was done to determine the adiabatic index of air at temperature of the room
by permitting the pressurized air in the vessel to briefly expand during a fast closing and
opening action of big valves. This help to ensure that expression could be taken as adiabatic.
The reading of the pressure was taken before and after the expression. The content of the
vessel were then permitted to come to room temperature and then final pressure in the vessel
was taken. Pressure was the best parameter to check the adiabatic index as compared to
specific volume or temperature. Hence, an equation which relates the adiabatic index to the
three pressures had to be obtained through derivation. This derivation will need the concept
of the First Law of thermodynamics and application of the Ideal gas Laws treating air as a
perfect gas. In this derivation a relationship between the internal energy and heat capacity is
fully employed. The mean value for the adiabatic index was then obtained through using the
results got from many trials and the percentage error and standard deviation scrutinize to
validate the consistency of the experiment.
Method
Apparatus
The apparatus used here involves a cylinder which is airtight that can be
opened to the atmosphere via ball valves at cylinder´s top. It as well
contain a connections to a pump of air that permit internal pressure to be
bigger, also to temperature and pressure sensor. The former are coupled
to a support having a switch of four-position. The positions of the switch
Marked ‘Panda ‘T1’ which is aligned to monitor the temperature and
pressure gauge p of the air in the vessel. The temperature is in form of
resistance values that can be easily changed to absolute temperature by
help of calibration charts.
Absolute temperature using calibration charts.
Procedure
Before the beginning of the experiment, the atmospheric pressure was
recorded by help of the barometer – it was required to obtain the
absolute pressures in the vessel.
Valves ‘V4’ was open whilst ‘V1’ was closed hence the air pump was then
turned on. ‘V1’
Paraphrase This Document
Need a fresh take? Get an instant paraphrase of this document with our AI Paraphraser

Monitors opening of the cylinder to the atmosphere whilst ‘V4’ governs the
joining to the air Pump. And if the gauge pressure shows roughly 25kN/m2
on the console, then the air pump was switched off thus detaching valve
‘V4’ was closed.
A small fall in pressure was seen subsequently, supported by idea that the
content of the container were cooling to the room temperature. The
pressure was hence permitted to be stable and this was taken as the
starting pressure (PS) at the same time valve V1 was then opened and
closed abruptly. This enabled slight amount of air to escape from the
container. Whilst the closing-opening action was going on the least value
of pressure shown on the console was taken as (PI). The container
contents were permitted to return to ambient temperature again to make
the final pressure (PF) be recorded. The pressure p1, p2 and p3 were
obtained through addition of the value of the atmospheric pressure to
starting pressure, pressure indicated and final pressure. That procedure
was done again for the difference PS in the container, through treating the
PF as PI for the succeeding runs, as the pressure reduces to atmospheric
pressure. The adiabatic index of air γ was obtained through p1, p2 and p3
from every attempt of the experiment so that a mean value could be
obtained.

1
ABSTRACT
This lab practical were put into 7 different experimentations where every
experiment had its own objectives to help understand the relations
between the given factors and the ideal gas to give the fathoming of the
second Law of Thermodynamics, First Law of Thermodynamics as well as
the relationship between the V-T-P to the students. In this experiment
ideal gas expansion apparatus (Model TH11) was fully employed. The aims
for every experiment was accomplished. Gay-Lussac law and Boyle’s law
were verified in the experimentation when the perfect gas acted as
anticipated. The heat capacity and volume ratio were as well obtained as
1.054 and 6.42 respectively.
INTRODUCTION
The ideal gas enlargement Apparatus (Model: TH 11) is designed to make help the students
to get familiar with some important thermodynamic processes. Fully fathoming the First Law
of Thermodynamics, Second Law of Thermodynamics and the relationship V-T-P is very
significant in the usage of thermodynamics in companies.
Air pumped is used to ensure that the student evacuate air in the big container given that the
valves aligns accordingly the experiment. The temperature and pressure sensors are
employed to check and thus influence the temperate and pressure in the container and the
indicator which is digital will hence show the temperature and pressure. This experiment
basically deals with characteristic of perfect gases and their relationship to given
environmental factors. A PVT is a relationship which relates molar volume, pressure and
absolute temperature. The particles of the gas in the vessel will collide with the walls of the
container thus referring the momentum to the particles in every collision. The pressure of the
gas is the same as the momentum given to unit time. Nevertheless, the particles of perfect gas
are not colliding with other particle but rather with only the walls of the container
⊘ This is a preview!⊘
Do you want full access?
Subscribe today to unlock all pages.

Trusted by 1+ million students worldwide

APPARATUS
In this experiment there was just one apparatus used, the apparatus was
Solet, the Solet is shown in the diagram below with its main parts
i. Big Glass (4),
ii. Electrode (7).
iii. Pressure Relief Valve (2),
iv. Pressure Transmitter (1),
v. Small Glass (5),
vi. Temperature Sensor (3),
vii. Vacuum Pump (6)
Paraphrase This Document
Need a fresh take? Get an instant paraphrase of this document with our AI Paraphraser

DISCUSSION
From the statement of the Boyle’s law which states the relationship amid
the volume and pressure of a gas. The law states that these parameters
are inversely propositional to each other. From our values tabulated in the
results as well as the calculations it validates the law. Since in the
calculation as the volume was increasing the pressure was reducing
proportionally for the all experimental values obtained. The smaller
container will have a higher pressure because the volume is small while
the big container will have a lower pressure because the volume is big.
When the container is small, the particles of a perfect gas will actually
travels a very short distance to hit the walls of the container resulting a
higher pressure as compared to t a large container where the particles of
the perfect gas will have to travel bigger distance to hit the walls of the
container. The frequency of the collision of the walls of the container
results to a higher pressure. This theory of Collison help us to fathom the
result and the theory (Silberberg, 2007). And this relationship can be
shown mathematically by the following equation
PV =
RT . . . . . . . . . . . . . . . . . . . . . . . . . . . . . . . . . . . . . . . . . . . . . . . . . . . . . . . . .
. . . . . . . 1
The equation 1 can be employed to obtain the Boyle´s equation as seen in
equation 2 below
P1V1=
P2V2 . . . . . . . . . . . . . . . . . . . . . . . . . . . . . . . . . . . . . . . . . . . . . . . . . . . . . . .
. . . . . 2
For the next experiment, Gay-Lussac´s Law was learnt to obtain the
relationship between the temperature and the pressure. And from our
result of this experiment the pressure increased when the temperature
was increased, and these results proves the Charles and Gay Lussac’s
laws also the theories. If the volume is kept the same, the absolute
temperature of a fixed mass of gas is directly proportional to the pressure
and it can be validated by the following equation.
P
T = k . . . . . . . . . . . . . . . . . . . . . . . . . . . . . . . . . . . . . . . . . . . . . . . . . . . . . .
. . . . . . . . . . . . 3
Therefore with an increase of the temperature, the warm air will rise
showing increase in pressure. (Turner & Cooper, 2012). The second law of
Thermodynamic is basis of the Thermodynamic absolute temperature that
explains the entropy (a new function). Calculations of the variations of
entropy for isobaric, isochoric and isothermal process and for the
transition phases can as well be described. (Begley, 2013). In a brief
depressurization and stepwise experiment, the scheme to implement the

same stepwise depressurization tactic in study gives a more consistent
results for instant in the manufacturing sector in the companies. For the
last two experiments, the heat capacity value and the value of the volume
ratio were obtained. The difference in percentage of the volume
theoretical with the result was obtained to be 31 % that is actually large
enough.
CONCLUSIONS
Fundamentally the experiment was perfectly done meeting all the
objectives for the experiment notwithstanding the big deviancy of figures
amid the values of hypothetical ratio and the figure got. All through the
studies, it was learnt that most of the laws of the gas for the perfect gas
were just restraining laws since the gas didn’t really act impeccably for a
practical world. In the experiment the gas obeyed the Boyle´s law and the
Gay Lussac´s law in a relationship between the temperature, pressure and
volume.
⊘ This is a preview!⊘
Do you want full access?
Subscribe today to unlock all pages.

Trusted by 1+ million students worldwide
1 out of 6

Your All-in-One AI-Powered Toolkit for Academic Success.
+13062052269
info@desklib.com
Available 24*7 on WhatsApp / Email
Unlock your academic potential
Copyright © 2020–2025 A2Z Services. All Rights Reserved. Developed and managed by ZUCOL.