Financial Accounting Report: Adidas and Puma Performance Analysis

Verified

Added on  2022/12/05

|23
|3517
|343
Report
AI Summary
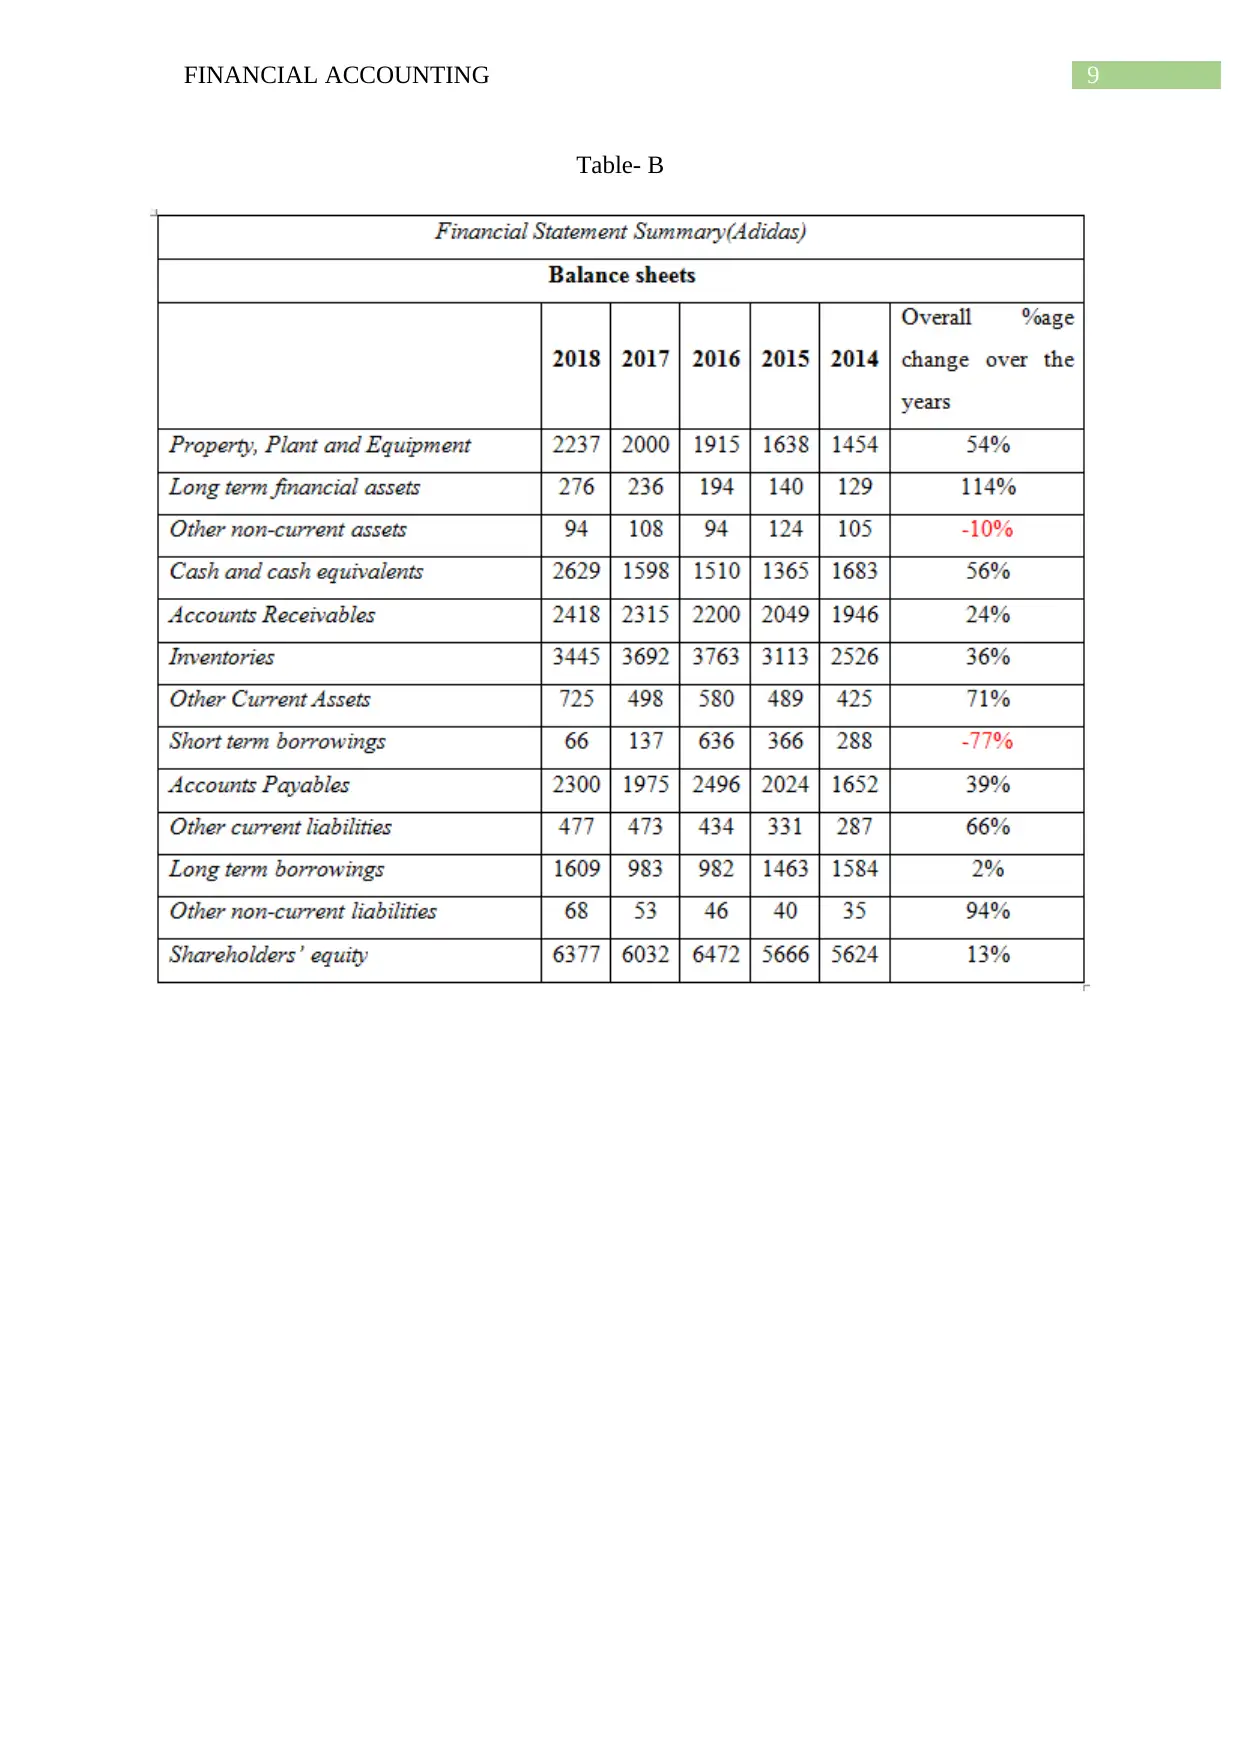
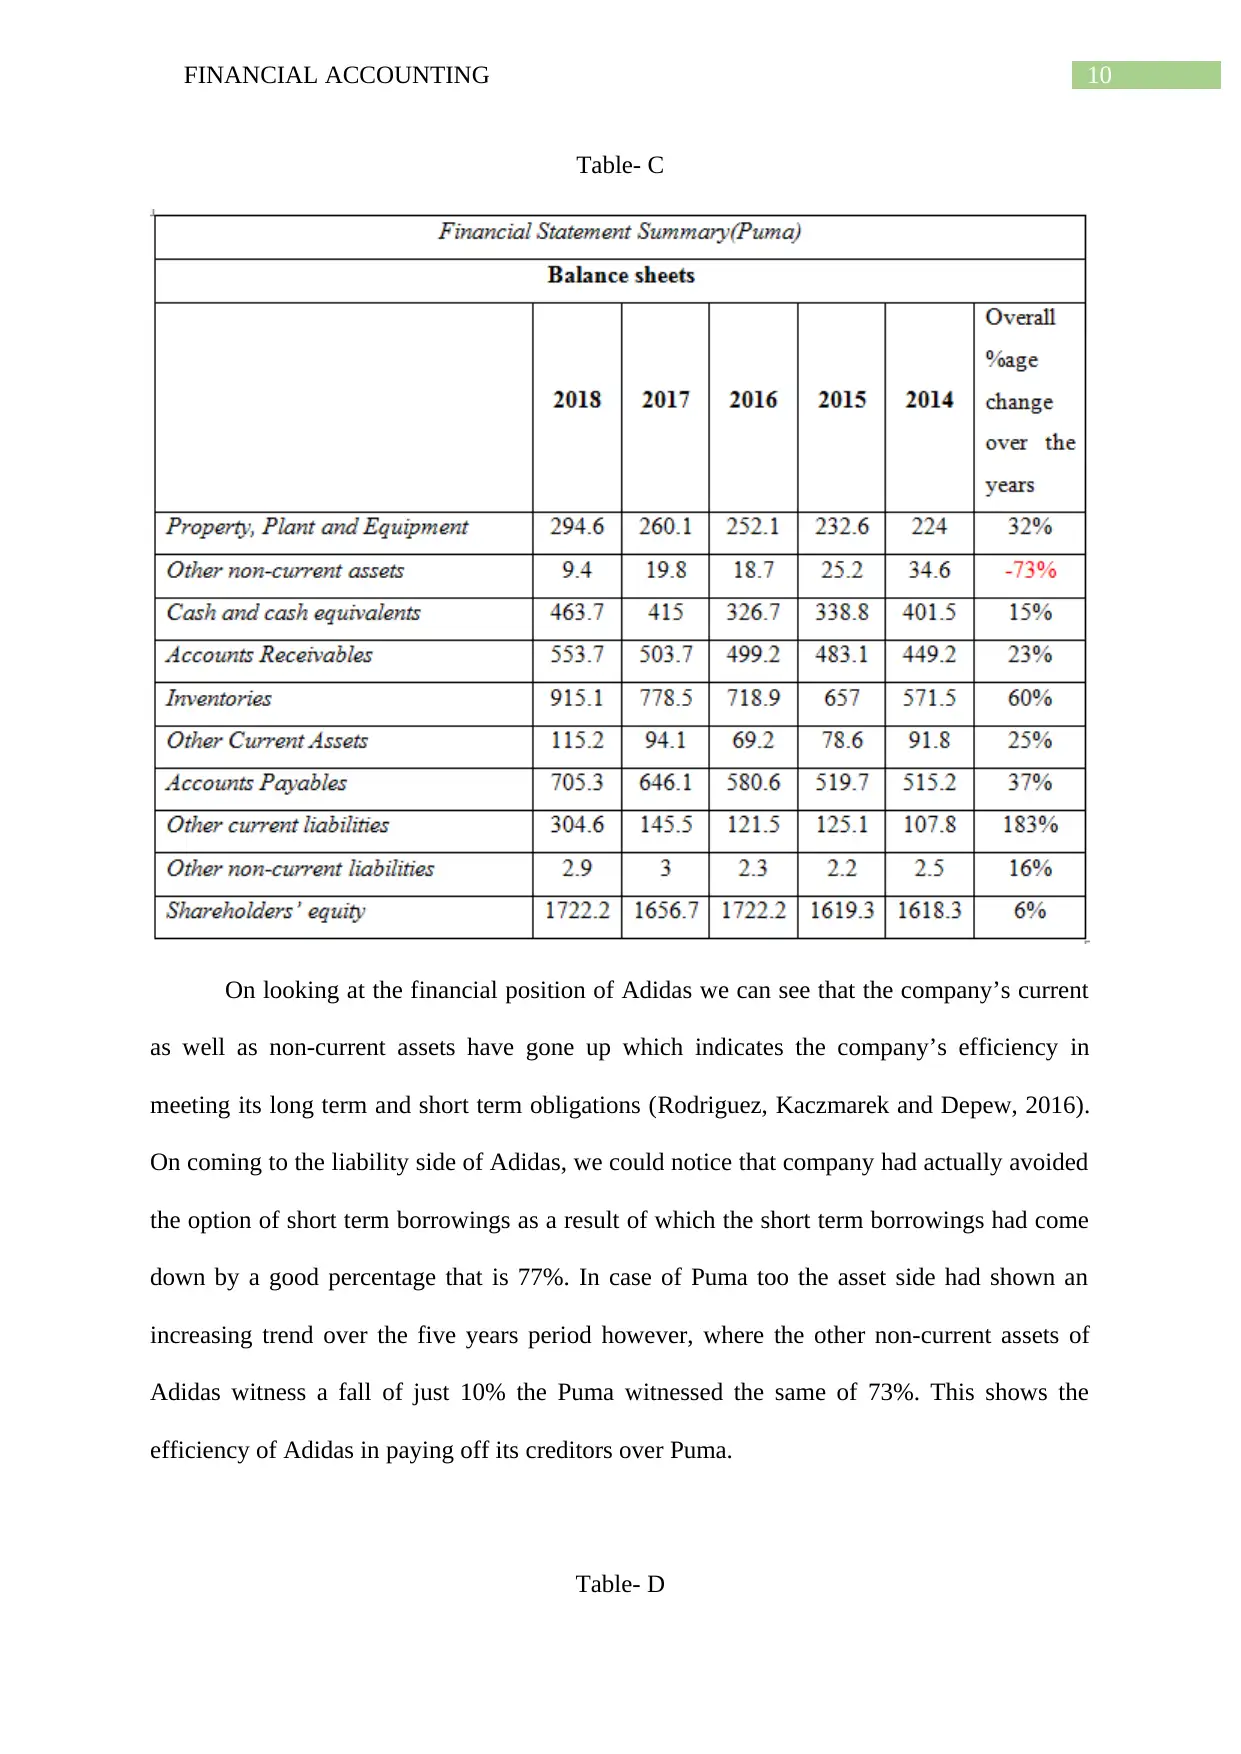
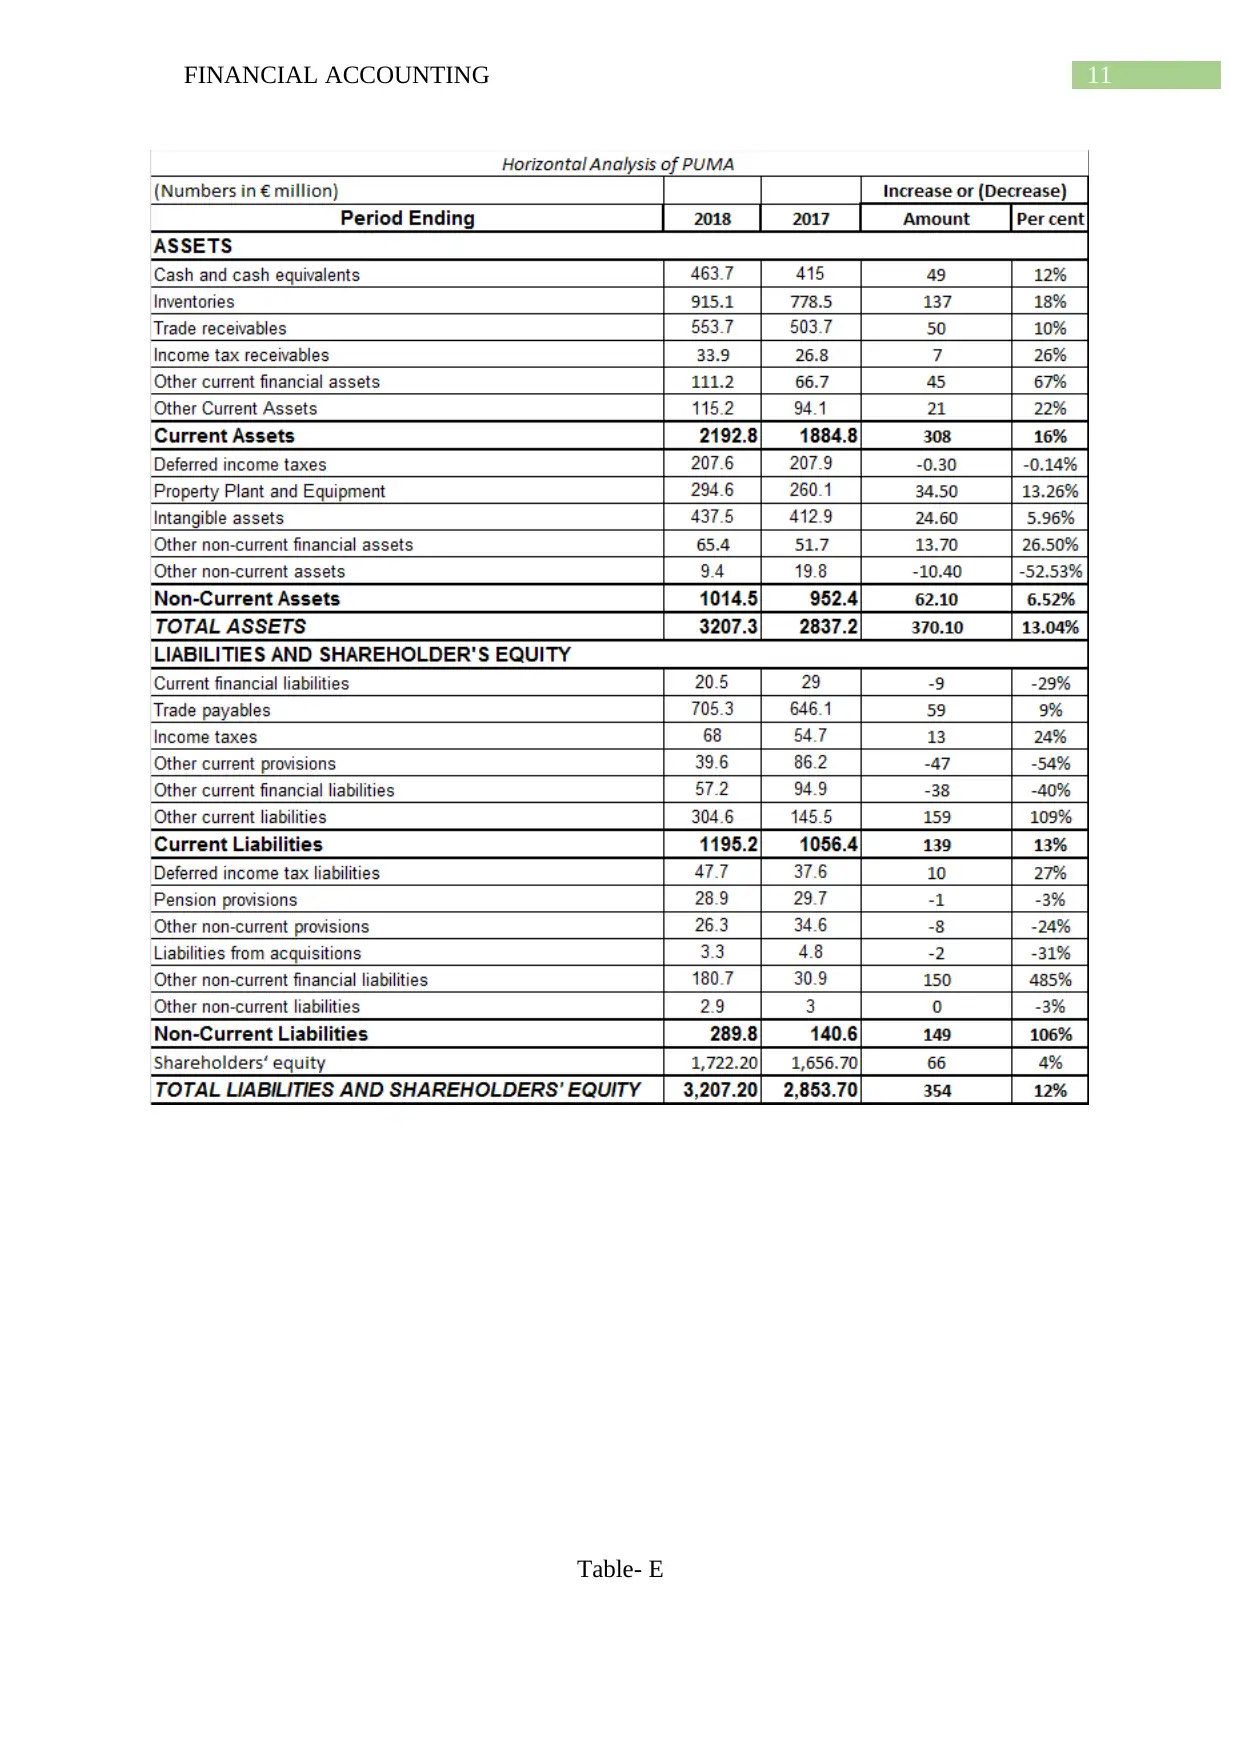
This report provides a comprehensive financial analysis of Adidas and Puma, two prominent companies in the footwear and accessories industry. The analysis employs the CORE approach, examining the external and internal environments of both businesses, and evaluating their financial positions and performance using ratio analysis. The report assesses revenue trends, balance sheet data, and key financial metrics to compare the efficiency and performance of Adidas and Puma. The findings indicate that Adidas demonstrates more appreciable performance than Puma, making it a potentially more attractive investment option. The report includes detailed financial data and calculations in the appendices, supporting the conclusions drawn from the analysis. The report also covers the industry context, risks, and the companies' strategies, providing a well-rounded perspective on their financial health and future prospects.
tabler-icon-diamond-filled.svg

Contribute Materials

Your contribution can guide someone’s learning journey. Share your documents today.
Document Page
Running head: FINANCIAL ACCOUNTING
Financial accounting
Name of the Student:
Name of the University:
Student ID:
Author Note
tabler-icon-diamond-filled.svg

Secure Best Marks with AI Grader

Need help grading? Try our AI Grader for instant feedback on your assignments.
Document Page
1FINANCIAL ACCOUNTING
Executive Summery
This report is prepared to analyze two companies that is Adidas and Puma in order to arrive
at a better investment decision. The approach used for studying and evaluating the overall
business and performance of both the companies includes the CORE Approach. Every
calculation can be found in the appendices section. The result drawn from the approach says
that the performance of Adidas is more appreciable than Puma. As a result, it will be
advisable to add Adidas in the investment portfolio.
Document Page
2FINANCIAL ACCOUNTING
Table of Contents
Introduction................................................................................................................................3
Core Analysis of Adidas and Puma...........................................................................................3
Stage-1 (Context)...................................................................................................................3
Stage-2 (Overview)................................................................................................................6
Stage-3 (Ratios)....................................................................................................................14
Stage-4 (Evaluation).............................................................................................................17
Conclusion................................................................................................................................17
References................................................................................................................................18
Appendix..................................................................................................................................20
Document Page
3FINANCIAL ACCOUNTING
Introduction
In today’s scenario making an investment decision has become a very crucial as well
as a complicated task. Companies have enough funds but where to invest the available funds
becomes a big question mark. In this report we had studied the business of two very famous
companies that is ADIDAS and PUMA for which we used the CORE approach. With the
help of this approach we tried to analyze the external and internal environment of both the
business and had even studied the financial position of both the companies. The ratio analysis
is also conducted to evaluate the efficiency of both the companies in order to draw a better
conclusion for decision making.
Core Analysis of Adidas and Puma
Stage-1 (Context)
Context: External Profile
The Footwear & Accessories industry is comprised of the companies who actually
deal in the products like clothes for men, women, children, jackets, gloves, shoes, socks, and
accessories like belt, bag, purse, watches, umbrellas etc. The companies like Puma and
Adidas operates in the Footwear & Accessories industry under the consumer cyclical sector
(Fidelity, N.D.). At the time of recession, the people of the economy usually try to cut their
discretionary expenses as a result of lower disposable income and at the time of boom the
sale of such goods take a good fly. In 2015 Adidas and Puma are the companies who deal
majorly in sporting goods and as per the last year Annual report of Adidas, the global
sporting goods industry has shown an upward trend in 2018. This growth was the result of the
rising participation in sports, increasing health consciousness, better e-commerce platforms,
motivating theme of social fitness etc. The FIFA WORLD CUP 2018 had also proved to be a
major factor behind the success of the industry. Now if we consider the success of sporting
and other fashion accessories in which companies like Adidas and Puma are engaged then
tabler-icon-diamond-filled.svg

Secure Best Marks with AI Grader

Need help grading? Try our AI Grader for instant feedback on your assignments.
Document Page
4FINANCIAL ACCOUNTING
this category did not see a very bright result but at the same time it didn’t even report a fall.
For this category 2018 was a mixed year. The risks like trade protectionism and geopolitical
tensions had increased in the year 2018 for sporting goods. In 2017, the sports shoes and
apparel industry had noticed a very quick growth. A rise of two per cent was seen in the
footwear industry in United States. The sports leisure category of athletic footwear had seen a
growth of seventeen per cent. The top sellers in sports leisure in United States were Nike,
Skechers, Under Armour and Adidas. In 2017, Adidas’ revenue went up by fifty per cent
(Johnson, Neugent and Granack, 2010).
In the world of digitalization there are many concerns which relate to the security
issues. (Puma, 2018)In order to meet the rising securities concern Puma had invested a good
amount on maintaining IT infrastructure where main attention is given to business
intelligence.
Overall, the footwear & Accessories industry is performing well as a result of
increased health consciousness, improved channels of e-commerce etc. whereas the factors
like trade protectionism, labor cost etc. may affect the performance of the industry.
Context: Internal Profile
Adidas started its journey in the year 1924 which was established by two brothers,
Rudolf and Adolf Dassler and it was founded in the year 1949. At present the company
carries out its operations in ten segments which include Europe, North America Adidas, Asia-
Pacific, North America Reebok, Latin America, Emerging Markets, Russia/CIS, Adidas Golf,
Runtastic, and other centrally managed businesses. The company deals in apparel, footwear
and accessories fitness equipment, golf clubs and hockey sticks etc.
Adidas is following Brand Leadership as their operating model which focuses on
building a consumer obsessed organizational structure which performs with good speed,
Document Page
5FINANCIAL ACCOUNTING
agility as well as empowerment. From 2015 ADIDAS is using Net Promoter Score (NPS) in
order to get an idea about the perception of consumers relating to brand and the factors which
motivate them to recommend the brand to their friends and relatives (Annual Report, 2018).
In 1948 the two brothers got separated and Rudolf dassler started a new company
named as PUMA Schuhfabrik Rudolf Dassler. Though the company was new but its success
remained remarkable. Their first football boot was a great hit. As a result in 1950 many of the
members of West Germany national team wore them in the football match which was to be
played against Switzerland, the first match after the war.
The designers of Puma design create the most desirable products that set the trend for
future and all these are carried out under the guidance of Torsten Hochstetter who is the
PUMA’s Global Creative Director. Puma has partnered with the elite ambassadors like Lewis
Hamilton, Bryson DeChambeau, Sergio Agüero, Antoine Griezmann, Borussia Dortmund,
Olympique de Marseille and AC Milan which has strengthen its position as a sport brand.
The company had also made connection with the women by signing Adriana Lima, a
supermodel as an ambassador for women’s training.
Stage-2 (Overview)
Now if we look at the revenue figure or the net sales of Adidas and Puma then in
Figure A we could easily identify that Adidas had always enjoyed a supreme position over
Puma in the past 12 years (2006-2018).
Document Page
6FINANCIAL ACCOUNTING
Sou
rce: (Statista, 2019)
Fig A. Revenue during 2006-2018
In Europe, Adidas stands as the largest sportswear manufacturer whereas in the whole
world it enjoys the second position. Puma does not enjoys first, second or third position but
still it is also one of the leading brands in the world and it operates with the aim of becoming
the most desirable sports lifestyle company. Around seventy-five per cent of Puma’s sales
come from Europe and America. In the year 2018, with the motive of broadening the market
share Puma collaborated with Ergio Rossi, singer Rihanna and Alexander McQueen (Statista,
2019).
Source
: (Puma Annual Report, 2015)
tabler-icon-diamond-filled.svg

Paraphrase This Document

Need a fresh take? Get an instant paraphrase of this document with our AI Paraphraser
Document Page
7FINANCIAL ACCOUNTING
Fig: B Number of Employees in Puma
Table- A
Source: (Annual Reports, N.D.)
Now if we analyze the decrease or increase in number of employees the two
companies had hired then in case of Puma the number had increased by ten per cent and in
case of Adidas it had increased by 18.6%. So here too we could easily interpret that the
business of Adidas has expanded more over the period of five years than Puma.
2014 2015 2016 2017 2018
0
50
100
150
200
250
Puma Revenue ( € million)
Revenue ( € million)
Graph 1: Changes in revenue over the years (PUMA)
Document Page
8FINANCIAL ACCOUNTING
2014 2015 2016 2017 2018
0
200
400
600
800
1000
1200
1400
1600
1800
Adidas Revenue ( € million)
Revenue ( € million)
Graph 2: Changes in revenue over the years (ADIDAS)
Every business except the Non-profit organizations, they all work with the motive of
increasing revenue over the years. Let us consider the revenue of Adidas and Puma in order
to check whether they had seen an increase or decrease in their revenues during the last five
years that is 2014-2018. In case of Puma the revenue had increased by one hundred seventy
one per cent during the past five years whereas the revenue of Adidas in the past five years
had increased by two hundred forty four per cent.
Document Page
9FINANCIAL ACCOUNTING
Table- B
tabler-icon-diamond-filled.svg

Secure Best Marks with AI Grader

Need help grading? Try our AI Grader for instant feedback on your assignments.
Document Page
10FINANCIAL ACCOUNTING
Table- C
On looking at the financial position of Adidas we can see that the company’s current
as well as non-current assets have gone up which indicates the company’s efficiency in
meeting its long term and short term obligations (Rodriguez, Kaczmarek and Depew, 2016).
On coming to the liability side of Adidas, we could notice that company had actually avoided
the option of short term borrowings as a result of which the short term borrowings had come
down by a good percentage that is 77%. In case of Puma too the asset side had shown an
increasing trend over the five years period however, where the other non-current assets of
Adidas witness a fall of just 10% the Puma witnessed the same of 73%. This shows the
efficiency of Adidas in paying off its creditors over Puma.
Table- D
Document Page
11FINANCIAL ACCOUNTING
Table- E
Document Page
12FINANCIAL ACCOUNTING
In order to get a clear picture of the recent performance of Adidas and Puma we have
conducted a horizontal analysis of their balance sheets from where we could infer many of
the important facts. The cash and cash equivalents of Adidas had increased by 65% in the
year 2018 however in case of Puma the increased percentage was just 12%. This shows the
PUMA’s inefficiency in managing the working capital and ADIDAS’s efficiency in
managing its working capital (Warren and Jones, 2018). This will surely help the company in
meeting its short term obligations, day to day operations, suppliers etc. When we look at the
inventory of both the companies then in case of PUMA the inventory had increased by
tabler-icon-diamond-filled.svg

Paraphrase This Document

Need a fresh take? Get an instant paraphrase of this document with our AI Paraphraser
Document Page
13FINANCIAL ACCOUNTING
eighteen per cent and in case of ADIDAS the inventory figure had declined by seven per
cent. There are two things which can be interpreted for both the companies wherein, one
could prove positive and the other could be negative for the company. First let us talk about
the Puma whose inventory has shown an upward trend over the five years period. It could be
positive in the sense that in case of any sudden increase in demand the company will be able
to meet all the demands and will surely not bear the loss of losing any of its customers.
However, it could be an indication of inefficient sales of the company as a result of which it
was not able to sell off its inventory leaving it abandoned and increasing the inventory
figures. So now when we look at the revenue figures of Puma in the same time period of five
years then it has gone up from where we may interpret that the company is efficient in its
sales and have maintained a good level of inventory to meet the uncertain demand of the
customers. In case of Adidas the inventory figure has gone down which may be interpreted
both positively as well as negatively. Positive could be that it is able to sell off its entire
product leading to reduction in the inventory figure. Negative could be the risk for the
company of not being able to meet all its demand in the future which may reduce its profit
amount (Dauderis and Annand, 2018). Now if we talk about the performance of Adidas’
shares then it had performed amazingly well on the stock market as a result the company
witnessed a rise of ninety-seven per cent in the year 2016 and 2017. During the same period
Adidas’ biggest competitor Nike had witnessed a decrease of 3.7% in its value on the stock
market.
Stage-3 (Ratios)
Table- F
Ratio Analysis
Document Page
14FINANCIAL ACCOUNTING
Interpretation: For every Euro invested in capital, Adidas generated 27 cents in operating
income however Puma had generated only 16%. So, Adidas had generated a good return on
its capital employed. Adidas is even using its assets more efficiently than Puma in order to
generate sales. If we talk about Sales margin then Adidas had generated 3%more profit from
the sale of its product than Puma. Even the employees of Adidas are more efficient in
generating sales and profit for the company as compared to Puma. Overall, Adidas is
performing more efficiently than Puma.
Inventory days
using cost of
sales
Receivable days Payable days
0
20
40
60
80
100
120
140
Working capital ratio
ADIDAS (2018)
PUMA (2018)
Document Page
15FINANCIAL ACCOUNTING
Adidas is able to recover the amount from its debtors and is also being able to pay off
its creditors in less time than what is taken by Puma (Rodriguez, Kaczmarek and Depew,
2016). Adidas is even able to sell its entire inventory and replace it many more times than
Puma, where Puma is taking 139 days to replace its inventory, Adidas is taking just 119 days.
Working capital management of both the companies are good enough as a result of
which they have current ratio of around one from where we can interpret that both the
companies are sufficient enough to meet their short term obligations with the help of
available current assets.
ADIDAS (2018) PUMA (2018)
0.00
0.50
1.00
1.50
2.00
2.50
3.00
3.50
4.00
Solvency ratio
Interest cover
Gearing
Both the companies have a good interest coverage ratio which shows the companies’
efficiency in meeting its interest expenses with the help of earning before paying interest and
taxes.
tabler-icon-diamond-filled.svg

Secure Best Marks with AI Grader

Need help grading? Try our AI Grader for instant feedback on your assignments.
Document Page
16FINANCIAL ACCOUNTING
P/E Ratio Earnings Per
Share Return on equity
0.00
5.00
10.00
15.00
20.00
25.00
30.00
ADIDAS (2018)
PUMA (2018)
Now from the view point of stock market, Adidas is a better company to invest in
because its PE ratio is much higher than that of Puma. Adidas stock has a positive and better
future and investors are willing to pay more for its stock as a result it has a higher PE ratio
than Puma.
Adidas is giving less dividend to its shareholders’ as compared to Puma however the
amount contributed by the shareholders are being utilized more judiciously and efficiently by
Adidas as compared to Puma.
Stage-4 (Evaluation)
It will be beneficial for the company to invest in Adidas over Puma because Adidas
had carried out its business more efficiently than Puma as a result of which it had generated
more revenue and profit than Puma. Adidas had more cash and cash equivalent than Puma
which actually results in less payable days and is able to manage its working capital
requirements more proficiently. Adidas is able to succeed in its business because of its
efficient workforce who generates more sales and profit when compared with Puma’s
workforce. Even in the stock market the investors are more positive and are willing to pay
more for the stock of Adidas over Puma. Adidas is even utilizing the shareholders’ equity
Document Page
17FINANCIAL ACCOUNTING
more prudently than Puma. So, it will be preferable for the company if it opt to add Adidas in
the investment portfolio.
Conclusion
Both Adidas and Puma operate in the Apparel, footwear and accessories industry and
at present the industry is performing well. Both the companies get their maximum revenue
from their sportswear sector which is performing really well as result of increased health
consciousness among the population. On looking at the Financial performance of both the
companies over the last five years then Adidas had generated more revenue over Puma as a
result, Puma had more inventory left with it as compared to Adidas. Adidas has even
maintained a good figure of cash and cash equivalents than Puma as a result of which it is
able to meet its due obligations in lesser period of time. Now if we look at the performance of
Adidas’ stock in the stock market then it performed really well in the year 2017 which
resulted in a high PE ratio. So it will be a good decision to choose Adidas for the investment
over Puma.
Document Page
18FINANCIAL ACCOUNTING
References
Annual Report, 2015. Puma Training 2015.[Online].Available 13 May, 2019
http://report.puma-annual-report.com/en/group-management-report/puma-group-essential-
information/employees/.
Annual Reports, (N.D.). Financial Publications.[Online].Available 13 May, 2019
https://www.adidas-group.com/en/investors/financial-reports/.
Banks, E., 2015. Finance: the basics. Routledge.
Dauderis, H. and Annand, D., 2018. Introduction to Financial Accounting. Lyrnx.
Fidelity, (N.D.).Consumer Discretionary. [Online]. Available 13 May, 2019
https://eresearch.fidelity.com/eresearch/markets_sectors/sectors/sectors_in_market.jhtml?
tab=learn&sector=25.
Johnson, A., Neugent, A. And Granack, B. J. 2010. Footwear Industry Analysis:Nike, Inc.
and Adidas.[Online]. Available 13 May, 2019
https://mie480a43.files.wordpress.com/2010/12/mie-480-paper.doc.
Puma, (N.D.). Forever Faster From Day One PUMA TIMELINE. [Online]. Available 13
May, 2019 https://about.puma.com/en/this-is-puma/history/history.
Puma, 2018. Combined Management Report for the Financial Year 2018. [Online]. Available
13 May, 2019 https://about.puma.com/-/media/files/pdf/investor-relations/financial-reports/
puma-consolidated-financial-statements-2018.ashx.
Robinson, T.R., Henry, E., Pirie, W.L. and Broihahn, M.A., 2015. International financial
statement analysis. John Wiley & Sons.
tabler-icon-diamond-filled.svg

Paraphrase This Document

Need a fresh take? Get an instant paraphrase of this document with our AI Paraphraser
Document Page
19FINANCIAL ACCOUNTING
Rodriguez, J., Kaczmarek, P. and Depew, D., 2016. Visualizing Financial Data. John Wiley
& Sons.
Statista, (2019). Global revenue of Adidas, Nike and Puma from 2006 to 2018 (in billion
euros).[Online]. Available 13 May, 2019 https://www.statista.com/statistics/269599/net-
sales-of-adidas-and-puma-worldwide/
Warren, C. and Jones, J., 2018. Corporate financial accounting. Cengage Learning.
Document Page
20FINANCIAL ACCOUNTING
Appendix
1. Graph 1: Changes in revenue over the years (PUMA)
Year
Revenue (
million)
% Increase or
decrease
2014 84.8
2015 61.7 -27%
2016 88.4 43%
2017 135.8 54%
2018 229.8 69%
Overall Increase/decrease
in revenue
171%
(229.8-84.8)/
84.8
2. Graph 2: Changes in revenue over the years (ADIDAS)
Yea
r
Revenue (
million)
%age Increase or
decrease
201
4 496
201
5 640 29%
201
6 1020 59%
201
7 1100 8%
201
8 1704 55%
Overall Increase/decrease in
revenue
244%
(1704-496)/
496
3. Table F: Ratio Analysis
Document Page
21FINANCIAL ACCOUNTING
A. Performance Ratio of Adidas and Puma
Ratios Formula ADIDAS (2018) PUMA (2018)
Return on
Capital
Employed
PBIT/Capital
Employed
where, Capital
employed=
Total assets-
Current
liabilities
2378/(15612-
6834) 27% 313.4/(3207.2-
1195.2) 16%
Asset
Turnover
Profit /
Average total
assets
1704/
(15612+14019) 0.06
229.8/
(2853.8+3207.2) 0.04
Sales Margin
Net profit/total
revenues 1704/21915 8% 229.8/4648.3 5%
Gross Margin
Gross profit /
Sales or
revenue
11363/21915
52% 2249.4/4648.3 48%
Expense ratio
Expenses
(excluding
tax) / Net sales
(using
operating
expenses/opera
ting income)
9172/2368
387% 1928.4/337.4 572%
Sales per
employee
Total sales/
Number of
employees 21915/57016
0.3843657
9 4648.3/12894
0.3605010
08
Profit per
employee
Operating
profit/Number
of employees 2368/57016
0.0415322
01 337.4/12192
0.0276738
85
B. Working Capital Ratio of Adidas and Puma
Ratios Formula ADIDAS (2018) PUMA (2018)
Inventory
days using
cost of sales
inventory×365/cost
of sales
3445*365/105
52
11
9
915.1*365/239
9
13
9
Receivable
days
trade receivables
×365/sales revenue
2418*365/219
15 40 553.7*365/464
8.3 43
Payable days
trade payables
×365/cost of sales
2300*365/105
52 80 705.3*365/239
9
10
7
C. Liquidity Ratio of Adidas and Puma
Ratios Formula ADIDAS (2018) PUMA (2018)
tabler-icon-diamond-filled.svg

Secure Best Marks with AI Grader

Need help grading? Try our AI Grader for instant feedback on your assignments.
Document Page
22FINANCIAL ACCOUNTING
Current
ratio
current
assets/current
liabilities
9813/683
4 1.44
2192.8/1195.2
1.8
3
Acid test
ratio
(current assets
less
inventory)/curre
nt liabilities
9813-
3445/683
4 0.93
2192.8-
915.1/1195.2
1.0
7
D. Solvency Ratio of Adidas and Puma
Ratios Formula ADIDAS (2018) PUMA (2018)
Interes
t cover
profit before
interest and tax/
interest payable
2378/669 3.55 313.4/83.6 3.75
Gearin
g
total
debt/shareholde
rs' funds where,
shareholders'
funds= total
assets-total
liabilities
1609/1561
2-9248 0.25
289.7/
(3207.2-
1484.9)
0.17
E. Stock Market Analysis of Adidas and Puma
Ratios Formula ADIDAS (2018) PUMA (2018)
P/E Ratio
market value per
share/ earning per
share
211.82/8.4
6 25.04 52.96/12.54 4.2
2
Earnings Per
Share
8.46 (Annual Report
2018)
12.54 (Annual Report
2018)
Return on
equity
Net
income/Shareholder
s' Equity
1704/6377 0.27 229.8/1722.2 0.1
3
chevron_up_icon
1 out of 23
circle_padding
hide_on_mobile
zoom_out_icon
logo.png

Your All-in-One AI-Powered Toolkit for Academic Success.

Available 24*7 on WhatsApp / Email

[object Object]