Advance Diploma in Accounting Project Report: FNS60215
VerifiedAdded on  2022/12/26
|20
|3220
|81
Project
AI Summary
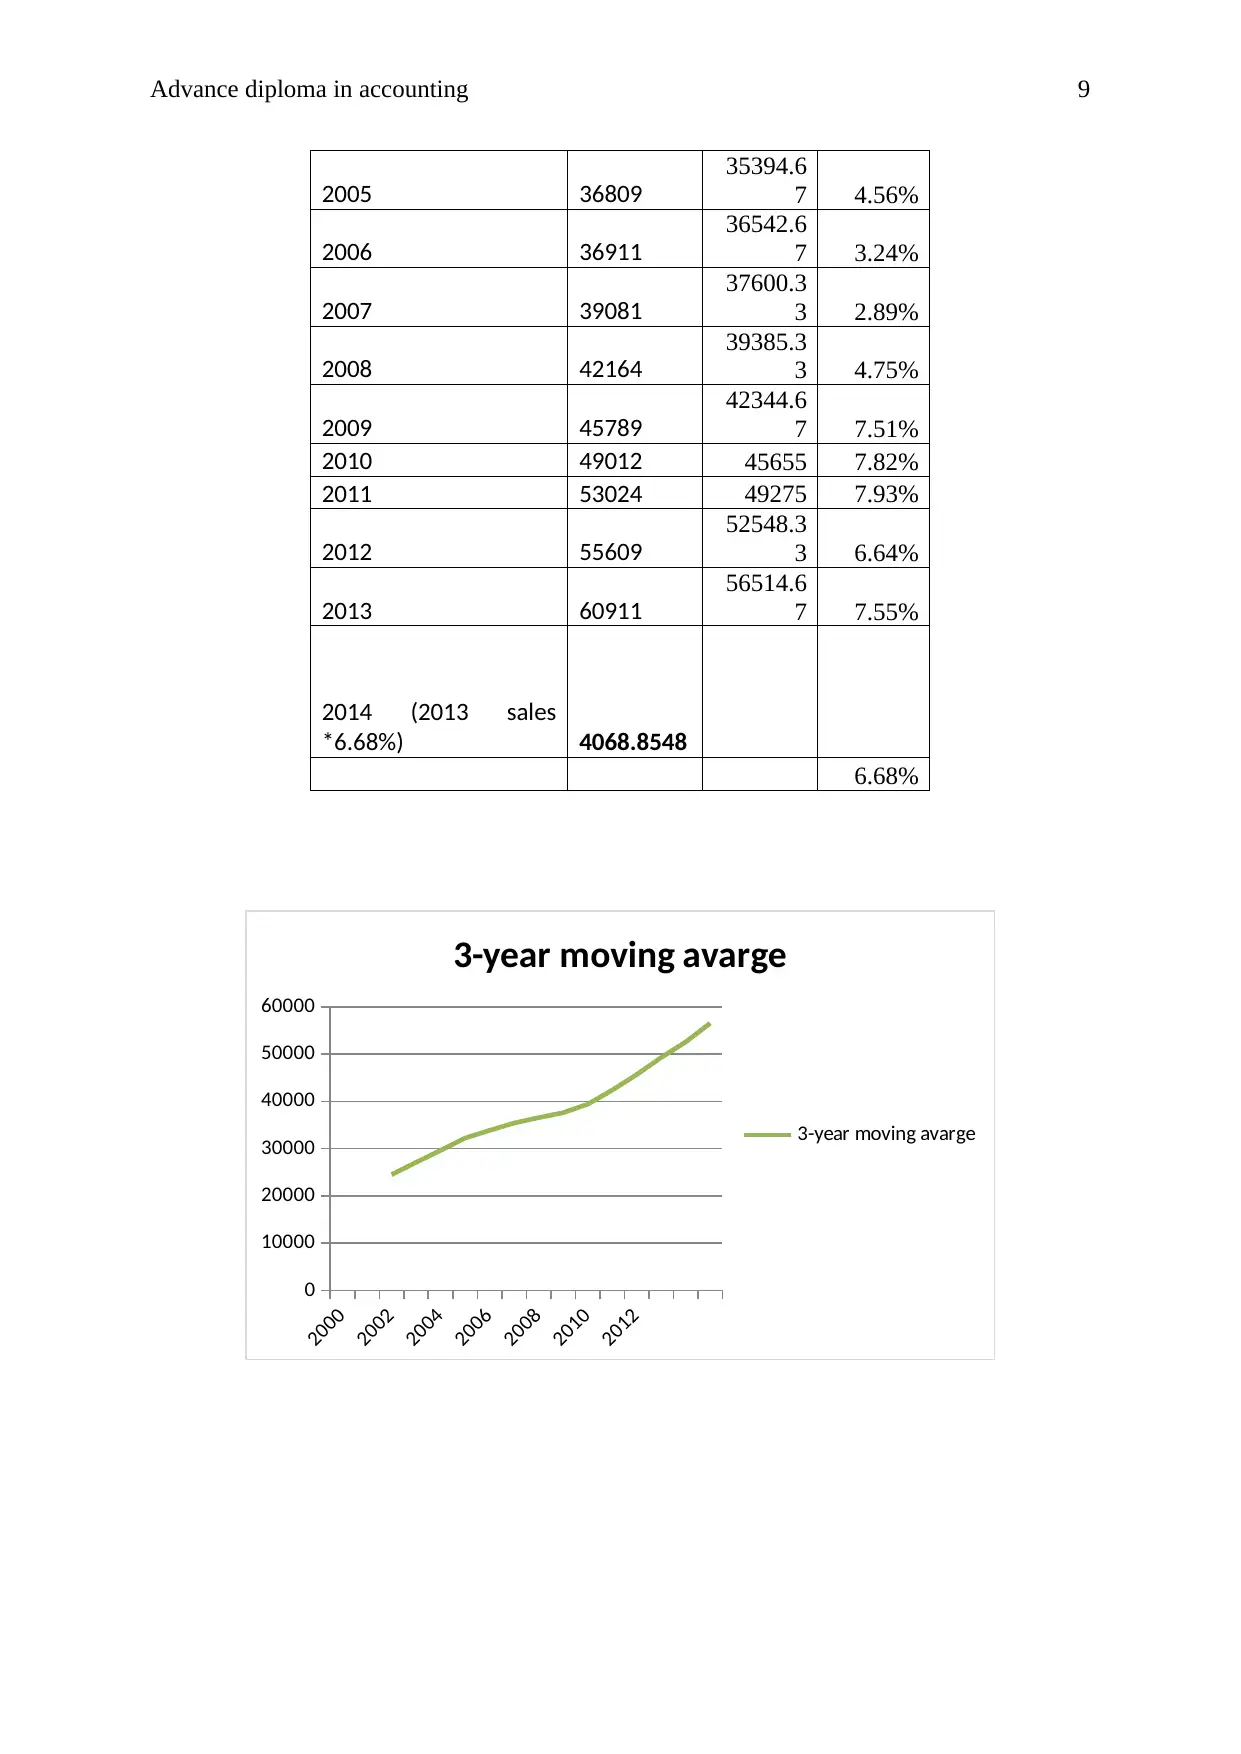
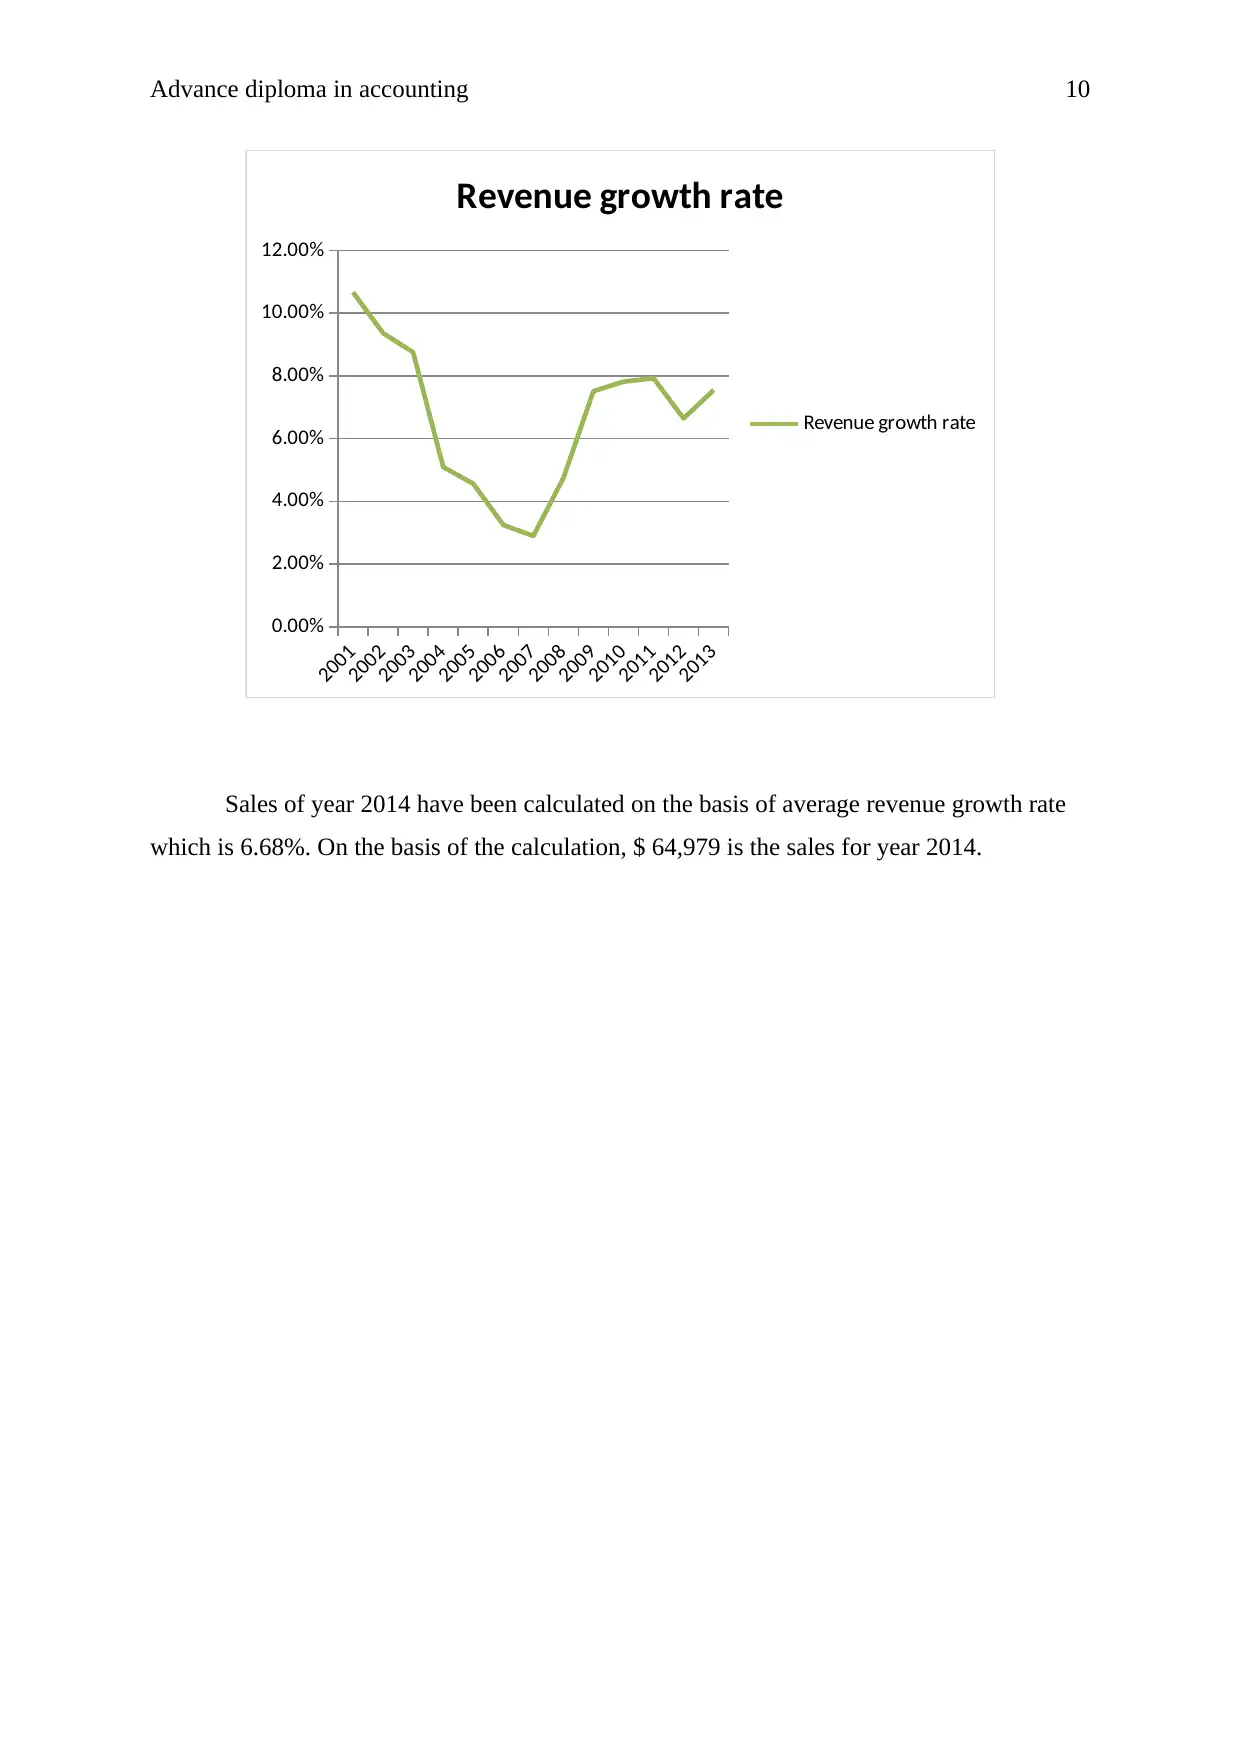
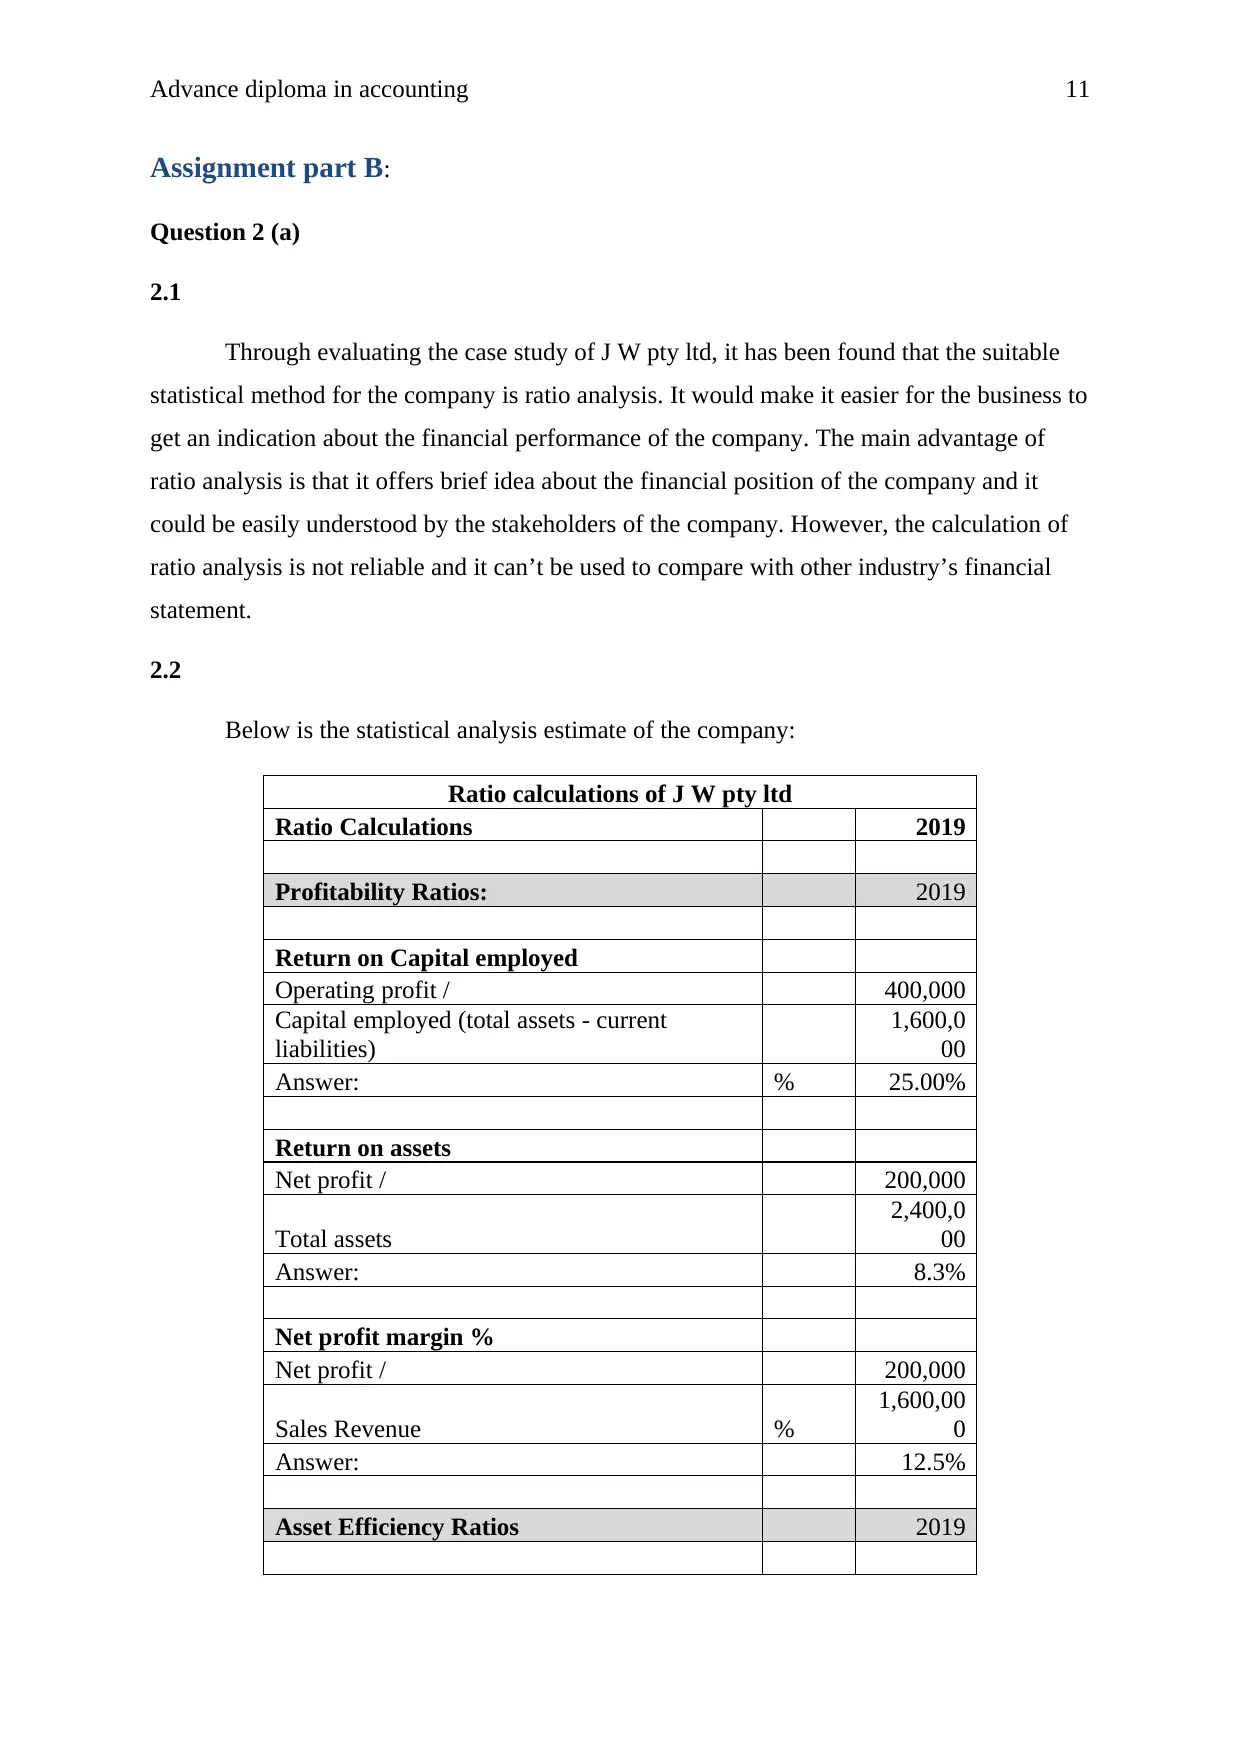
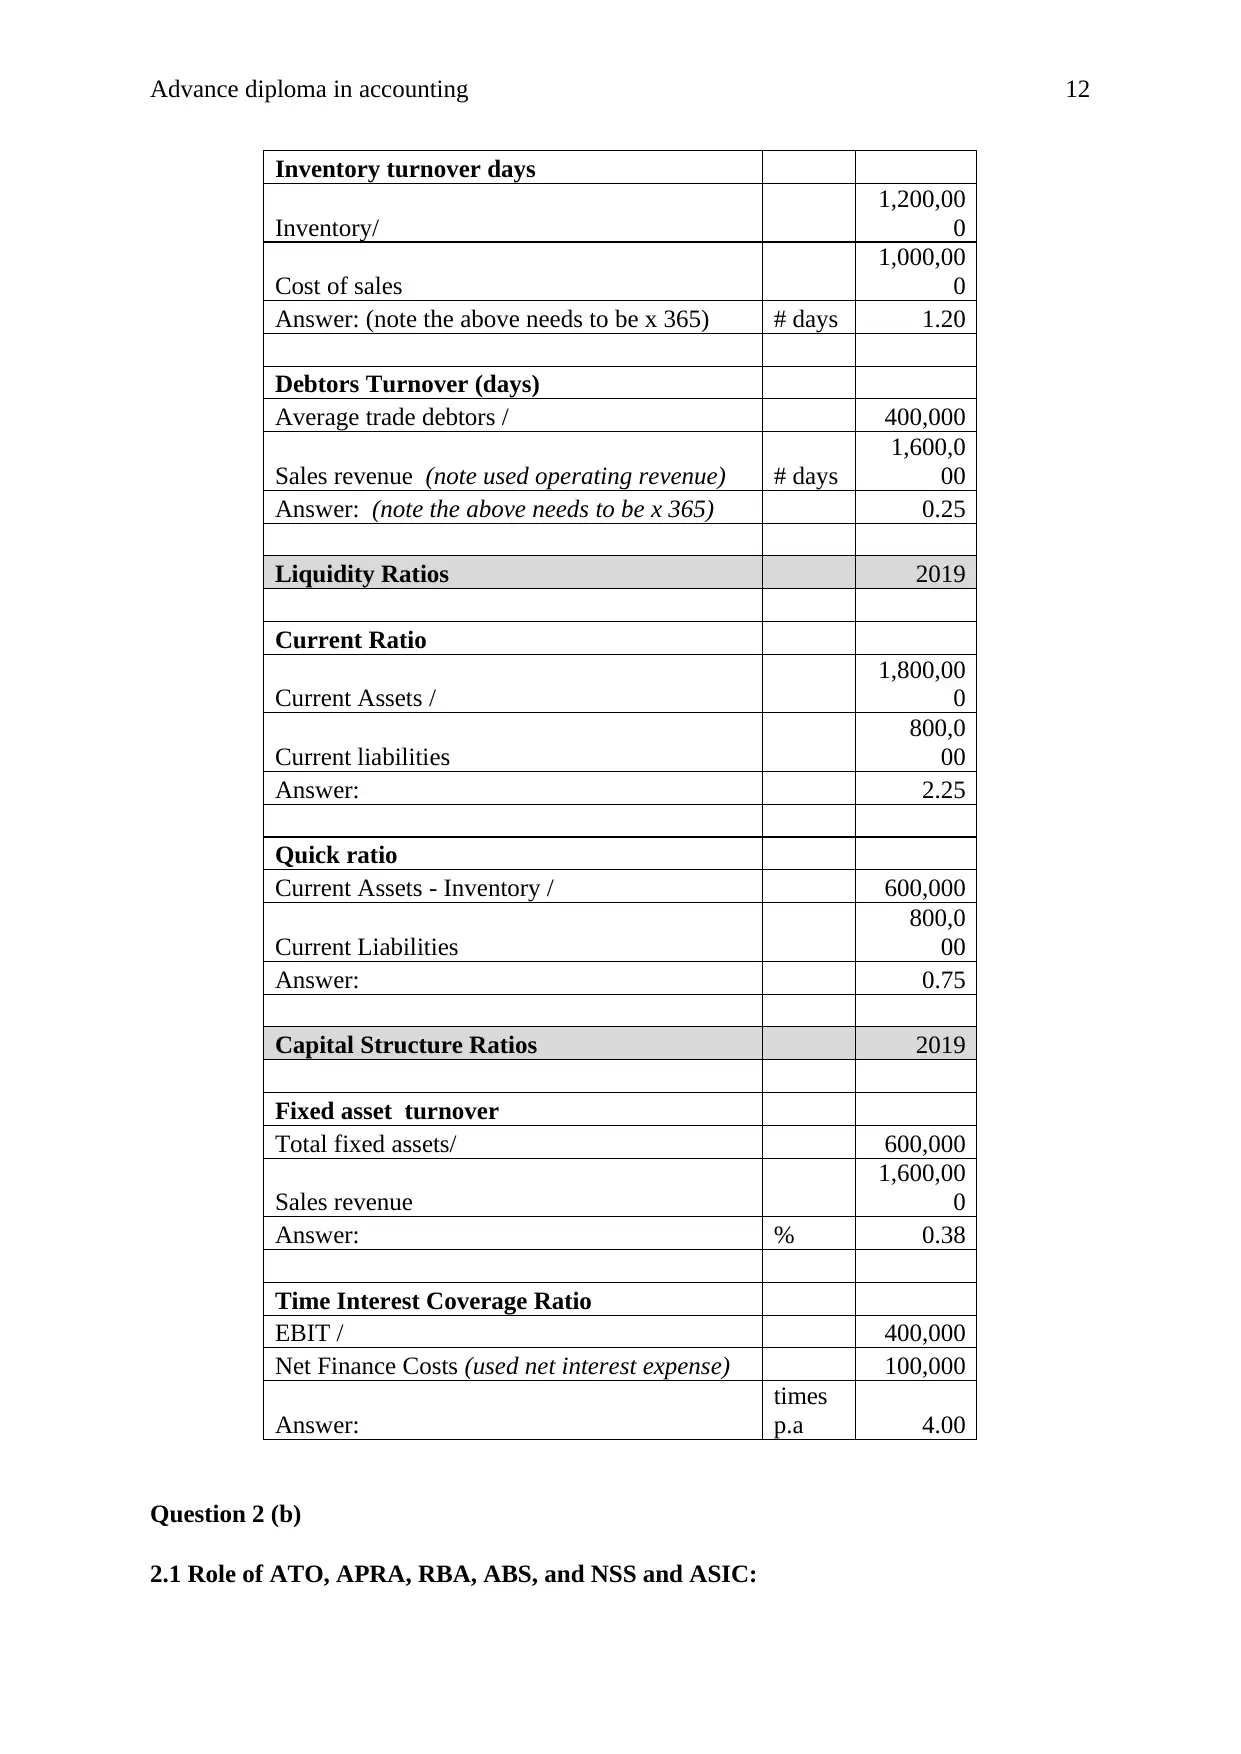
This project report, prepared for an Advanced Diploma in Accounting, delves into financial statistics and their application. Part A covers sampling methods, statistical standards, modeling, and various analytical tools like measures of frequency, central tendency, and ratio analysis. It examines sources of financial information and statistical data from the Australian Bureau of Statistics (ABS) and Reserve Bank of Australia (RBA). The report includes data representation through tables and graphs, demonstrating calculations and interpretations. Part B focuses on a case study of J W Pty Ltd, employing ratio analysis to assess the company's financial performance. It explores the roles of regulatory bodies like ATO, APRA, RBA, ABS, and ASIC. The report uses annual and internal reports for data collection, along with graphical representations and calculations, to illustrate sales growth, staff numbers, and other relevant financial metrics.
Contribute Materials
Your contribution can guide someone’s learning journey. Share your
documents today.

Running Head: Advance diploma in accounting
1
Project Report: Advance diploma in accounting
1
Project Report: Advance diploma in accounting
Secure Best Marks with AI Grader
Need help grading? Try our AI Grader for instant feedback on your assignments.

Advance diploma in accounting 2
Assignment part A:
Question 1 (a) Sampling:
Sampling is selection of few people among the population to estimate the
characteristics of the whole population around. Sampling is important for a researcher to
identify and represent the entire population in few numbers. The main advantage of sampling
is faster data collection and lower cost than measuring the survey on entre population around.
There are various sampling methods; few of them have given below:
ï‚· Simple random sampling
ï‚· voluntary sampling
ï‚· snowball sampling
ï‚· Quota sampling
ï‚· Cluster sampling
Further, the common sampling error reasons are as follows:
ï‚· Population septic error
ï‚· Selection error
ï‚· sample frame error
ï‚· non-response
ï‚· sampling error etc (Deegan, 2013)
Question 2
A statistic standard is a set of rules which are used by the researchers to standardize
the way information and data has gathered and statistical are produced. It offers information
about the data gathered on a specific research topic and helps the relevant parties to
understand and interpret data for the betterment of the report.
Question 3
A statistical modelling is a model which is used by taking the concern over the
mathematical numbers. It embodies a set of various assumption related to statistical that
concerns the generation of the sample data. Statistical model basically presets about the data
generating process in an idealized form. It sets the mathematical relation among the one or
more than one random and non-Random variable. It is basically called a formal
representation of a theory. In statistical modelling, below graphs and charts are prepared to

Advance diploma in accounting 3
present the data in a mathematical form so that it could be easily understood by the
researchers and other users:
ï‚· Histogram
ï‚· Bar chart
ï‚· Line chart
ï‚· Pie chart
ï‚· Timeline chart
ï‚· Tree chart
ï‚· Flow chart (Davies and Crawford, 2011)
These graphs and chart helps the researcher to present about the research in an ideal
and understandable manner.
Question 4:
Below is little statistical method which could be used by the researcher while
conducting the research to represent about the facts and figures in brief manner:
ï‚· Measure of frequency
ï‚· Measure of central tendency
ï‚· Measure of variation or dispersion
ï‚· Measure of position
These make it easier for the researcher to represent about the entire data and
performance of the research.
Question 5:
In order to analyze the financial service industry, below statistical ratios and analysis
tool could be used by the researcher:
ï‚· Comparative financial statement
ï‚· common size financial statement
ï‚· Trend analysis
ï‚· Ratio analysis
ï‚· Cash flow analysis (Damodaran, 2011)
These methods offer a detailed description about the financial performance and position
of the research topic and industry in the market. In these methods, financial statement and

Advance diploma in accounting 4
other financial data of the company are taken into the concern to identify about the current
performance and future changes which could be occurred in the business according to the
historical performance.
Question 6:
In a financial service industry, below source of information could be easily identified:
ï‚· Financial statement of industry
ï‚· Market capital of industry
ï‚· Market share of industry
ï‚· growth of industry
ï‚· Changes into industry
ï‚· Impact of economy over the industry
 stockholder’s worth
ï‚· associated risk with the investment
ï‚· Return from the industry (Gapenski, 2010)
Question 7:
RBA and ABS stands for Australian bureau of statistics and reserve bank of Australia.
The ABS is Australia’s national agency of statistics data which provides the trusted official
facts and statistics at wide range of population, social, economical and environmental matters
in concern to the Australian growth. Key ABS statistical collection is as follows:
ï‚· International trade
ï‚· Labour force
ï‚· Consumer price index
ï‚· Australian national accounts
ï‚· Population trends
The RBA is Australia’s central bank along with the legislative responsibilities. It gathers
and published the data related to credit, money and Australian banking system along with the
other economical relevant metrics. Key RBA statistical collection is as follows:
ï‚· Money and credit statistics
ï‚· Banking system liabilities and assets
ï‚· interest rate
Secure Best Marks with AI Grader
Need help grading? Try our AI Grader for instant feedback on your assignments.

Advance diploma in accounting 5
ï‚· household and business finances
ï‚· exchange rate
ï‚· inflation rate and inflation expectations (Brown, Beekes and Verhoeven, 2011)
Question 8:
Equation = Y = 4X-2
Table:
X Y
1 2
2 6
3 10
4 14
Graph:
1 2 3 4
0
2
4
6
8
10
12
14
16
Y
Axis Title
Question 9:
Table:
Age Purchase
of trees
10–20 6
ï‚· household and business finances
ï‚· exchange rate
ï‚· inflation rate and inflation expectations (Brown, Beekes and Verhoeven, 2011)
Question 8:
Equation = Y = 4X-2
Table:
X Y
1 2
2 6
3 10
4 14
Graph:
1 2 3 4
0
2
4
6
8
10
12
14
16
Y
Axis Title
Question 9:
Table:
Age Purchase
of trees
10–20 6

Advance diploma in accounting 6
20–30 12
30–40 15
40–50 3
50–60 2
Graph:
10–20
20–30
30–40
40–50
50–60
0 2 4 6 8 10 12 14 16
Purchase of trees
Purchase of trees
Question 10
Tables:
Time 0 1 2 2.5 3 3.33 4 5 6
Distanc
e
0 60 120 150 180 200 240 300 360
Graph:
20–30 12
30–40 15
40–50 3
50–60 2
Graph:
10–20
20–30
30–40
40–50
50–60
0 2 4 6 8 10 12 14 16
Purchase of trees
Purchase of trees
Question 10
Tables:
Time 0 1 2 2.5 3 3.33 4 5 6
Distanc
e
0 60 120 150 180 200 240 300 360
Graph:

Advance diploma in accounting 7
0 1 2 2.5 3 3.33 4 5 6
0
50
100
150
200
250
300
350
400
Distance
Axis Title
The above graph indicates that car would travel 150 kms in 2.5 hour. Further, it has
been found that in order to travel 200 Km, 3.33 hours is required by the car.
Question 11:
Table:
Cost of toll($) Dandenon
g
Mean Mean *
Frequency
Frankston Mean Mean *
Frequency
30 < 60 40 45 1800 10 45 450
60 < 90 124 75 9300 60 75 4500
90 < 120 192 105 20160 131 105 13755
120 < 150 101 135 13635 122 135 16470
150 < 180 30 165 4950 81 165 13365
180 < 210 7 195 1365 42 195 8190
210 < 240 3 225 675 28 225 6300
240 < 270 2 255 510 15 255 3825
270 < 300 1 285 285 11 285 3135
Sum 500 52680 500 69990
Calculations:
Mean
Dandenong <=52680/500 105.36
Frankston <=69990/500 139.98
Paraphrase This Document
Need a fresh take? Get an instant paraphrase of this document with our AI Paraphraser

Advance diploma in accounting 8
Estimated median
Dandenong <=60+(((270/2)-40)/124)*30
82.9838
7
Frankston <=90+(((270/2)-110)/105)*30
97.1428
6
Mode
Dandenong
<=90+(((192-124)/((192-124)+(192-
101)))*30)
102.830
2
Frankston <=90+(((131-60)/((131-60)+(131-122)))*30) 116.625
Standard deviation
Dandenong 68.21494
Frankston 46.66667
Co efficient of
variation
Dandenong 64.74%
Frankston 33.34%
Question 12:
D. No, because every possible 400-buyer sample did not have an equal chance of
being chosen. Because a sample random sample requires that every sample of size n has an
equal chance to be selected and in this case, it is not possible for the researcher to randomly
collect the 100 n from each of the brand.
Question 13:
Year Sales
3-year
moving
average
Revenue
growth
rate
1998 23156
1999 24569
2000 25689
24471.3
3
2001 30987
27081.6
7 10.67%
2002 32176
29617.3
3 9.36%
2003 33467 32210 8.75%
2004 35908
33850.3
3 5.09%

Advance diploma in accounting 9
2005 36809
35394.6
7 4.56%
2006 36911
36542.6
7 3.24%
2007 39081
37600.3
3 2.89%
2008 42164
39385.3
3 4.75%
2009 45789
42344.6
7 7.51%
2010 49012 45655 7.82%
2011 53024 49275 7.93%
2012 55609
52548.3
3 6.64%
2013 60911
56514.6
7 7.55%
2014 (2013 sales
*6.68%) 4068.8548
6.68%
2000
2002
2004
2006
2008
2010
2012
0
10000
20000
30000
40000
50000
60000
3-year moving avarge

Advance diploma in accounting 10
2001
2002
2003
2004
2005
2006
2007
2008
2009
2010
2011
2012
2013
0.00%
2.00%
4.00%
6.00%
8.00%
10.00%
12.00%
Revenue growth rate
Revenue growth rate
Sales of year 2014 have been calculated on the basis of average revenue growth rate
which is 6.68%. On the basis of the calculation, $ 64,979 is the sales for year 2014.
Secure Best Marks with AI Grader
Need help grading? Try our AI Grader for instant feedback on your assignments.

Advance diploma in accounting 11
Assignment part B:
Question 2 (a)
2.1
Through evaluating the case study of J W pty ltd, it has been found that the suitable
statistical method for the company is ratio analysis. It would make it easier for the business to
get an indication about the financial performance of the company. The main advantage of
ratio analysis is that it offers brief idea about the financial position of the company and it
could be easily understood by the stakeholders of the company. However, the calculation of
ratio analysis is not reliable and it can’t be used to compare with other industry’s financial
statement.
2.2
Below is the statistical analysis estimate of the company:
Ratio calculations of J W pty ltd
Ratio Calculations 2019
Profitability Ratios: 2019
Return on Capital employed
Operating profit / 400,000
Capital employed (total assets - current
liabilities)
1,600,0
00
Answer: % 25.00%
Return on assets
Net profit / 200,000
Total assets
2,400,0
00
Answer: 8.3%
Net profit margin %
Net profit / 200,000
Sales Revenue %
1,600,00
0
Answer: 12.5%
Asset Efficiency Ratios 2019

Advance diploma in accounting 12
Inventory turnover days
Inventory/
1,200,00
0
Cost of sales
1,000,00
0
Answer: (note the above needs to be x 365) # days 1.20
Debtors Turnover (days)
Average trade debtors / 400,000
Sales revenue (note used operating revenue) # days
1,600,0
00
Answer: (note the above needs to be x 365) 0.25
Liquidity Ratios 2019
Current Ratio
Current Assets /
1,800,00
0
Current liabilities
800,0
00
Answer: 2.25
Quick ratio
Current Assets - Inventory / 600,000
Current Liabilities
800,0
00
Answer: 0.75
Capital Structure Ratios 2019
Fixed asset turnover
Total fixed assets/ 600,000
Sales revenue
1,600,00
0
Answer: % 0.38
Time Interest Coverage Ratio
EBIT / 400,000
Net Finance Costs (used net interest expense) 100,000
Answer:
times
p.a 4.00
Question 2 (b)
2.1 Role of ATO, APRA, RBA, ABS, and NSS and ASIC:

Advance diploma in accounting 13
ATO’s main role is to depict about the taxation process and collect the taxation
amount from the individual and corporation of Australia.
APRA’s main role is to develop and enforce the prudential framework which
promotes cautious behaviour of superannuation funds, insurance companies and other
financial institute.
RBA’s main role is to manage banking system, credit rates and economical
performance of the country (Brigham and Ehrhardt, 2013).
Further, ABS is an antiskid baking system which uses the various tools to manage the
baking process of the company. NSS and ASIC manages the statistical facts of the country in
order to improve the economical and monetary performance of the company.
2.2
In case of J W Pty ltd, these bodies would help the company to manage the
economical performance and would also help them maintain the internal performance of the
company on the basis of various approached policies and strategies of the company.
Question 2 (c)
In order to gather the current relevant data of the company, annual report and internal
reports of the company should be identified. It is the most reliable data to make the decision
about the company. Further, ABS data is most trustworthy data to make any decision. It is
approved by the various government bodies.
Question 2 (d)
The below graph explains that the most preferable colour is orange.
Paraphrase This Document
Need a fresh take? Get an instant paraphrase of this document with our AI Paraphraser

Advance diploma in accounting 14
Number sold
Red
Blue
Green
Purple
Orange
White
Question 2 (e)
Table:
Year Sales ($) Growth rate
2005 10000
2006 11000 10.00%
2007 12000 9.09%
2008 12500 4.17%
2009 16000 28.00%
2010 18000 12.50%
2011 25000 38.89%
2012 40000 60.00%
2013 41000 2.50%
2014 43000 4.88%
2015 50000 16.28%
50000 18.63%
2016 59315
2017 70366
2018 83475
2019 99027
Graph:

Advance diploma in accounting 15
2005
2006
2007
2008
2009
2010
2011
2012
2013
2014
2015
0
10000
20000
30000
40000
50000
60000
Sales ($)
Sales ($)
Explanation:
On the basis of the study, it has been recognized that the average growth in the sales
of the company is 18.63%. It indicates that the sales of the company would be 99027 by the
end of year 2019.
Question 2 (f)
Table:
Year Staff
Number Growth
2005 60
2006 70 16.67%
2007 75 7.14%
2008 90 20.00%
2009 92 2.22%
2010 95 3.26%
2011 97 2.11%
2012 100 3.09%
2013 110 10.00%
2014 120 9.09%
8.18%
2015 129.81
2016 140.42
2017 151.90
2018 164.32

Advance diploma in accounting 16
Graph:
2005
2006
2007
2008
2009
2010
2011
2012
2013
2014
2015
0
20
40
60
80
100
120
140
Staff Number
Staff Number
Explanation:
On the basis of the study, it has been recognized that the average growth in the staff
number of the company is 8.18%. It indicates that the staff number of the company would be
164 by the end of year 2018.
Question 2 (g)
Correlation coefficient:
X Y
12 200
15 230
18 250
19 270
20 280
22 300
Correl 0.99363138
Correlation coefficient is used to identify the strength in the relation among two or
more variables. On the basis of advertising and sales correlation, it has been found that the
relation among the variable is positive (Bierman, 2010). Changes into one variable impact
over the variable positively. Hence, the business is required to spend some money on the
advertisement. It would improve the sales of the company.
Secure Best Marks with AI Grader
Need help grading? Try our AI Grader for instant feedback on your assignments.

Advance diploma in accounting 17
Question 2 (h)
Cost of toll($) Value Mid
value
Mid*
Frequenc
y
50-60 7 55 385
60-70 12 65 780
70-80 26 75 1950
80-90 4 85 340
90-100 31 95 2945
100-110 15 105 1575
110-120 22 115 2530
Sum 117 10505
Mean
Value <=10505/117
89.7863
2
Estimated median
Value <=90+(((70/2)-31)/49)*10
90.8163
3
Mode
Value
<=90+(((31-4)/((31-4)+(31-
15)))*10)
102.830
2
Standard deviation
Value 9.995237
Co efficient of
variation
Value 11.13%
Question 2 (i)
Introduction:
The report has been prepared on J W pty ltd. On the basis of the case study various
statistical tools have been applied over the company to reach over a conclusion.
Analysis:

Advance diploma in accounting 18
On the basis of ratio analysis study, it has been recognized that the overall
profitability position of the company is quite improved. Asset efficiency level explains that
the performance of the company is quite efficient. Working capital level is managed by the
company at great level. More to it, other financial ratios define about better financial position
of the company (Brealey, Myers and Marcus, 2017).
Further, on the basis of other statistical data of the company, it has been found that
company should spend on advertisement to improve the sales of the company. Orange colour
phone must be produced because the sale of this colour is higher.
Conclusion:
To conclude, company is performing well in the market and few changes could
improve the overall performance of the company.
Question 2 (j)
The data must be gathered from the reliable sources and it must be properly
referenced. Along with that, data must be approved by the government authorities. It
improves the authenticity and reliability of the data. In case of organization, data must be
collected from the audited financial statement of the company.
Question 2 (k)
Storage of data is quite essential for the researcher and other parties. One of the main
benefit of storing the data is he data of user is safe and it could be accessed at any time. Data
could be recovered at any time to make decision or to conduct the future study (Besley and
Brigham, 2018).
A user can protect the data on cloud so that it could be accessed from anywhere and
could be recovering easily.
Question 2 (l)
The process of protect the document is as follows:
1. Open the document.
2. Click preferences on word menu
3. Click on personal setting, choose security.
4. A password box would be pop up, type a password and click OK.

Advance diploma in accounting 19
Paraphrase This Document
Need a fresh take? Get an instant paraphrase of this document with our AI Paraphraser

Advance diploma in accounting 20
References:
Besley, S. and Brigham, E.F., 2018. Essentials of managerial finance. Thomson South-
Western.
Bierman, H., 2010. An introduction to accounting and managerial finance: a merger of
equals. World Scientific.
Brealey, R., Myers, S.C. and Marcus, A.J., 2017. FundamentalsofCorporate Finance. Mc
Graw Hill, New York.
Brigham, E.F. and Ehrhardt, M.C., 2013. Financial management: Theory & practice.
Cengage Learning.
Brown, P., Beekes, W. and Verhoeven, P., 2011. Corporate governance, accounting and
finance: A review. Accounting & finance, 51(1), pp.96-172.
Damodaran, A, 2011, Applied corporate finance,3rd edition, John Wiley & sons, USA
Davies, T. and Crawford, I., 2011. Business accounting and finance. Pearson.
Deegan, C., 2013. Financial accounting theory. McGraw-Hill Education Australia.
Gapenski, L.C., 2010. Healthcare finance: an introduction to accounting and financial
management. Health Administration Press.
1 out of 20
Related Documents

Your All-in-One AI-Powered Toolkit for Academic Success.
 +13062052269
info@desklib.com
Available 24*7 on WhatsApp / Email
Unlock your academic potential
© 2024  |  Zucol Services PVT LTD  |  All rights reserved.