Advanced Research Methods: Alcohol Study Report Analysis, Findings
VerifiedAdded on 2021/02/21
|23
|6734
|118
Report
AI Summary
This report analyzes data from an alcohol study conducted by an alcohol support clinic, using SPSS for statistical analysis. The study involved 116 participants, including university students, and collected data on demographics, alcohol consumption, and various scales related to alcohol risk and health. The report is divided into sections covering descriptive statistics, including participant demographics, and analysis of variables such as Visual Analogue Scales (VAS) and Health Value Scales (HVS). It also includes Levene's test for equality of variances, Pearson's correlation, and ANOVA tests to determine relationships between variables like alcohol-related illness, gender, and accommodation type. The findings highlight the relationships between perceived risk, self-efficacy, and health values and their impact on alcohol-related illnesses, with implications for understanding and addressing alcohol-related issues.
ADVANCED
RESEARCH
METHODS
RESEARCH
METHODS
Paraphrase This Document
Need a fresh take? Get an instant paraphrase of this document with our AI Paraphraser
Table of Contents
Introductory Comments:..................................................................................................................1
Report Overview....................................................................................................................1
Aim of the Report...................................................................................................................1
Participant detail/setting.........................................................................................................1
Brief Summary of Dataset......................................................................................................1
Treatment ...............................................................................................................................1
Section 1...........................................................................................................................................2
Descriptive/demographic information for participants..........................................................2
Descriptive information for cigarettes smoked......................................................................2
Summary.................................................................................................................................3
Section 2...........................................................................................................................................3
Brief summary of the Section.................................................................................................3
Descriptive of VAS and HVS.................................................................................................3
Levene’s test and summary (equality of variances)...............................................................5
Section 3...........................................................................................................................................6
Section introduction................................................................................................................6
Descriptive information in table format.................................................................................7
Commentary/summary of the findings using appropriate statistical information..................7
Implications of findings..........................................................................................................8
Section 4...........................................................................................................................................8
Descriptive Statistics..............................................................................................................8
Homogeneity Test of Variances.............................................................................................9
Post-Hoc Test.......................................................................................................................12
Section 5.........................................................................................................................................14
Part 1.....................................................................................................................................14
Part 2....................................................................................................................................14
REFERENCES..............................................................................................................................15
APPENDICES...............................................................................................................................16
Introductory Comments:
Report Overview
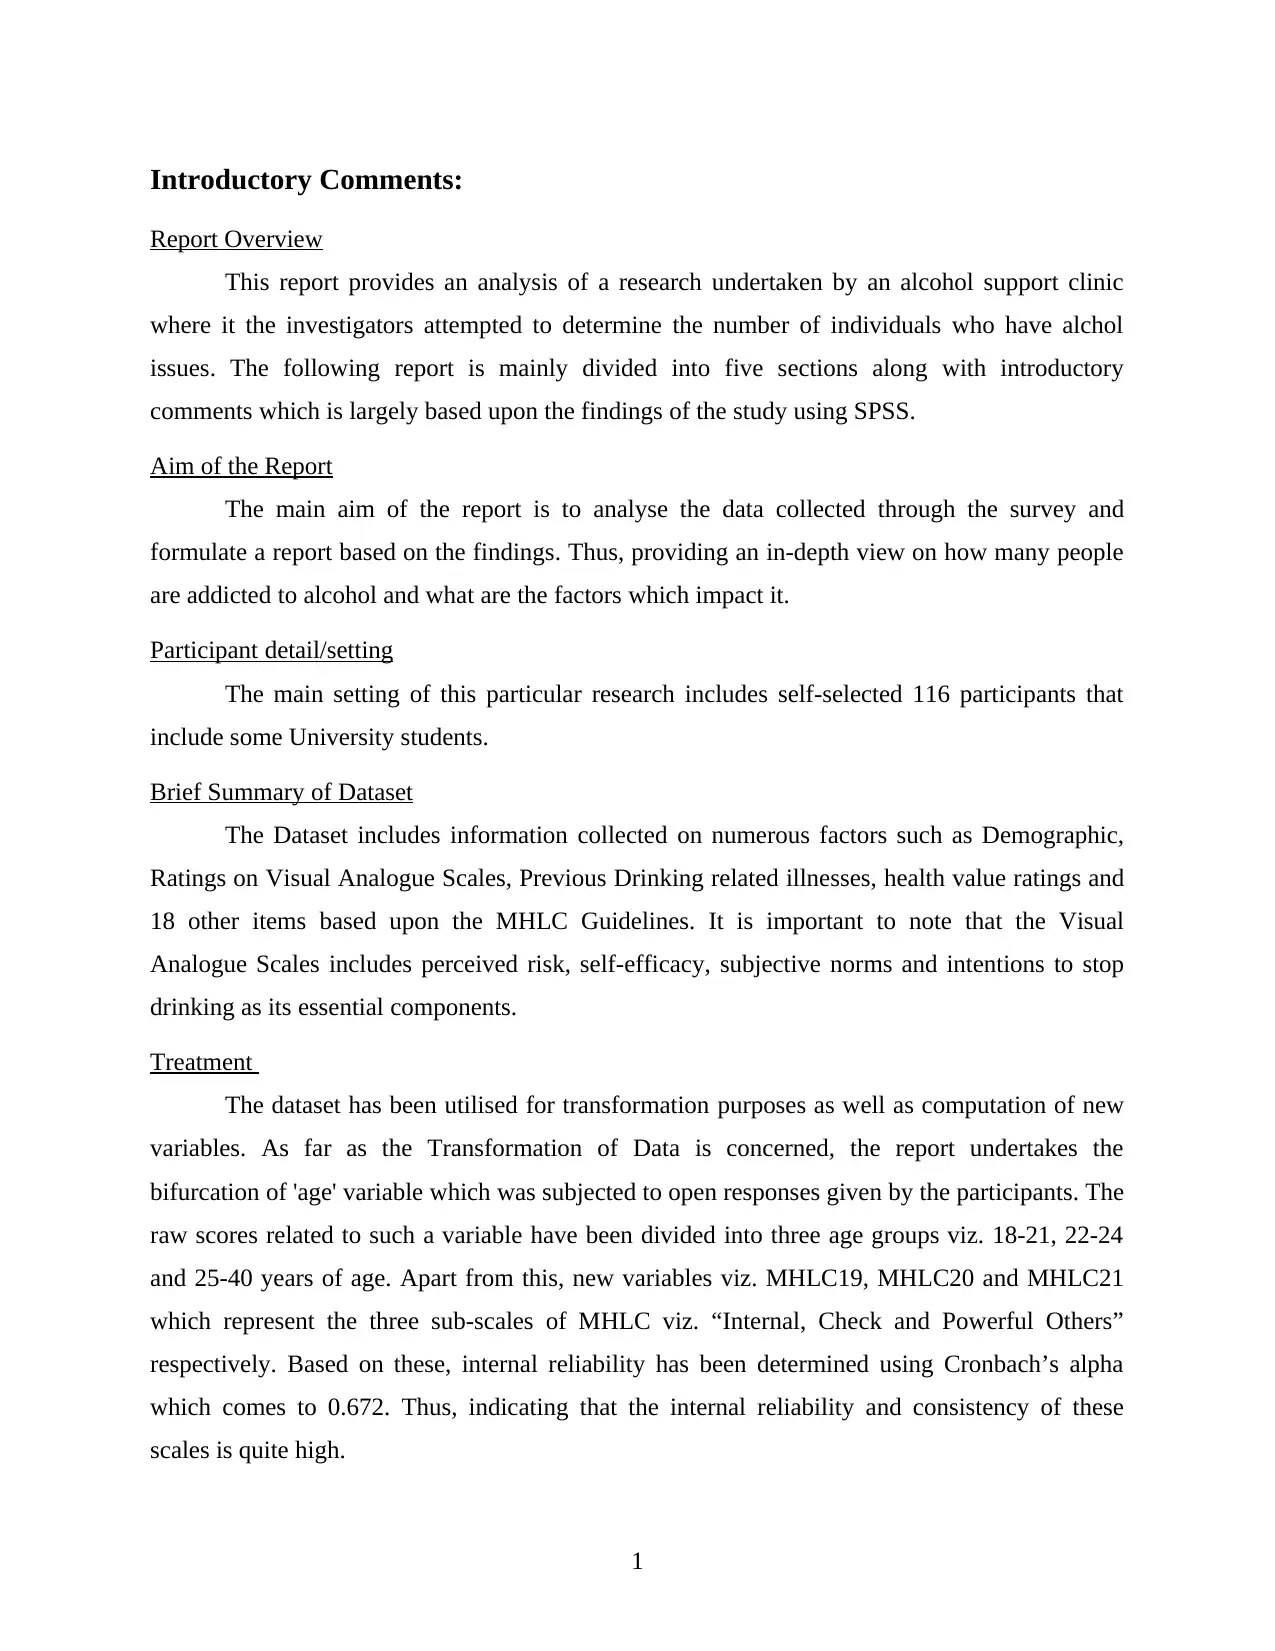
This report provides an analysis of a research undertaken by an alcohol support clinic
where it the investigators attempted to determine the number of individuals who have alchol
issues. The following report is mainly divided into five sections along with introductory
comments which is largely based upon the findings of the study using SPSS.
Aim of the Report
The main aim of the report is to analyse the data collected through the survey and
formulate a report based on the findings. Thus, providing an in-depth view on how many people
are addicted to alcohol and what are the factors which impact it.
Participant detail/setting
The main setting of this particular research includes self-selected 116 participants that
include some University students.
Brief Summary of Dataset
The Dataset includes information collected on numerous factors such as Demographic,
Ratings on Visual Analogue Scales, Previous Drinking related illnesses, health value ratings and
18 other items based upon the MHLC Guidelines. It is important to note that the Visual
Analogue Scales includes perceived risk, self-efficacy, subjective norms and intentions to stop
drinking as its essential components.
Treatment
The dataset has been utilised for transformation purposes as well as computation of new
variables. As far as the Transformation of Data is concerned, the report undertakes the
bifurcation of 'age' variable which was subjected to open responses given by the participants. The
raw scores related to such a variable have been divided into three age groups viz. 18-21, 22-24
and 25-40 years of age. Apart from this, new variables viz. MHLC19, MHLC20 and MHLC21
which represent the three sub-scales of MHLC viz. “Internal, Check and Powerful Others”
respectively. Based on these, internal reliability has been determined using Cronbach’s alpha
which comes to 0.672. Thus, indicating that the internal reliability and consistency of these
scales is quite high.
1
Report Overview
This report provides an analysis of a research undertaken by an alcohol support clinic
where it the investigators attempted to determine the number of individuals who have alchol
issues. The following report is mainly divided into five sections along with introductory
comments which is largely based upon the findings of the study using SPSS.
Aim of the Report
The main aim of the report is to analyse the data collected through the survey and
formulate a report based on the findings. Thus, providing an in-depth view on how many people
are addicted to alcohol and what are the factors which impact it.
Participant detail/setting
The main setting of this particular research includes self-selected 116 participants that
include some University students.
Brief Summary of Dataset
The Dataset includes information collected on numerous factors such as Demographic,
Ratings on Visual Analogue Scales, Previous Drinking related illnesses, health value ratings and
18 other items based upon the MHLC Guidelines. It is important to note that the Visual
Analogue Scales includes perceived risk, self-efficacy, subjective norms and intentions to stop
drinking as its essential components.
Treatment
The dataset has been utilised for transformation purposes as well as computation of new
variables. As far as the Transformation of Data is concerned, the report undertakes the
bifurcation of 'age' variable which was subjected to open responses given by the participants. The
raw scores related to such a variable have been divided into three age groups viz. 18-21, 22-24
and 25-40 years of age. Apart from this, new variables viz. MHLC19, MHLC20 and MHLC21
which represent the three sub-scales of MHLC viz. “Internal, Check and Powerful Others”
respectively. Based on these, internal reliability has been determined using Cronbach’s alpha
which comes to 0.672. Thus, indicating that the internal reliability and consistency of these
scales is quite high.
1
⊘ This is a preview!⊘
Do you want full access?
Subscribe today to unlock all pages.
Trusted by 1+ million students worldwide
Section 1
Descriptive/demographic information for participants
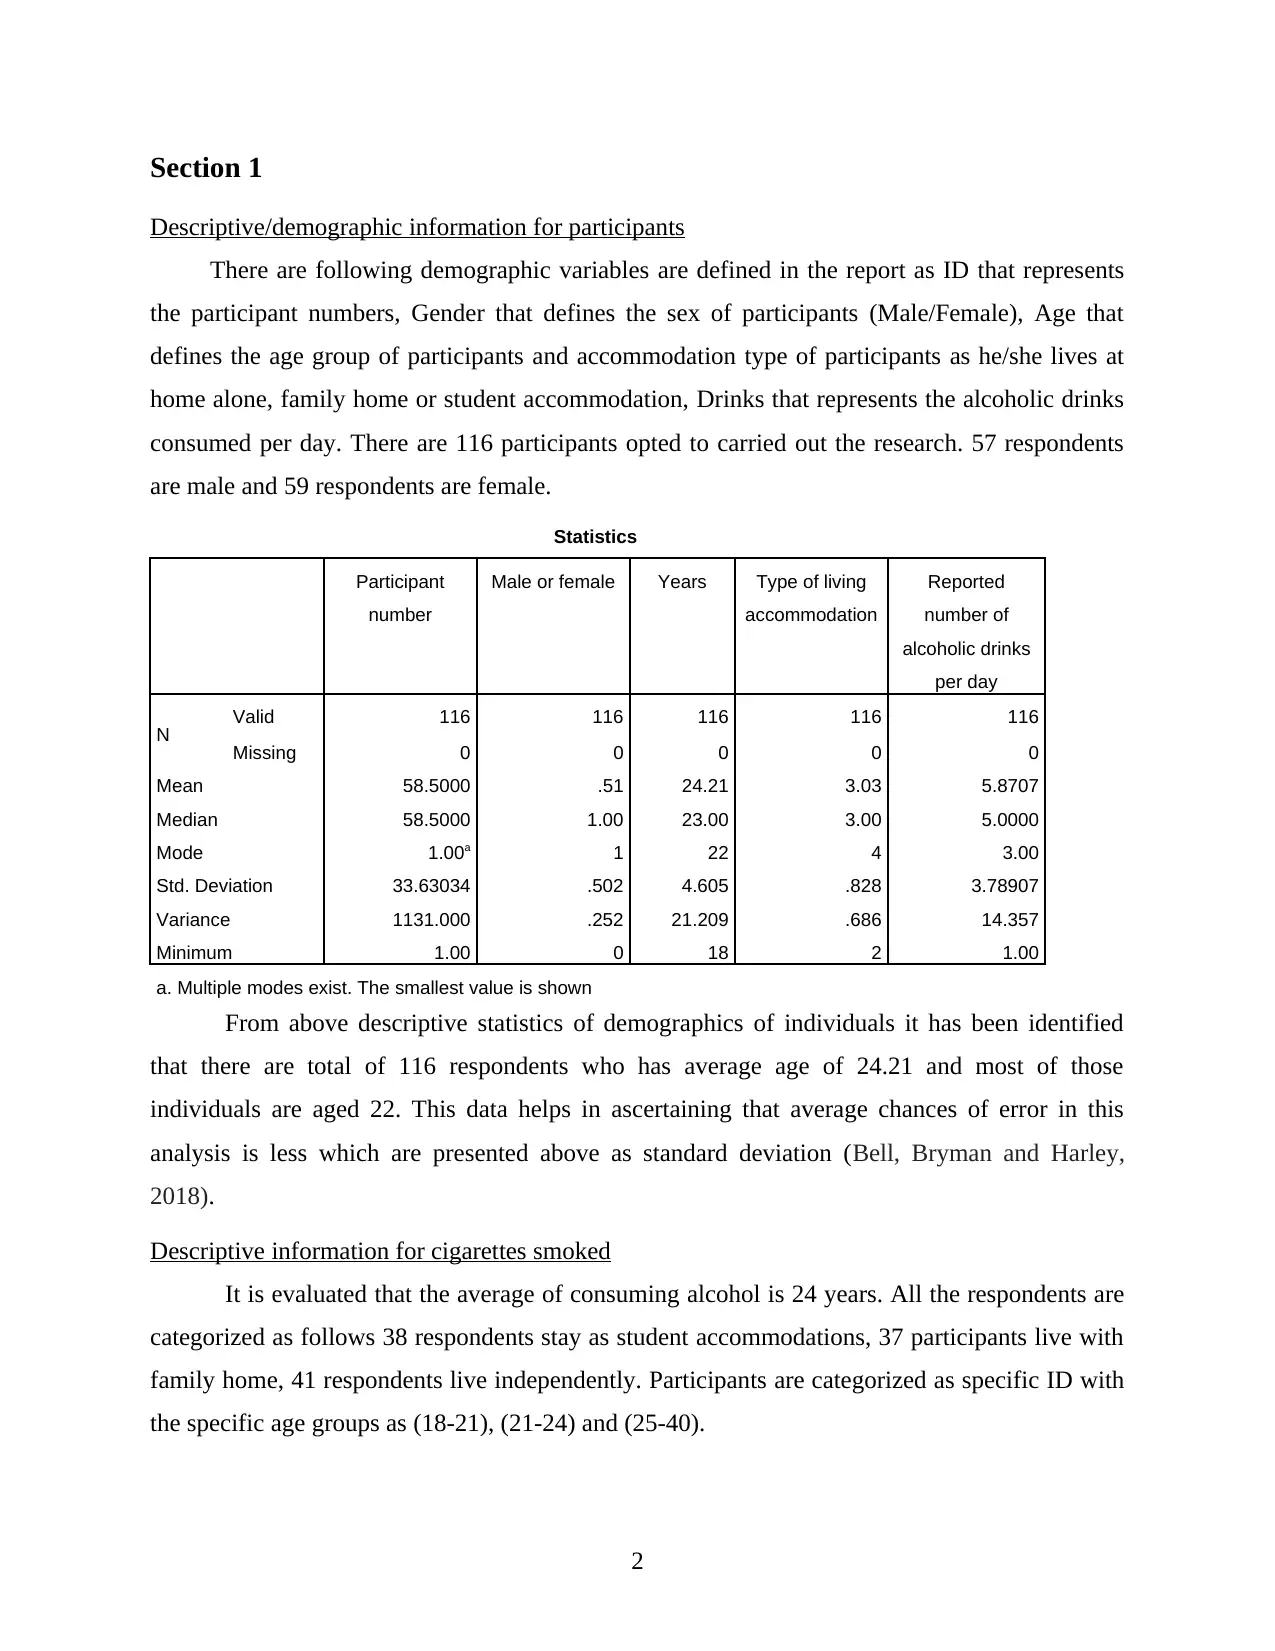
There are following demographic variables are defined in the report as ID that represents
the participant numbers, Gender that defines the sex of participants (Male/Female), Age that
defines the age group of participants and accommodation type of participants as he/she lives at
home alone, family home or student accommodation, Drinks that represents the alcoholic drinks
consumed per day. There are 116 participants opted to carried out the research. 57 respondents
are male and 59 respondents are female.
Statistics
Participant
number
Male or female Years Type of living
accommodation
Reported
number of
alcoholic drinks
per day
N Valid 116 116 116 116 116
Missing 0 0 0 0 0
Mean 58.5000 .51 24.21 3.03 5.8707
Median 58.5000 1.00 23.00 3.00 5.0000
Mode 1.00a 1 22 4 3.00
Std. Deviation 33.63034 .502 4.605 .828 3.78907
Variance 1131.000 .252 21.209 .686 14.357
Minimum 1.00 0 18 2 1.00
a. Multiple modes exist. The smallest value is shown
From above descriptive statistics of demographics of individuals it has been identified
that there are total of 116 respondents who has average age of 24.21 and most of those
individuals are aged 22. This data helps in ascertaining that average chances of error in this
analysis is less which are presented above as standard deviation (Bell, Bryman and Harley,
2018).
Descriptive information for cigarettes smoked
It is evaluated that the average of consuming alcohol is 24 years. All the respondents are
categorized as follows 38 respondents stay as student accommodations, 37 participants live with
family home, 41 respondents live independently. Participants are categorized as specific ID with
the specific age groups as (18-21), (21-24) and (25-40).
2
Descriptive/demographic information for participants
There are following demographic variables are defined in the report as ID that represents
the participant numbers, Gender that defines the sex of participants (Male/Female), Age that
defines the age group of participants and accommodation type of participants as he/she lives at
home alone, family home or student accommodation, Drinks that represents the alcoholic drinks
consumed per day. There are 116 participants opted to carried out the research. 57 respondents
are male and 59 respondents are female.
Statistics
Participant
number
Male or female Years Type of living
accommodation
Reported
number of
alcoholic drinks
per day
N Valid 116 116 116 116 116
Missing 0 0 0 0 0
Mean 58.5000 .51 24.21 3.03 5.8707
Median 58.5000 1.00 23.00 3.00 5.0000
Mode 1.00a 1 22 4 3.00
Std. Deviation 33.63034 .502 4.605 .828 3.78907
Variance 1131.000 .252 21.209 .686 14.357
Minimum 1.00 0 18 2 1.00
a. Multiple modes exist. The smallest value is shown
From above descriptive statistics of demographics of individuals it has been identified
that there are total of 116 respondents who has average age of 24.21 and most of those
individuals are aged 22. This data helps in ascertaining that average chances of error in this
analysis is less which are presented above as standard deviation (Bell, Bryman and Harley,
2018).
Descriptive information for cigarettes smoked
It is evaluated that the average of consuming alcohol is 24 years. All the respondents are
categorized as follows 38 respondents stay as student accommodations, 37 participants live with
family home, 41 respondents live independently. Participants are categorized as specific ID with
the specific age groups as (18-21), (21-24) and (25-40).
2
Paraphrase This Document
Need a fresh take? Get an instant paraphrase of this document with our AI Paraphraser
The descriptive analysis presented above also has statistical information of reported
number of alcoholic drinks which are consumed by them per day. It has been analysed that an
average number of drinks consumed by an individual is 5.87 and minimum number of drinks
consumed in a day is one. It is also observed that 3 drinks are consumed by most of the
individuals participated in this study.
Summary
The interesting fact found in the analysis is that on an average 5 drinks are consumed by
participants and female participants consumes drinks more compared to male participants. The
relations between the participants is evaluated as 3.78 and the standard order of categorized gaps
recognized as per age (Bonett and Wright, 2015). Approx. 33 participants are found different
more categorized with critical aspects. Living accommodation type states that 20 male
participants live as student accommodation, 13 male types lives as family home and 24 male
types live as independently. Same as male participants, 18 female live in student
accommodation, 24 females as family home and 17 females lives independently. In total 38
participants live with student accommodation, 37 lives as family home and 41 participants lives
as independently.
Section 2
Brief summary of the Section
The Group Differences between two or more variables or scales of measurement using
Descriptive Statistics utilises the ascertainment of Compare Means between them. It is useful in
summarising and analysing the differences across one or more factors which are usually
categorical variables (Cronk, 2017). In the context of given case scenario, the clinic is interested
in finding the group difference between two scales viz. Visual Analog Scale (VAS) Measures
and Health Value Scale have been taken into account. For this purpose, VAS measure related to
whether or not participants reported that they had perceived an alcohol related illness ever was
considered. To analysing this data, Compared Means by ANOVA Table and Test of Linearity
have been performed whose key inferential statistical information is appended whereas the
necessary descriptive statistics have been conducted.
Descriptive of VAS and HVS
3
Report
Health Value Scale
Perceived alcohol related
illness ever
Mean N Std. Deviation Variance
No 19.75 55 5.005 25.045
Yes 19.28 61 4.416 19.504
Total 19.50 116 4.689 21.991
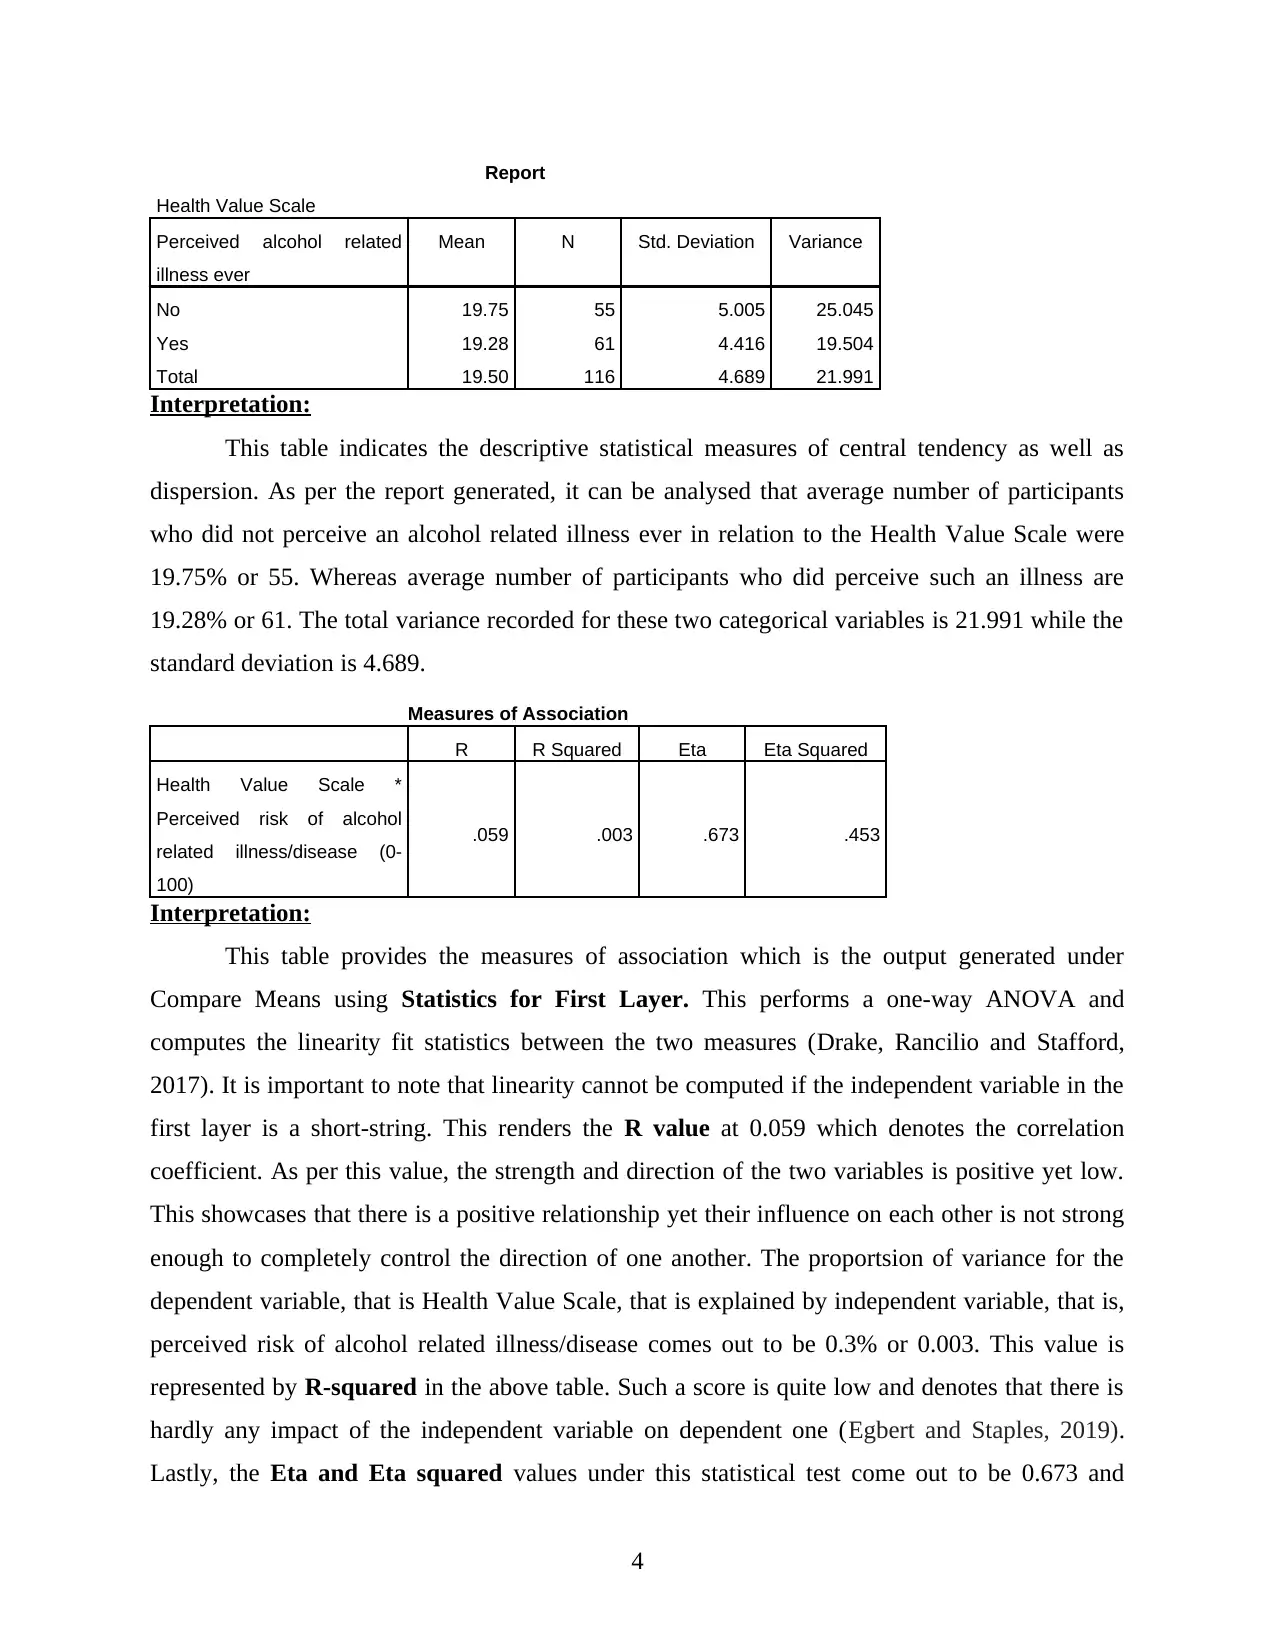
Interpretation:
This table indicates the descriptive statistical measures of central tendency as well as
dispersion. As per the report generated, it can be analysed that average number of participants
who did not perceive an alcohol related illness ever in relation to the Health Value Scale were
19.75% or 55. Whereas average number of participants who did perceive such an illness are
19.28% or 61. The total variance recorded for these two categorical variables is 21.991 while the
standard deviation is 4.689.
Measures of Association
R R Squared Eta Eta Squared
Health Value Scale *
Perceived risk of alcohol
related illness/disease (0-
100)
.059 .003 .673 .453
Interpretation:
This table provides the measures of association which is the output generated under
Compare Means using Statistics for First Layer. This performs a one-way ANOVA and
computes the linearity fit statistics between the two measures (Drake, Rancilio and Stafford,
2017). It is important to note that linearity cannot be computed if the independent variable in the
first layer is a short-string. This renders the R value at 0.059 which denotes the correlation
coefficient. As per this value, the strength and direction of the two variables is positive yet low.
This showcases that there is a positive relationship yet their influence on each other is not strong
enough to completely control the direction of one another. The proportsion of variance for the
dependent variable, that is Health Value Scale, that is explained by independent variable, that is,
perceived risk of alcohol related illness/disease comes out to be 0.3% or 0.003. This value is
represented by R-squared in the above table. Such a score is quite low and denotes that there is
hardly any impact of the independent variable on dependent one (Egbert and Staples, 2019).
Lastly, the Eta and Eta squared values under this statistical test come out to be 0.673 and
4
Health Value Scale
Perceived alcohol related
illness ever
Mean N Std. Deviation Variance
No 19.75 55 5.005 25.045
Yes 19.28 61 4.416 19.504
Total 19.50 116 4.689 21.991
Interpretation:
This table indicates the descriptive statistical measures of central tendency as well as
dispersion. As per the report generated, it can be analysed that average number of participants
who did not perceive an alcohol related illness ever in relation to the Health Value Scale were
19.75% or 55. Whereas average number of participants who did perceive such an illness are
19.28% or 61. The total variance recorded for these two categorical variables is 21.991 while the
standard deviation is 4.689.
Measures of Association
R R Squared Eta Eta Squared
Health Value Scale *
Perceived risk of alcohol
related illness/disease (0-
100)
.059 .003 .673 .453
Interpretation:
This table provides the measures of association which is the output generated under
Compare Means using Statistics for First Layer. This performs a one-way ANOVA and
computes the linearity fit statistics between the two measures (Drake, Rancilio and Stafford,
2017). It is important to note that linearity cannot be computed if the independent variable in the
first layer is a short-string. This renders the R value at 0.059 which denotes the correlation
coefficient. As per this value, the strength and direction of the two variables is positive yet low.
This showcases that there is a positive relationship yet their influence on each other is not strong
enough to completely control the direction of one another. The proportsion of variance for the
dependent variable, that is Health Value Scale, that is explained by independent variable, that is,
perceived risk of alcohol related illness/disease comes out to be 0.3% or 0.003. This value is
represented by R-squared in the above table. Such a score is quite low and denotes that there is
hardly any impact of the independent variable on dependent one (Egbert and Staples, 2019).
Lastly, the Eta and Eta squared values under this statistical test come out to be 0.673 and
4
⊘ This is a preview!⊘
Do you want full access?
Subscribe today to unlock all pages.
Trusted by 1+ million students worldwide
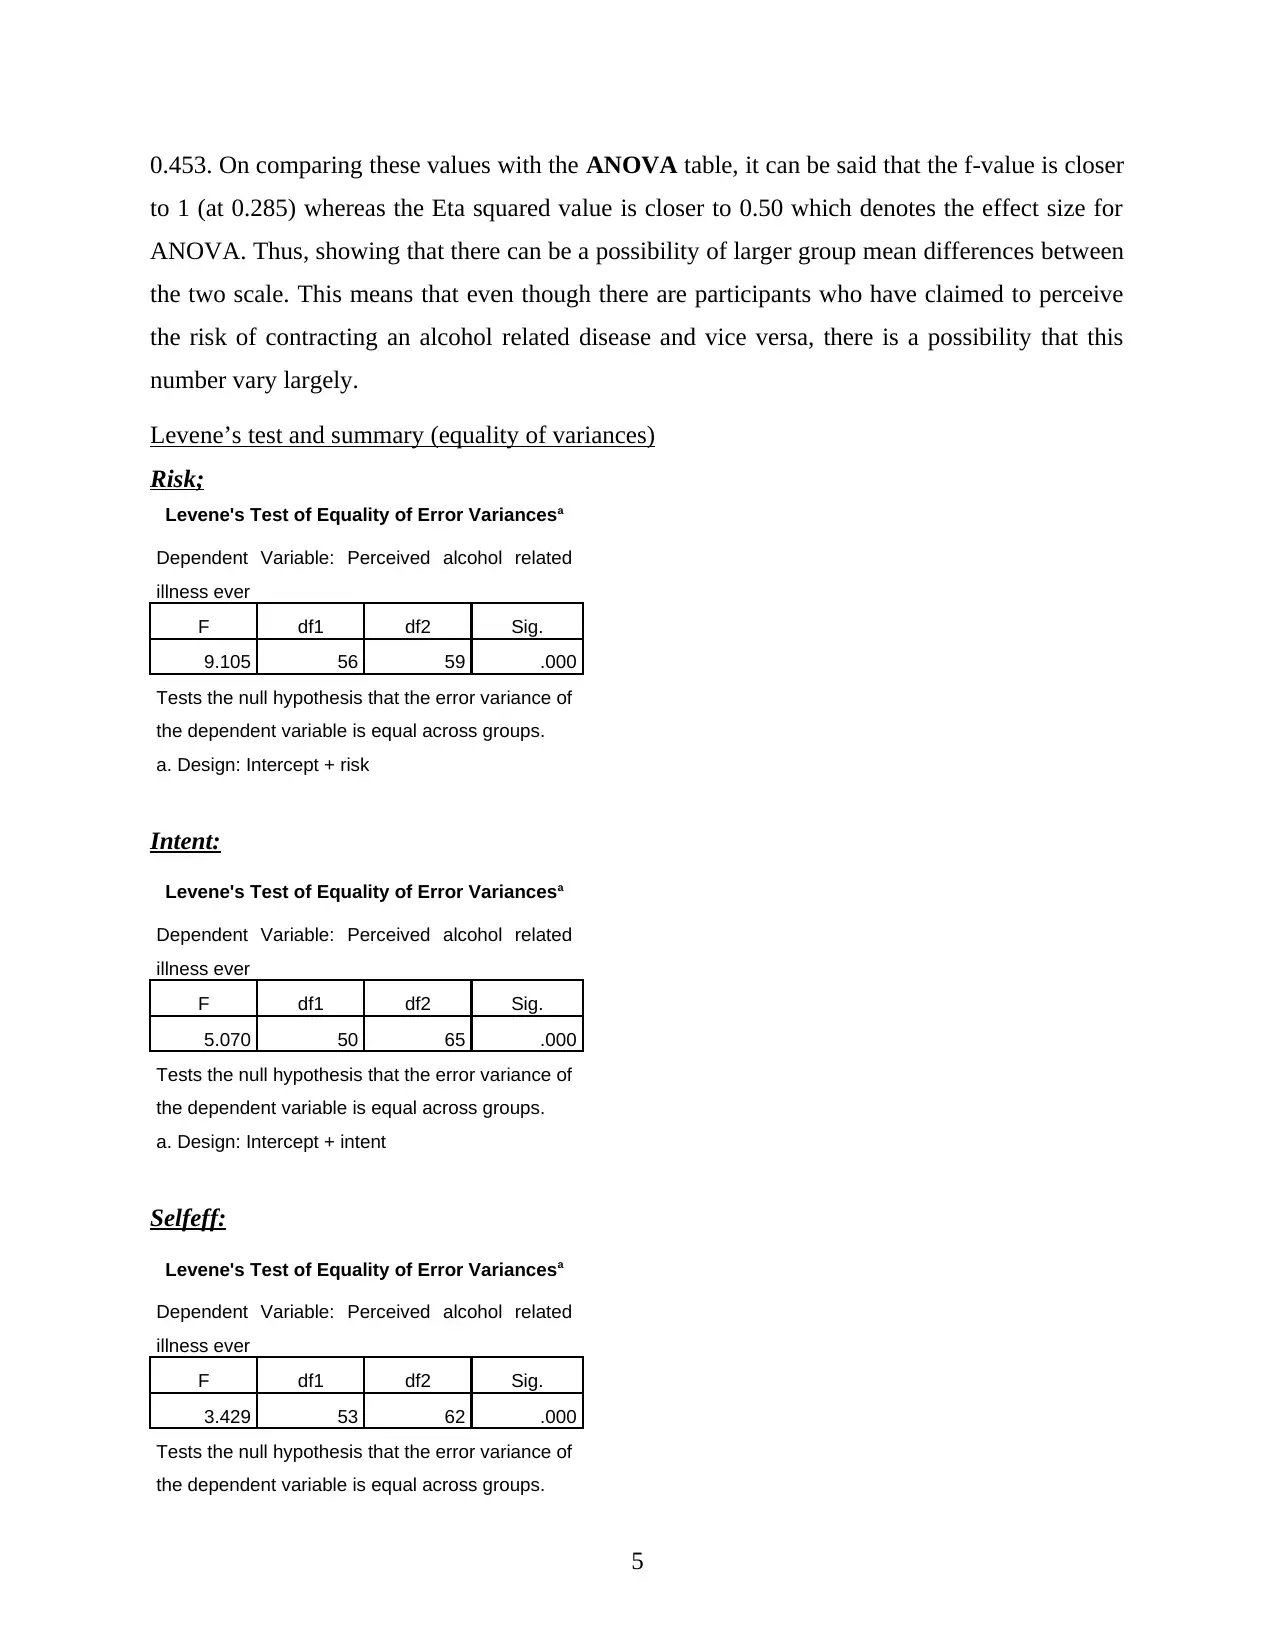
0.453. On comparing these values with the ANOVA table, it can be said that the f-value is closer
to 1 (at 0.285) whereas the Eta squared value is closer to 0.50 which denotes the effect size for
ANOVA. Thus, showing that there can be a possibility of larger group mean differences between
the two scale. This means that even though there are participants who have claimed to perceive
the risk of contracting an alcohol related disease and vice versa, there is a possibility that this
number vary largely.
Levene’s test and summary (equality of variances)
Risk;
Levene's Test of Equality of Error Variancesa
Dependent Variable: Perceived alcohol related
illness ever
F df1 df2 Sig.
9.105 56 59 .000
Tests the null hypothesis that the error variance of
the dependent variable is equal across groups.
a. Design: Intercept + risk
Intent:
Levene's Test of Equality of Error Variancesa
Dependent Variable: Perceived alcohol related
illness ever
F df1 df2 Sig.
5.070 50 65 .000
Tests the null hypothesis that the error variance of
the dependent variable is equal across groups.
a. Design: Intercept + intent
Selfeff:
Levene's Test of Equality of Error Variancesa
Dependent Variable: Perceived alcohol related
illness ever
F df1 df2 Sig.
3.429 53 62 .000
Tests the null hypothesis that the error variance of
the dependent variable is equal across groups.
5
Paraphrase This Document
Need a fresh take? Get an instant paraphrase of this document with our AI Paraphraser
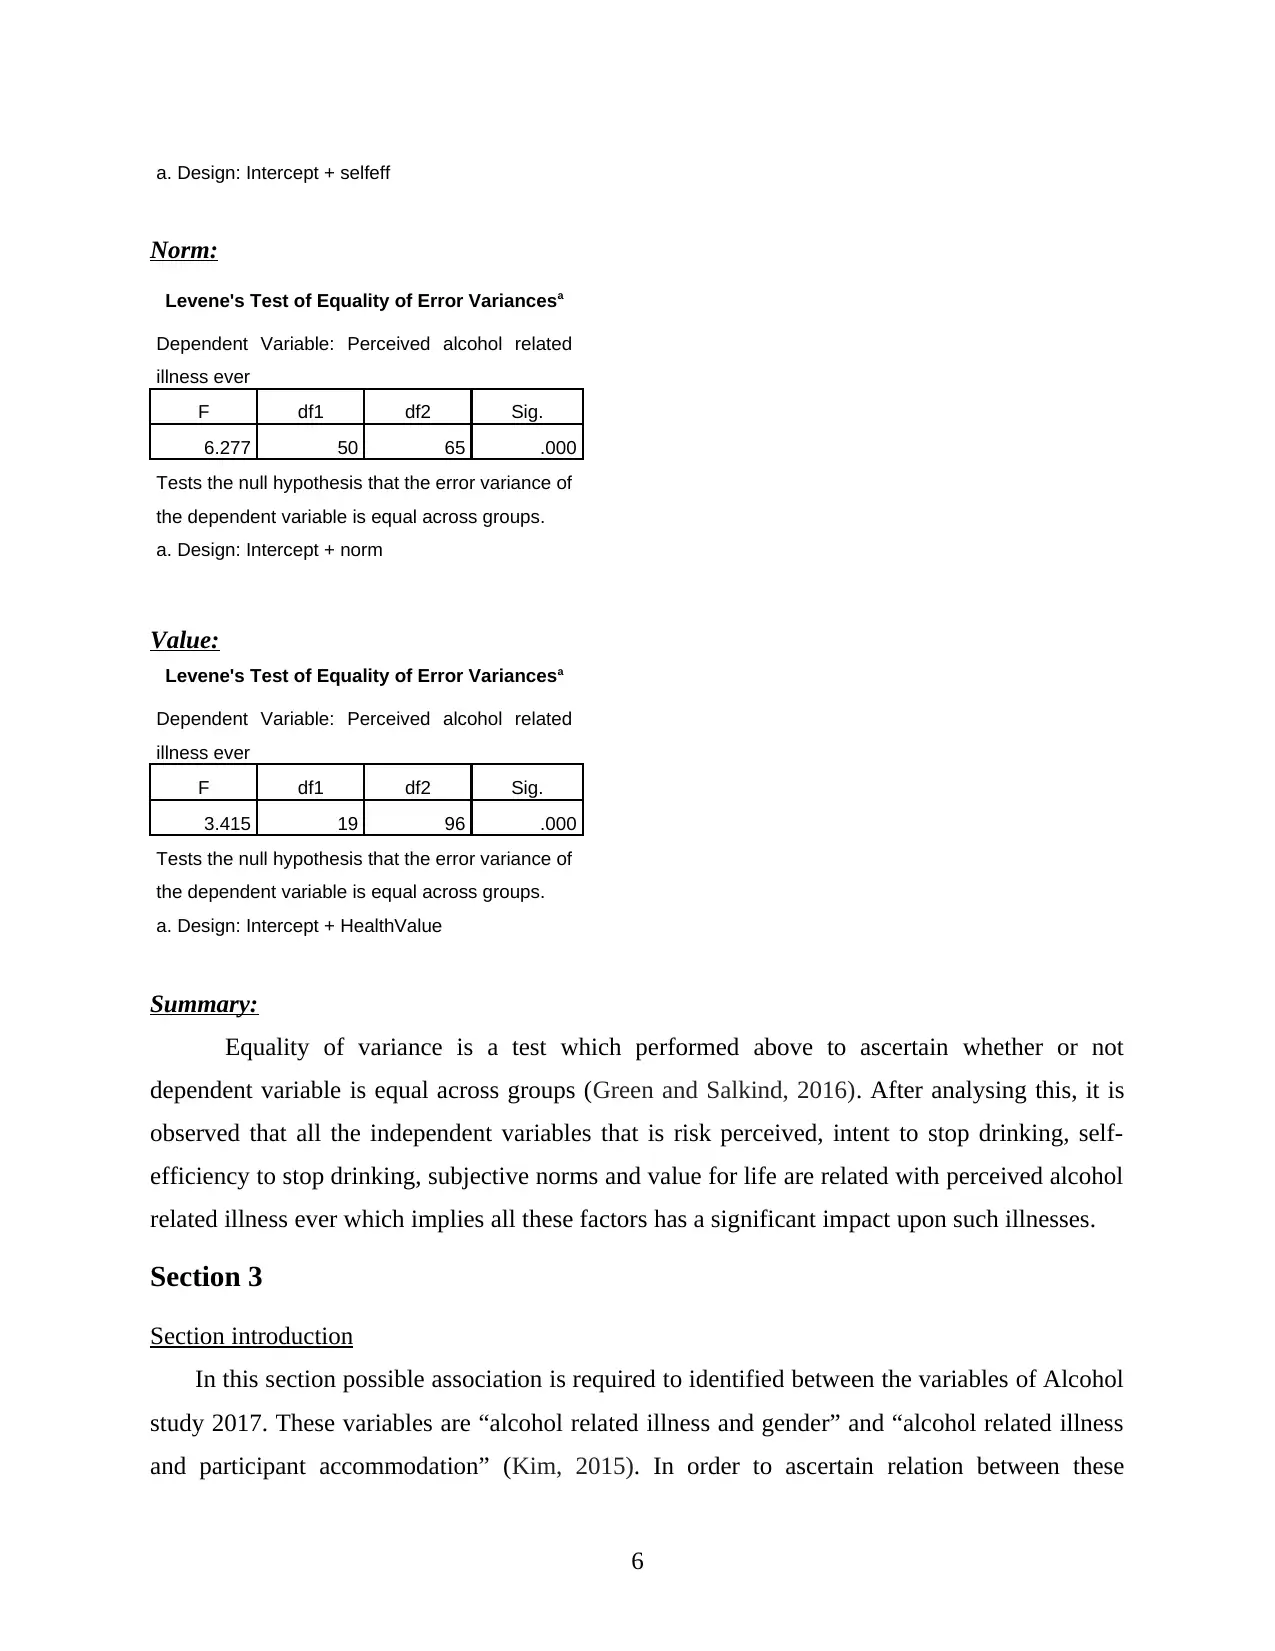
a. Design: Intercept + selfeff
Norm:
Levene's Test of Equality of Error Variancesa
Dependent Variable: Perceived alcohol related
illness ever
F df1 df2 Sig.
6.277 50 65 .000
Tests the null hypothesis that the error variance of
the dependent variable is equal across groups.
a. Design: Intercept + norm
Value:
Levene's Test of Equality of Error Variancesa
Dependent Variable: Perceived alcohol related
illness ever
F df1 df2 Sig.
3.415 19 96 .000
Tests the null hypothesis that the error variance of
the dependent variable is equal across groups.
a. Design: Intercept + HealthValue
Summary:
Equality of variance is a test which performed above to ascertain whether or not
dependent variable is equal across groups (Green and Salkind, 2016). After analysing this, it is
observed that all the independent variables that is risk perceived, intent to stop drinking, self-
efficiency to stop drinking, subjective norms and value for life are related with perceived alcohol
related illness ever which implies all these factors has a significant impact upon such illnesses.
Section 3
Section introduction
In this section possible association is required to identified between the variables of Alcohol
study 2017. These variables are “alcohol related illness and gender” and “alcohol related illness
and participant accommodation” (Kim, 2015). In order to ascertain relation between these
6
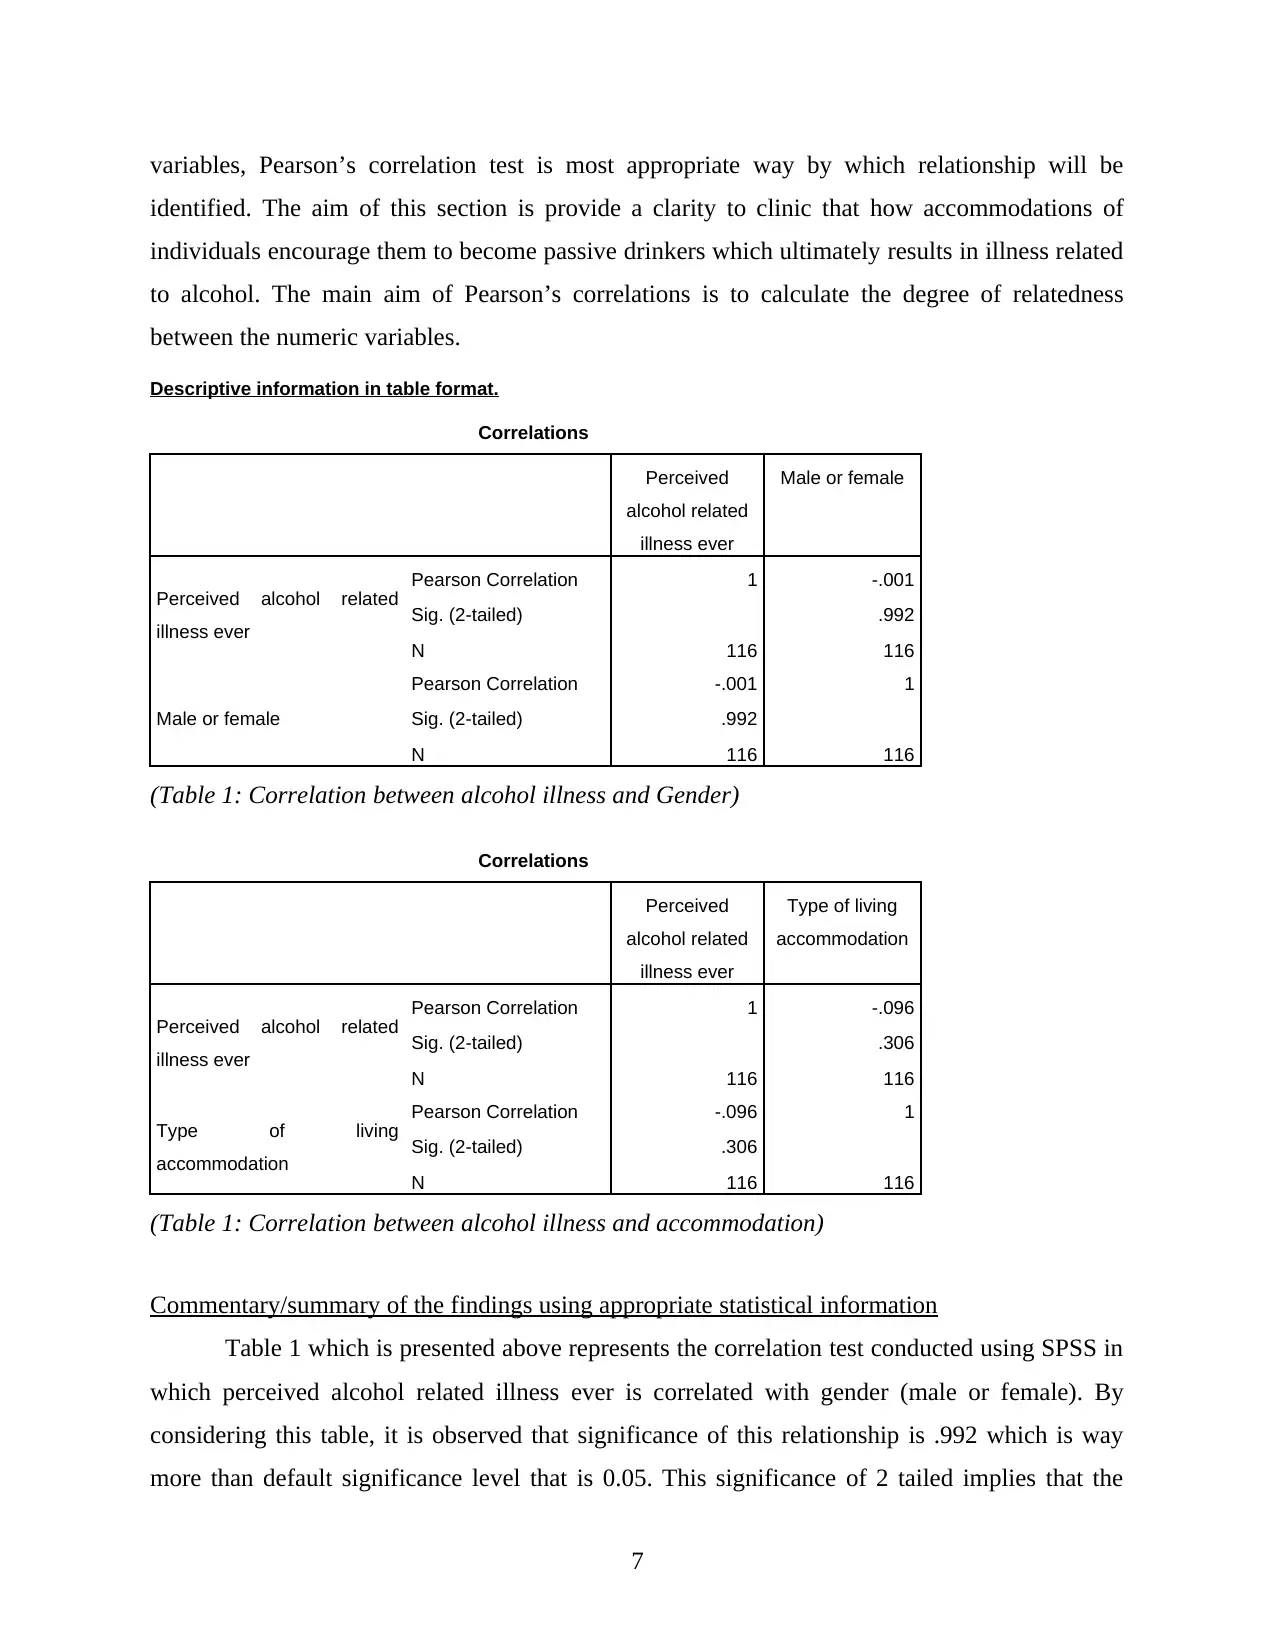
variables, Pearson’s correlation test is most appropriate way by which relationship will be
identified. The aim of this section is provide a clarity to clinic that how accommodations of
individuals encourage them to become passive drinkers which ultimately results in illness related
to alcohol. The main aim of Pearson’s correlations is to calculate the degree of relatedness
between the numeric variables.
Descriptive information in table format.
Correlations
Perceived
alcohol related
illness ever
Male or female
Perceived alcohol related
illness ever
Pearson Correlation 1 -.001
Sig. (2-tailed) .992
N 116 116
Male or female
Pearson Correlation -.001 1
Sig. (2-tailed) .992
N 116 116
(Table 1: Correlation between alcohol illness and Gender)
Correlations
Perceived
alcohol related
illness ever
Type of living
accommodation
Perceived alcohol related
illness ever
Pearson Correlation 1 -.096
Sig. (2-tailed) .306
N 116 116
Type of living
accommodation
Pearson Correlation -.096 1
Sig. (2-tailed) .306
N 116 116
(Table 1: Correlation between alcohol illness and accommodation)
Commentary/summary of the findings using appropriate statistical information
Table 1 which is presented above represents the correlation test conducted using SPSS in
which perceived alcohol related illness ever is correlated with gender (male or female). By
considering this table, it is observed that significance of this relationship is .992 which is way
more than default significance level that is 0.05. This significance of 2 tailed implies that the
7
⊘ This is a preview!⊘
Do you want full access?
Subscribe today to unlock all pages.
Trusted by 1+ million students worldwide
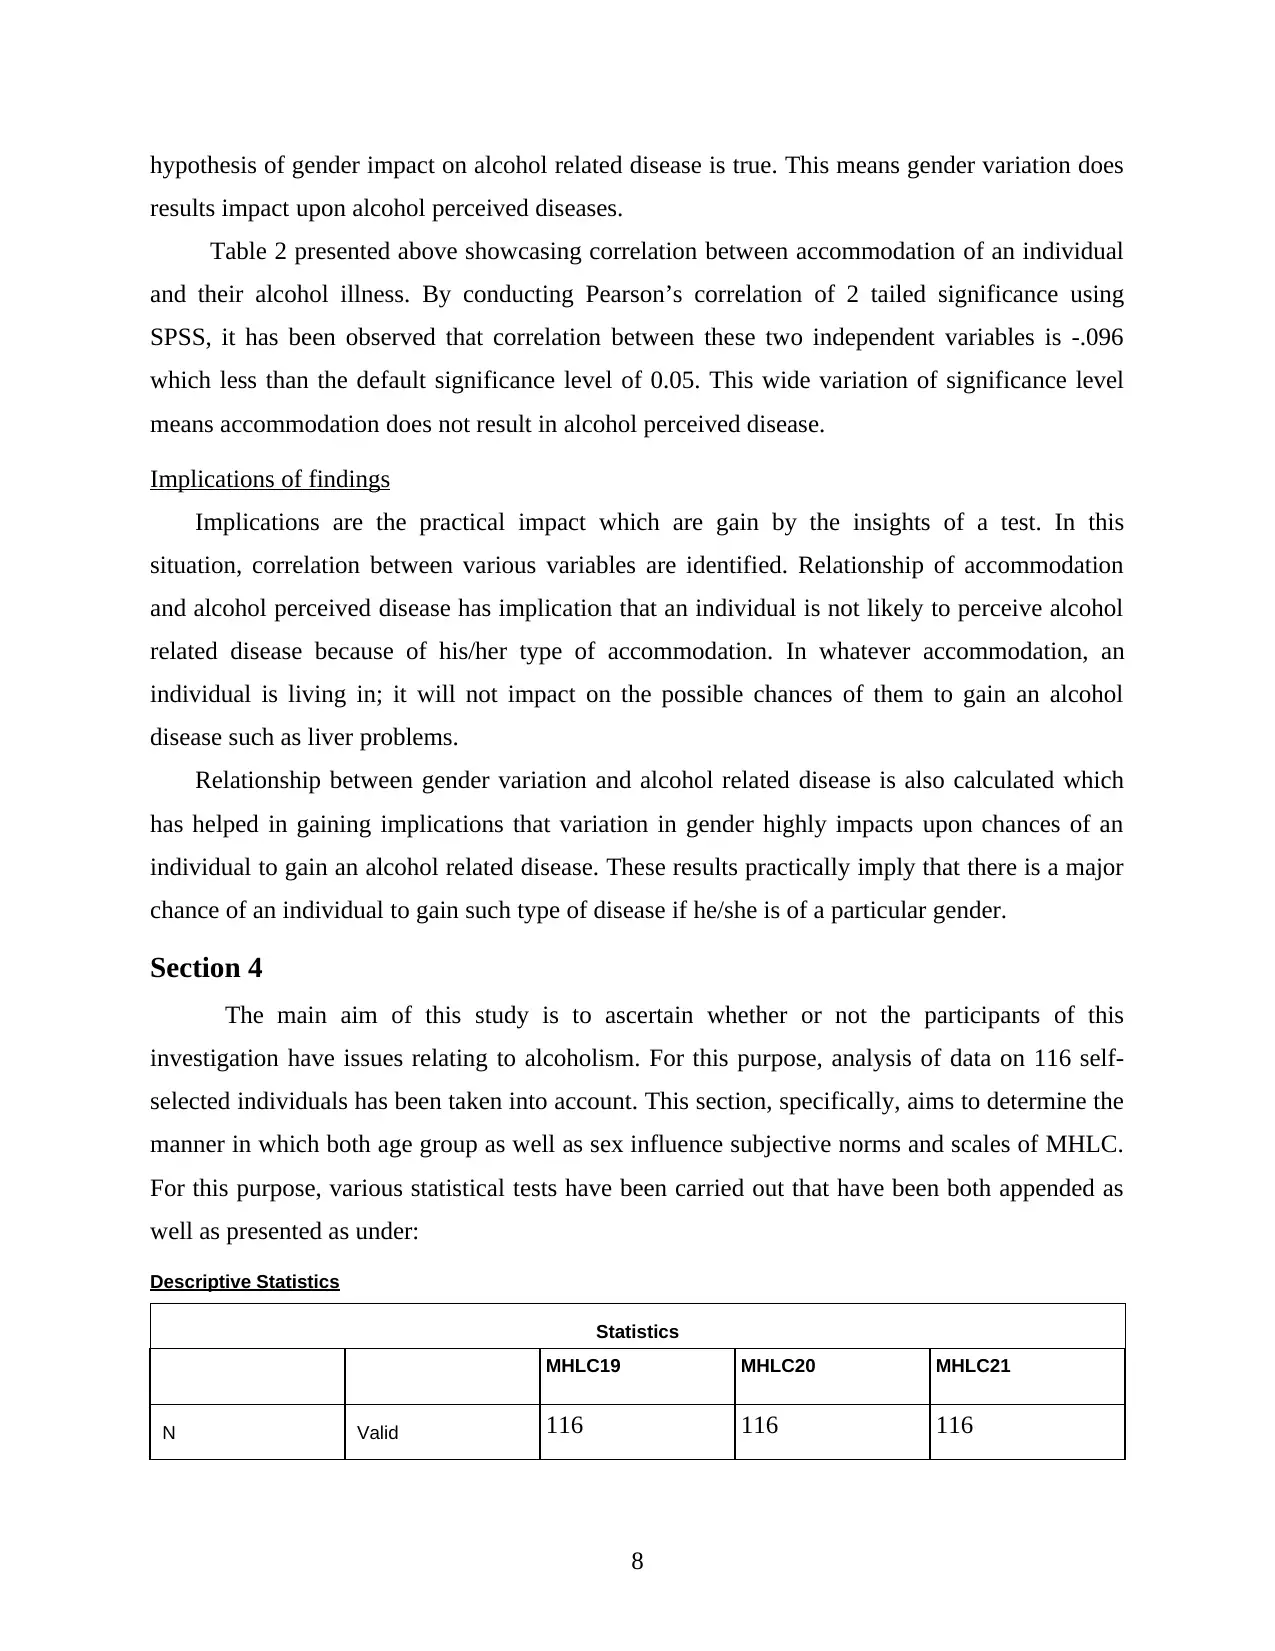
hypothesis of gender impact on alcohol related disease is true. This means gender variation does
results impact upon alcohol perceived diseases.
Table 2 presented above showcasing correlation between accommodation of an individual
and their alcohol illness. By conducting Pearson’s correlation of 2 tailed significance using
SPSS, it has been observed that correlation between these two independent variables is -.096
which less than the default significance level of 0.05. This wide variation of significance level
means accommodation does not result in alcohol perceived disease.
Implications of findings
Implications are the practical impact which are gain by the insights of a test. In this
situation, correlation between various variables are identified. Relationship of accommodation
and alcohol perceived disease has implication that an individual is not likely to perceive alcohol
related disease because of his/her type of accommodation. In whatever accommodation, an
individual is living in; it will not impact on the possible chances of them to gain an alcohol
disease such as liver problems.
Relationship between gender variation and alcohol related disease is also calculated which
has helped in gaining implications that variation in gender highly impacts upon chances of an
individual to gain an alcohol related disease. These results practically imply that there is a major
chance of an individual to gain such type of disease if he/she is of a particular gender.
Section 4
The main aim of this study is to ascertain whether or not the participants of this
investigation have issues relating to alcoholism. For this purpose, analysis of data on 116 self-
selected individuals has been taken into account. This section, specifically, aims to determine the
manner in which both age group as well as sex influence subjective norms and scales of MHLC.
For this purpose, various statistical tests have been carried out that have been both appended as
well as presented as under:
Descriptive Statistics
Statistics
MHLC19 MHLC20 MHLC21
N Valid 116 116 116
8
Paraphrase This Document
Need a fresh take? Get an instant paraphrase of this document with our AI Paraphraser
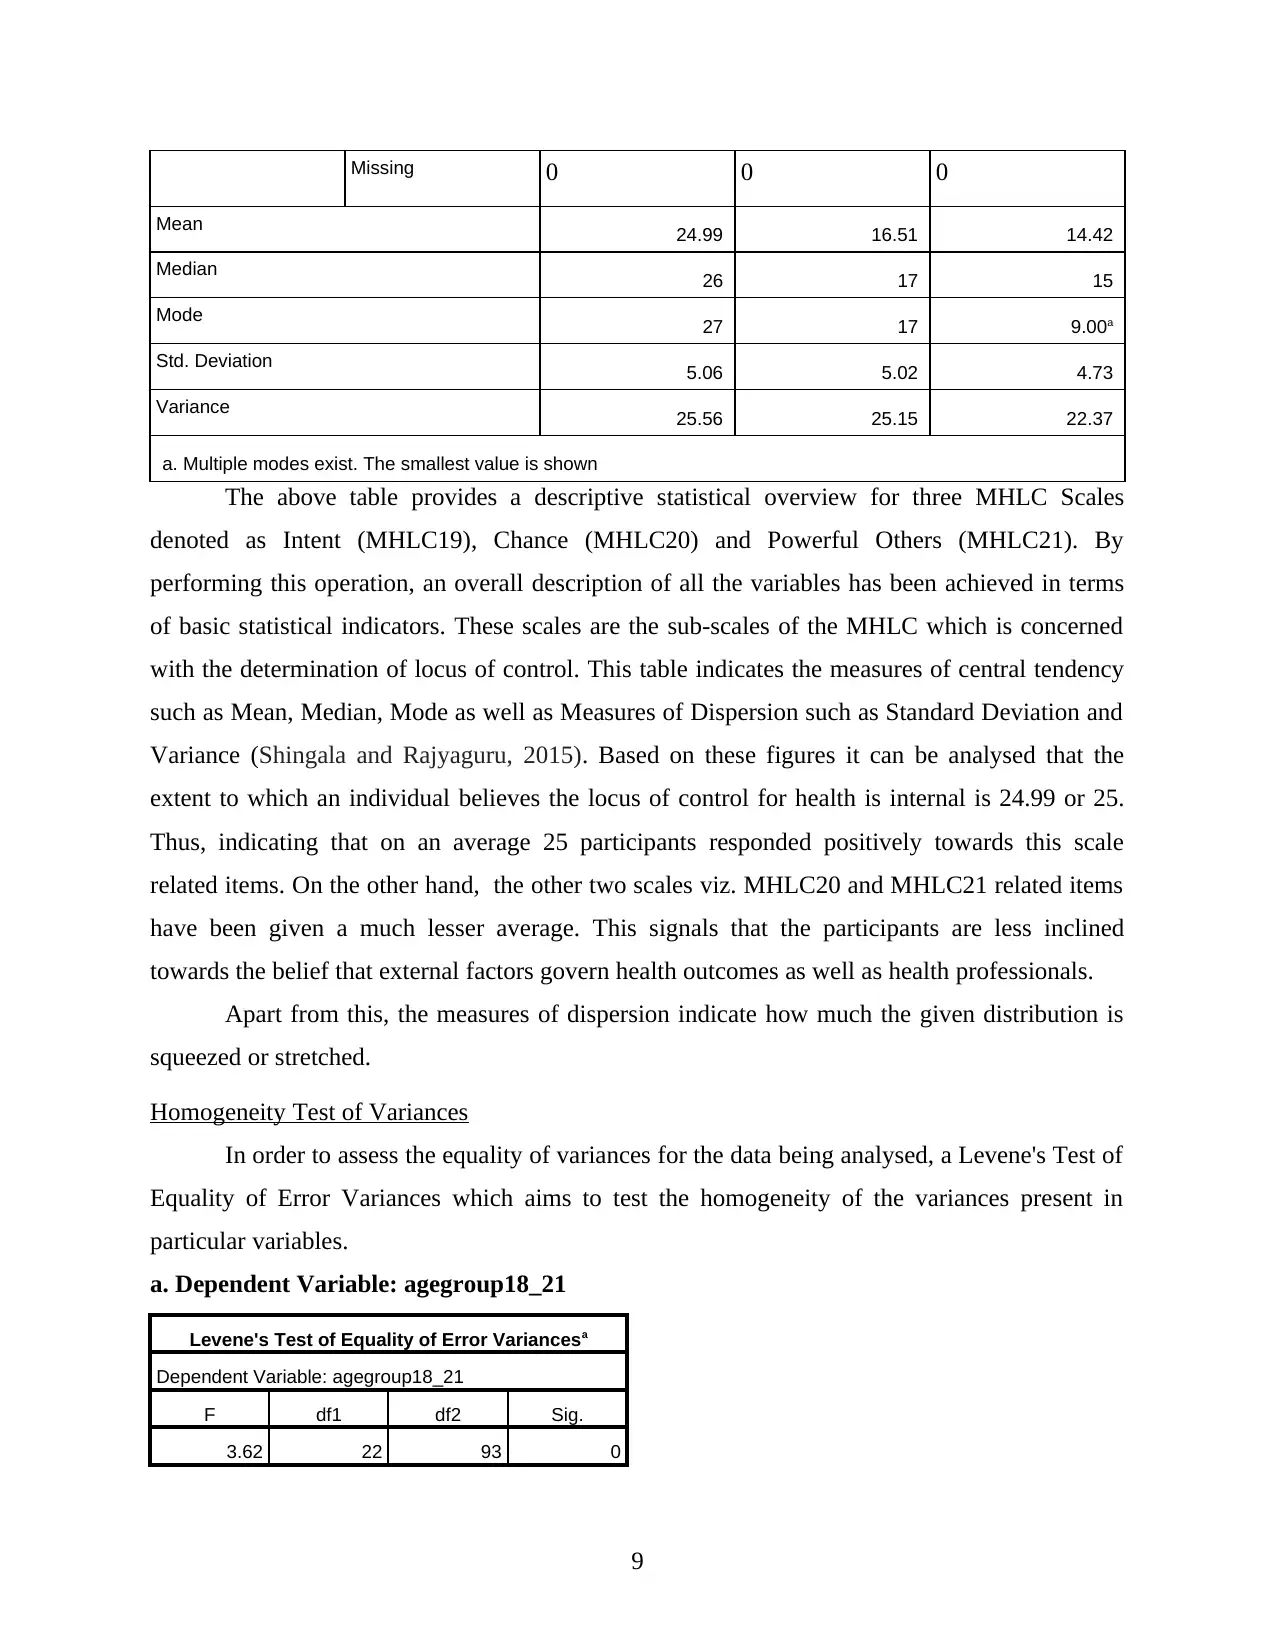
Missing 0 0 0
Mean 24.99 16.51 14.42
Median 26 17 15
Mode 27 17 9.00a
Std. Deviation 5.06 5.02 4.73
Variance 25.56 25.15 22.37
a. Multiple modes exist. The smallest value is shown
The above table provides a descriptive statistical overview for three MHLC Scales
denoted as Intent (MHLC19), Chance (MHLC20) and Powerful Others (MHLC21). By
performing this operation, an overall description of all the variables has been achieved in terms
of basic statistical indicators. These scales are the sub-scales of the MHLC which is concerned
with the determination of locus of control. This table indicates the measures of central tendency
such as Mean, Median, Mode as well as Measures of Dispersion such as Standard Deviation and
Variance (Shingala and Rajyaguru, 2015). Based on these figures it can be analysed that the
extent to which an individual believes the locus of control for health is internal is 24.99 or 25.
Thus, indicating that on an average 25 participants responded positively towards this scale
related items. On the other hand, the other two scales viz. MHLC20 and MHLC21 related items
have been given a much lesser average. This signals that the participants are less inclined
towards the belief that external factors govern health outcomes as well as health professionals.
Apart from this, the measures of dispersion indicate how much the given distribution is
squeezed or stretched.
Homogeneity Test of Variances
In order to assess the equality of variances for the data being analysed, a Levene's Test of
Equality of Error Variances which aims to test the homogeneity of the variances present in
particular variables.
a. Dependent Variable: agegroup18_21
Levene's Test of Equality of Error Variancesa
Dependent Variable: agegroup18_21
F df1 df2 Sig.
3.62 22 93 0
9
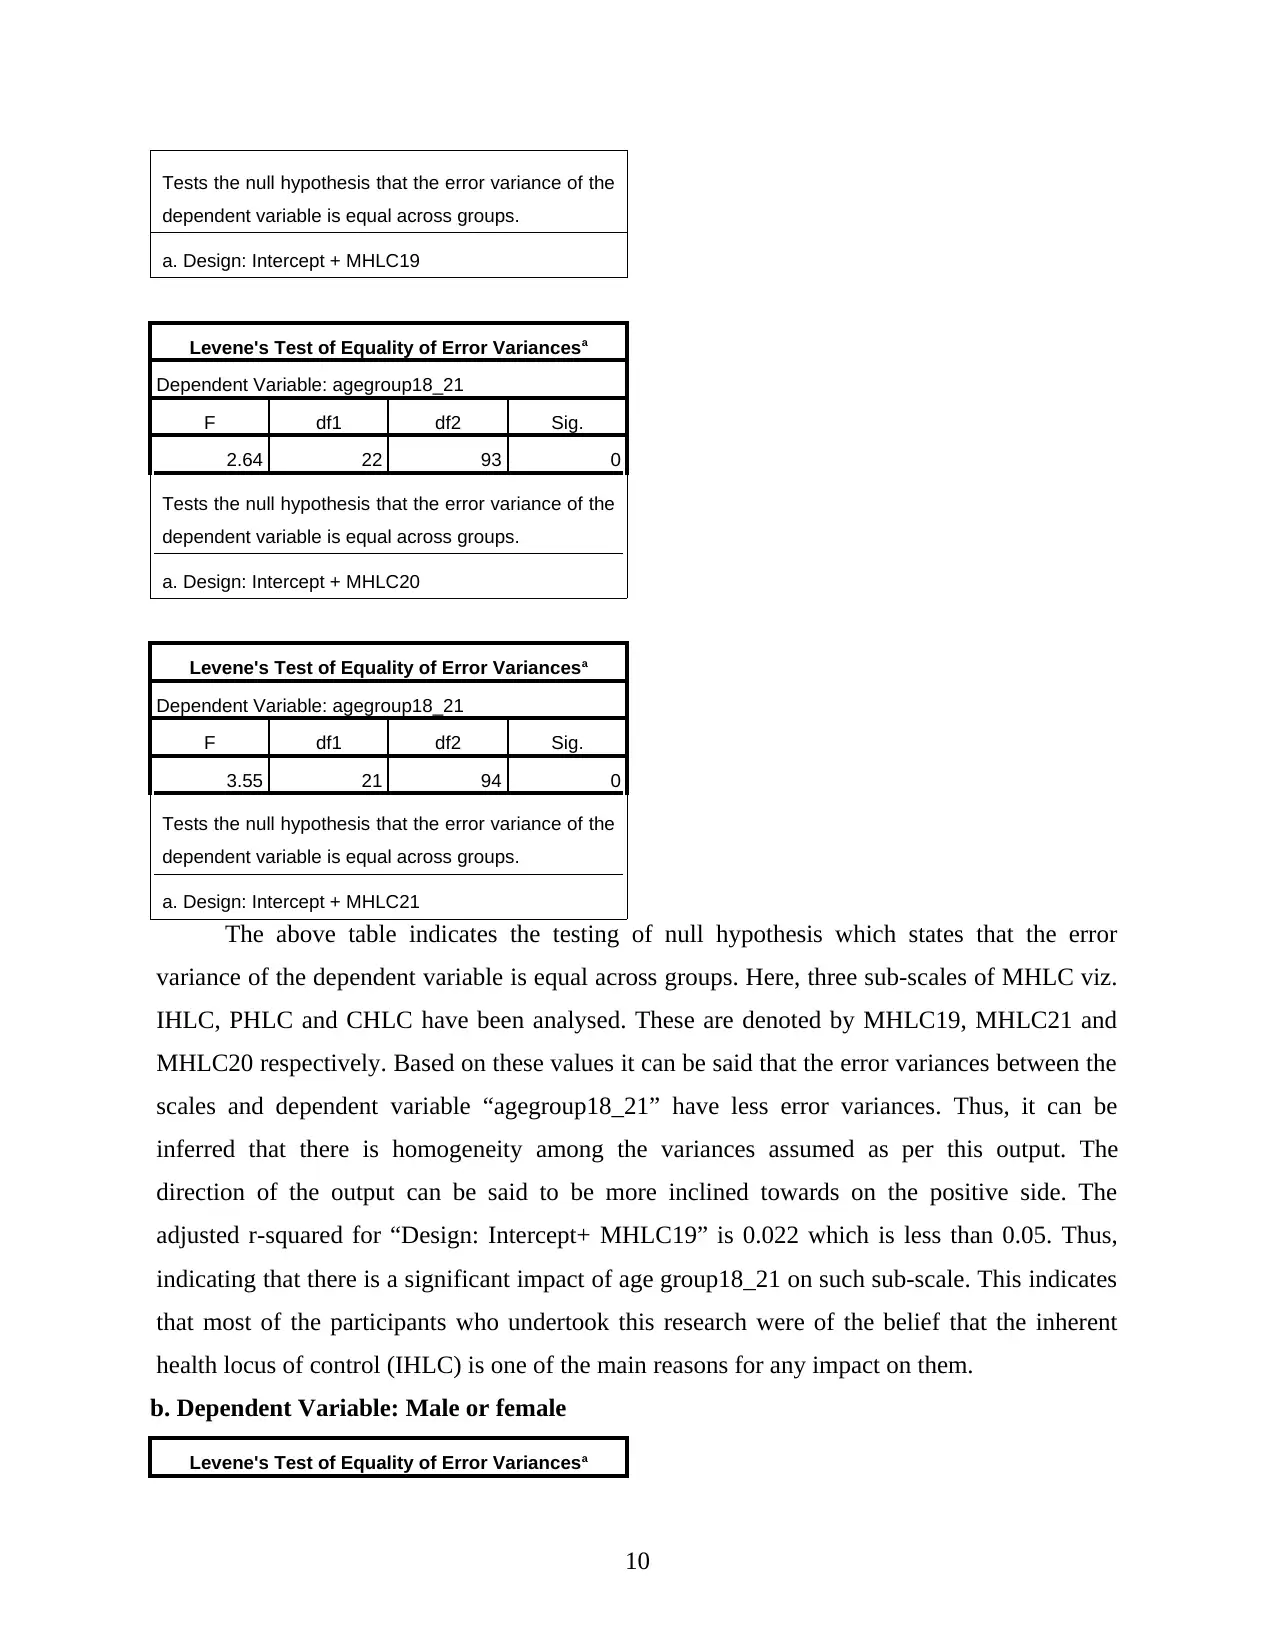
Tests the null hypothesis that the error variance of the
dependent variable is equal across groups.
a. Design: Intercept + MHLC19
Levene's Test of Equality of Error Variancesa
Dependent Variable: agegroup18_21
F df1 df2 Sig.
2.64 22 93 0
Tests the null hypothesis that the error variance of the
dependent variable is equal across groups.
a. Design: Intercept + MHLC20
Levene's Test of Equality of Error Variancesa
Dependent Variable: agegroup18_21
F df1 df2 Sig.
3.55 21 94 0
Tests the null hypothesis that the error variance of the
dependent variable is equal across groups.
a. Design: Intercept + MHLC21
The above table indicates the testing of null hypothesis which states that the error
variance of the dependent variable is equal across groups. Here, three sub-scales of MHLC viz.
IHLC, PHLC and CHLC have been analysed. These are denoted by MHLC19, MHLC21 and
MHLC20 respectively. Based on these values it can be said that the error variances between the
scales and dependent variable “agegroup18_21” have less error variances. Thus, it can be
inferred that there is homogeneity among the variances assumed as per this output. The
direction of the output can be said to be more inclined towards on the positive side. The
adjusted r-squared for “Design: Intercept+ MHLC19” is 0.022 which is less than 0.05. Thus,
indicating that there is a significant impact of age group18_21 on such sub-scale. This indicates
that most of the participants who undertook this research were of the belief that the inherent
health locus of control (IHLC) is one of the main reasons for any impact on them.
b. Dependent Variable: Male or female
Levene's Test of Equality of Error Variancesa
10
dependent variable is equal across groups.
a. Design: Intercept + MHLC19
Levene's Test of Equality of Error Variancesa
Dependent Variable: agegroup18_21
F df1 df2 Sig.
2.64 22 93 0
Tests the null hypothesis that the error variance of the
dependent variable is equal across groups.
a. Design: Intercept + MHLC20
Levene's Test of Equality of Error Variancesa
Dependent Variable: agegroup18_21
F df1 df2 Sig.
3.55 21 94 0
Tests the null hypothesis that the error variance of the
dependent variable is equal across groups.
a. Design: Intercept + MHLC21
The above table indicates the testing of null hypothesis which states that the error
variance of the dependent variable is equal across groups. Here, three sub-scales of MHLC viz.
IHLC, PHLC and CHLC have been analysed. These are denoted by MHLC19, MHLC21 and
MHLC20 respectively. Based on these values it can be said that the error variances between the
scales and dependent variable “agegroup18_21” have less error variances. Thus, it can be
inferred that there is homogeneity among the variances assumed as per this output. The
direction of the output can be said to be more inclined towards on the positive side. The
adjusted r-squared for “Design: Intercept+ MHLC19” is 0.022 which is less than 0.05. Thus,
indicating that there is a significant impact of age group18_21 on such sub-scale. This indicates
that most of the participants who undertook this research were of the belief that the inherent
health locus of control (IHLC) is one of the main reasons for any impact on them.
b. Dependent Variable: Male or female
Levene's Test of Equality of Error Variancesa
10
⊘ This is a preview!⊘
Do you want full access?
Subscribe today to unlock all pages.
Trusted by 1+ million students worldwide
1 out of 23
Related Documents


Your All-in-One AI-Powered Toolkit for Academic Success.
+13062052269
info@desklib.com
Available 24*7 on WhatsApp / Email
![[object Object]](/_next/static/media/star-bottom.7253800d.svg)
Unlock your academic potential
Copyright © 2020–2026 A2Z Services. All Rights Reserved. Developed and managed by ZUCOL.