Advanced Aviation Economics: Airline Industry Analysis of Recession

Verified

Added on  2023/01/16

|6
|709
|65
Report
AI Summary
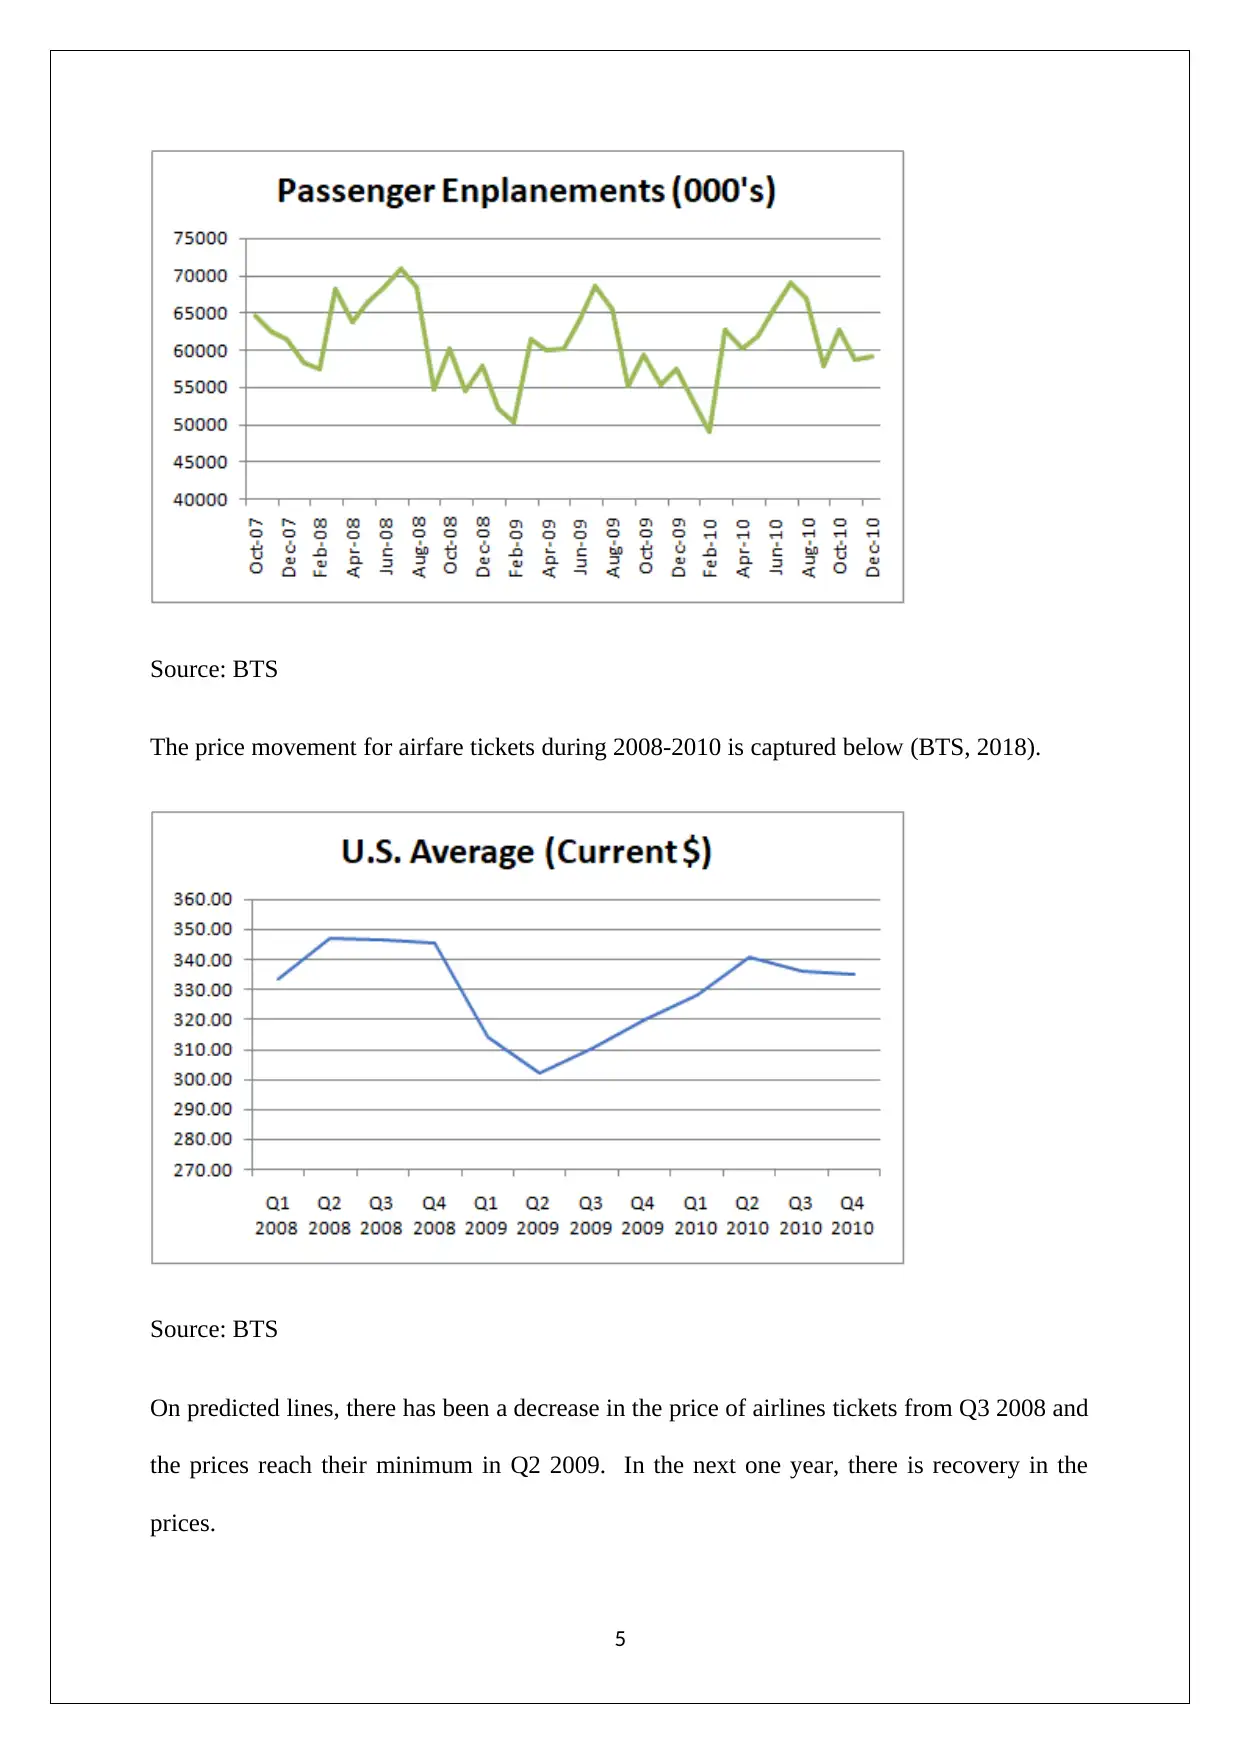
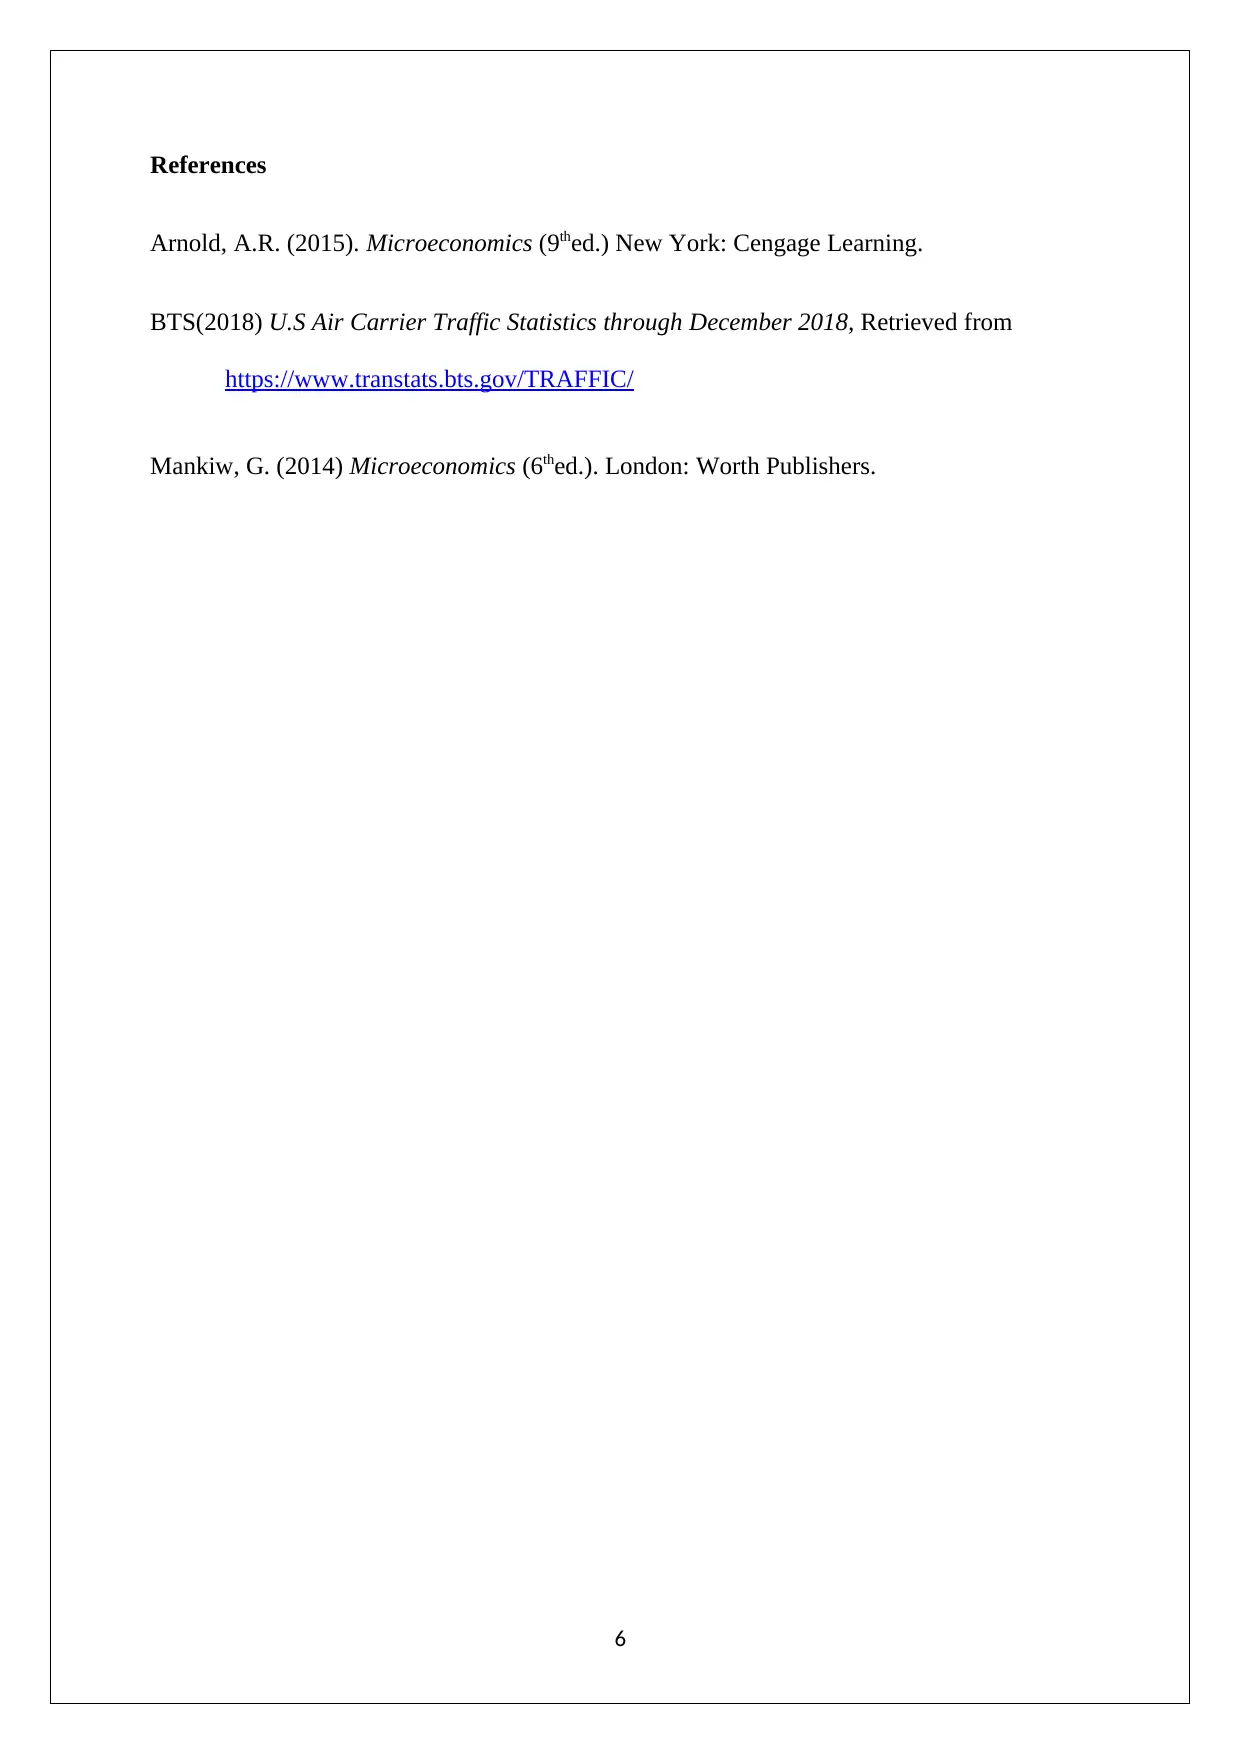
This report analyzes the impact of the 2008 global financial crisis on the aviation industry using the principles of supply and demand. It predicts a decrease in air travel demand due to reduced disposable income and business travel, along with a potential decrease in supply as airlines rationalize flights. The report uses data from the US Bureau of Transportation Statistics (BTS) from October 2007 to December 2010 to validate these predictions, examining trends in Available Seat Miles (ASM), Revenue Passenger Miles (RPM), enplanements, and airfare prices. The analysis confirms a decline in both demand and supply, leading to lower prices, and provides a detailed examination of how the industry responded to the economic downturn.
Document Page
ADVANCED AVIATION ECONOMICS
STUDENT ID:
[Pick the date]
tabler-icon-diamond-filled.svg

Secure Best Marks with AI Grader

Need help grading? Try our AI Grader for instant feedback on your assignments.
Document Page
It would be expected that on account of the global financial crisis which started in 2008,
there would be a shift in the demand curve. This would occur primarily because there
would a lower demand for air travel. One of the reasons contributing to low demand
would be that casual travellers going for holidays abroad would decrease owing to lower
disposable income and a greater tendency to save considering the pessimistic economic
outlook. Further, owing to slowdown in the businesses, it would be expected that business
related travel would also slow down (Arnold, 2015). Also, it would be predictable that
both households and businesses would want to reduce the costs by deferring or minimising
their travels. Further, it is also likely that for domestic routes people may consider
substitutes such as driving or using other modes of transport. With regards to supply
curve, it may be expected that the supply may reduce owing to some distressed airline
being closed or the airlines rationalising flights to improve occupancy. This would be
required so as to ensure that the operations remain profitable (Mankiw,2016),
The predicted impact on the quantity demanded and price can be estimated from the graph
shown below.
Owing to decrease in demand, there would a shift in the demand curve from D to D1. There
would also be some decrease in supply but it would be lower than the corresponding decrease
2
Document Page
in demand. This is represented by the shift in the supply curve from S to S1. The net impact of
these changes is that the predicted price P1 would be lower than the original equilibrium price
P. Also, there would be a decrease in the equilibrium quantity as indicated in the above
graph. Thus, it would be expected that flights would get cheaper and the airline tickets sold
would be lower than pre-crisis period (Arnold, 2015).
An indicator of supply is ASM (Available Seat Miles). The trend for these parameter from
October 2007 to December 2010 is indicated below (BTS, 2018).
Source: BTS
From the above graph, it is apparent that there was some decrease in the supply but it was
less than 10 percent. Also, the decrease in supply in more prominent from mid 2008 and then
further accentuates in 2009. However, there is some improvement in supply from 2010
onwards as the peak supply of 2010 is greater than 2009.
3
Document Page
The demand for air travel can be captured using two parameters namely RPM (Revenue
Passenger Miles) and Enplanements. The respective graphs in this regards indicating the
movement from October 2007 to December 2010 are shown below (BTS, 2018).
Source: BTS
The decrease in demand is apparent from the above graph. Comparing the respective figures
in January 2008 and January 2009, it is apparent that demand has slowed in excess of 10
percent. Further, from mid 2010 there is some improvement in demand as there is about 5
percent improvement in RPM for July 2010 when compared to corresponding RPM for July
2009. A similar trend is visible for enplanements which is shown below (BTS, 2018).
4
tabler-icon-diamond-filled.svg

Secure Best Marks with AI Grader

Need help grading? Try our AI Grader for instant feedback on your assignments.
Document Page
Source: BTS
The price movement for airfare tickets during 2008-2010 is captured below (BTS, 2018).
Source: BTS
On predicted lines, there has been a decrease in the price of airlines tickets from Q3 2008 and
the prices reach their minimum in Q2 2009. In the next one year, there is recovery in the
prices.
5
Document Page
References
Arnold, A.R. (2015). Microeconomics (9thed.) New York: Cengage Learning.
BTS(2018) U.S Air Carrier Traffic Statistics through December 2018, Retrieved from
https://www.transtats.bts.gov/TRAFFIC/
Mankiw, G. (2014) Microeconomics (6thed.). London: Worth Publishers.
6
chevron_up_icon
1 out of 6
circle_padding
hide_on_mobile
zoom_out_icon
[object Object]