University Report: Advanced Corporate Reporting and Share Performance
VerifiedAdded on 2021/04/24
|18
|3675
|180
Report
AI Summary
This report analyzes the impact of earnings announcements on share price performance. It begins with an introduction to the relevance of earnings announcements and provides empirical evidence from various research papers. The methodology involves collecting data from Yahoo Finance and analyzing abnormal returns, Steyx Squared, and T-tests. The analysis includes examining the average abnormal returns for companies with both good and bad earnings announcements. The report presents detailed calculations of test statistics, including Steyx and Steyx Squared, to determine the significance of earnings announcements on share price movement. The findings highlight the positive correlation between good earnings announcements and increased share value and the negative impact of bad earnings announcements. The report concludes by summarizing the impact of earnings announcements on the stock market, offering valuable insights for investors and financial analysts.
Running head: ADVANCED CORPORATE REPORTING
Advanced Corporate Reporting
Name of the Student:
Name of the University:
Authors Note:
Advanced Corporate Reporting
Name of the Student:
Name of the University:
Authors Note:
Paraphrase This Document
Need a fresh take? Get an instant paraphrase of this document with our AI Paraphraser
ADVANCED CORPORATE REPORTING
1
Table of Contents
4.0 Report/Essay:.......................................................................................................................2
Introduction:...............................................................................................................................2
Importance/relevance of earnings announcements:...................................................................2
Empirical evidence on the wealth effects of earnings announcements:.....................................3
Methodology:.............................................................................................................................5
Analysis of the result:.................................................................................................................5
Conclusion:..............................................................................................................................11
Reference and Bibliography:....................................................................................................12
Appendices:..............................................................................................................................15
ADVANCED CORPORATE REPORTING
2
4.0 Report/Essay:
Introduction:
The overall assessment mainly focuses in deriving the impact of earnings report on
share price performance of the company. In addition, the assessment focuses on detecting the
abnormal returns, which is achieved by the company. Moreover, the importance or relevance
of earnings announcement is effectively depicted in the report, which could allow investor to
understanding the impact of announcements on share price. The valuation of abnormal
returns, Steyx Squared and T-Test is being conducted to identify the calculation and position
of the company to generate high return. Moreover, the impact of good announcement and bad
announcement on shar price of the company is appropriately evaluated. Furthermore, the
calculation will allow investor to investigate the wealth effects of earnings announcement
made by firms. The use of slope, intercept, Steyx and Rsquared is used in detecting the
abnormal returns and expected return of the 10 shares.
Importance/relevance of earnings announcements:
Earnings announcement is detected to be the most viable information, which could
depict the financial position of the company. In addition, financial performance of the
company is identified with the help of announcement, which relatively depicts their actual
financial condition. The investors use of fundamental and technical analysis to derive the
valuation of their share price, which might help in detecting its actual share price (Marshall,
Schroeder and Yohn 2017). According to IFRS, the companies mainly need to provide all the
relevant details regarding the financial progress on all quarters. Moreover, with the whelp in
earning announcement the investors can confirm the management’s forecasting. The earnings
announcement is essential, as it portrays the path way, which has been adopted by the
⊘ This is a preview!⊘
Do you want full access?
Subscribe today to unlock all pages.
Trusted by 1+ million students worldwide
ADVANCED CORPORATE REPORTING
3
company to achieve sustainable growth. Lastly, companies by depicting the announcements
can portray their operational capability to the investor, which might help in mentioning their
operations.
Empirical evidence on the wealth effects of earnings announcements:
The empirical evidence on effectiveness of earnings announcements on wealth are
depicted as follows.
According to Ball and Shivakumar (2008), the relevant information presented in the
earnings report are effectively depicted. The journal states the impact and significance of
earning announcements, where all the new information is presented in the annual report. The
earnings announcement evaluation in the journal indicates the financial performance, which
could improve profits of the company. Therefore, the journal evaluates the performance of
earnings announcement in improving shar price of the company.
According to MacKinlay (1997), the impact of announcement is relatively evaluated,
which might help investors in generating high level of returns. Moreover, the author indicated
the positive attribute of announcement, which helps in improving its share valuation.
Furthermore, the author stated that announcement having positive market power could
increase shar price of the organisation. The empirical research indicates the power of positive
announcement, which could improve demand of shares among potential investors.
According to Afego (2013), the impact of annual report announcements on stock
market performance is evaluated. In addition, the journal sheds light on the impact of
earnings announcement and how share price of the company increases due to rising financial
position. The positive and adverse impact of financial announcement is effectively evaluated
by the paper, which indicates the influence of announcement earnings on share price of the
Paraphrase This Document
Need a fresh take? Get an instant paraphrase of this document with our AI Paraphraser
ADVANCED CORPORATE REPORTING
4
company. The journal evaluates the impact of share price from 20 days before and after the
announcement. This relevantly depicts the actual change in share price of the company due to
rise in its earnings.
Mlonzi, Kruger and Nthoesane (2011) indicates the duty of the company towards its
shareholders and investor, which could increase their share price valuation. In addition, the
researcher indicates the relation of financial performance and increment in share value, which
is been conducted after the announcement. In addition, the researcher indicates substantial
decline in share price, which is conducted after the announcement conducted by Nigerian
companies. The study indicates negative impact of announcement in share price of the
company, due to weak form of market efficiency. The journal mainly states the negative
attributes of the announcement measure, which is been used by companies in Nigeria.
Eleke-Aboagye and Opoku (2013) stated that earnings announcement indicates the
financial performance and share price movement of the company. Moreover, the research
evaluated 21 days share price movement during and after the announcement, which could
help in depicting effectiveness of the announcement. The results depicted in the research
indicates that the price movement of the stock was according to the news of the
announcement. Good news mainly increased share price of the company, while the decline in
value is seen when bad announcement is conducted.
Su (2003) mentioned in the journal about the changes in share price of the company
due to relevant announcements conducted in Chinese stock market. In addition, the journal
indicates the achievement of abnormal returns, which is generated after the earnings
announcements. Moreover, the journal also indicates that shareholder with the help in
earnings announcement can increase their return from investment.
ADVANCED CORPORATE REPORTING
5
The relevant journals, depicted above mentions the positive and negative attributes of
earnings announcements. In addition, the journal sheds light on the impact of earning
announcements on share price valuation of the company.
Methodology:
The methodology of the report indicates the relevant method of data collection, choice
of estimation period, event window and data analysis. In addition, the methodology indicates
relevant data collection, which is been conducted with the help on yahoo finance, where share
price of companies and FTSE250 is detected. The data is relevantly adequate, which is
collected from yahoo finance and is used in conducting data analysis of the report. The
overall estimation period is calculated for 1-year duration from the announcement date of
earnings report. Moreover, the event window is for 10 days, which is 5 days before the event
and 5 days after the event. This gives the total evaluation date of 11 days, which is used in
detecting the impact of earnings announcement. Furthermore, the data analysis part mainly
uses abnormal returns, Steyx Squared, T-Test, slope, intercept, Steyx and Rsquared for
detecting the overall significance of earnings announcement.
Analysis of the result:
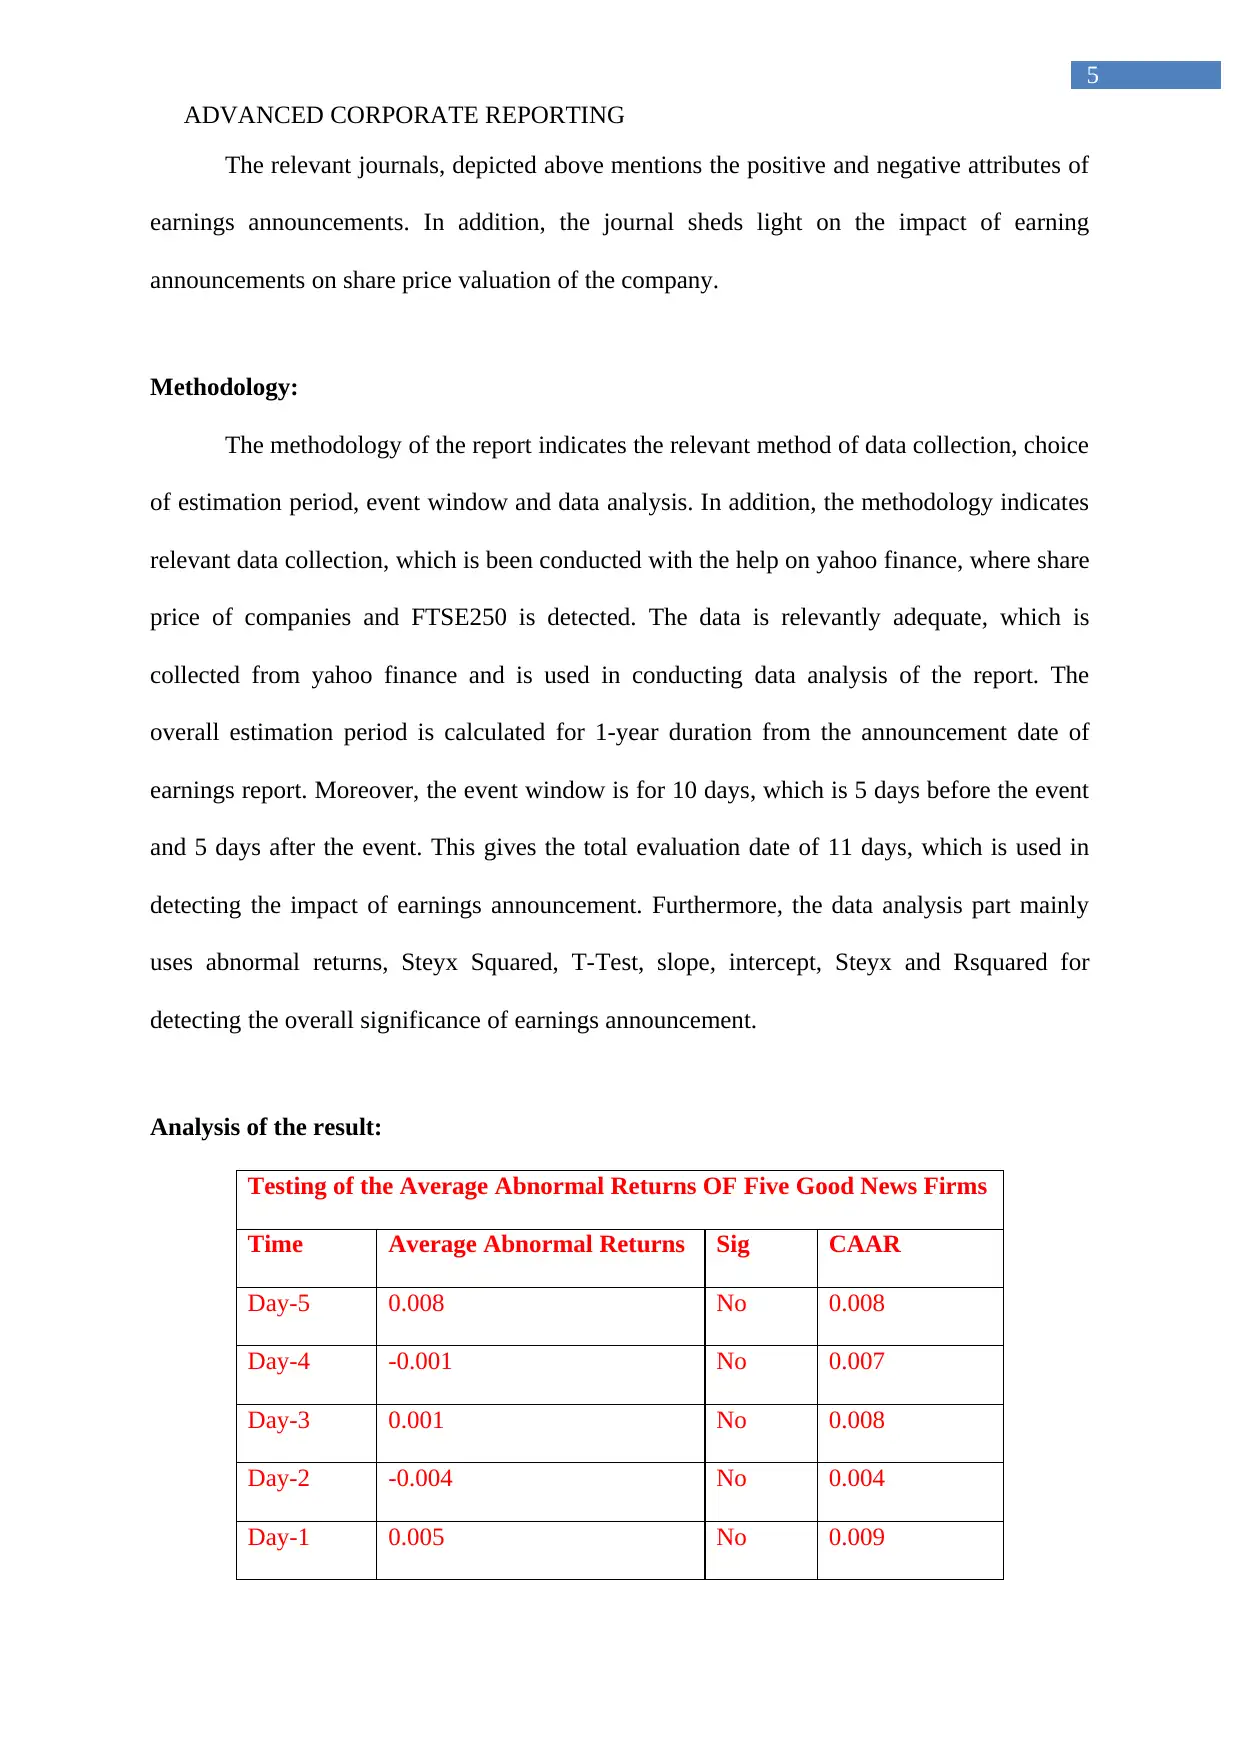
Testing of the Average Abnormal Returns OF Five Good News Firms
Time Average Abnormal Returns Sig CAAR
Day-5 0.008 No 0.008
Day-4 -0.001 No 0.007
Day-3 0.001 No 0.008
Day-2 -0.004 No 0.004
Day-1 0.005 No 0.009
5
The relevant journals, depicted above mentions the positive and negative attributes of
earnings announcements. In addition, the journal sheds light on the impact of earning
announcements on share price valuation of the company.
Methodology:
The methodology of the report indicates the relevant method of data collection, choice
of estimation period, event window and data analysis. In addition, the methodology indicates
relevant data collection, which is been conducted with the help on yahoo finance, where share
price of companies and FTSE250 is detected. The data is relevantly adequate, which is
collected from yahoo finance and is used in conducting data analysis of the report. The
overall estimation period is calculated for 1-year duration from the announcement date of
earnings report. Moreover, the event window is for 10 days, which is 5 days before the event
and 5 days after the event. This gives the total evaluation date of 11 days, which is used in
detecting the impact of earnings announcement. Furthermore, the data analysis part mainly
uses abnormal returns, Steyx Squared, T-Test, slope, intercept, Steyx and Rsquared for
detecting the overall significance of earnings announcement.
Analysis of the result:
Testing of the Average Abnormal Returns OF Five Good News Firms
Time Average Abnormal Returns Sig CAAR
Day-5 0.008 No 0.008
Day-4 -0.001 No 0.007
Day-3 0.001 No 0.008
Day-2 -0.004 No 0.004
Day-1 0.005 No 0.009
⊘ This is a preview!⊘
Do you want full access?
Subscribe today to unlock all pages.
Trusted by 1+ million students worldwide
ADVANCED CORPORATE REPORTING
6
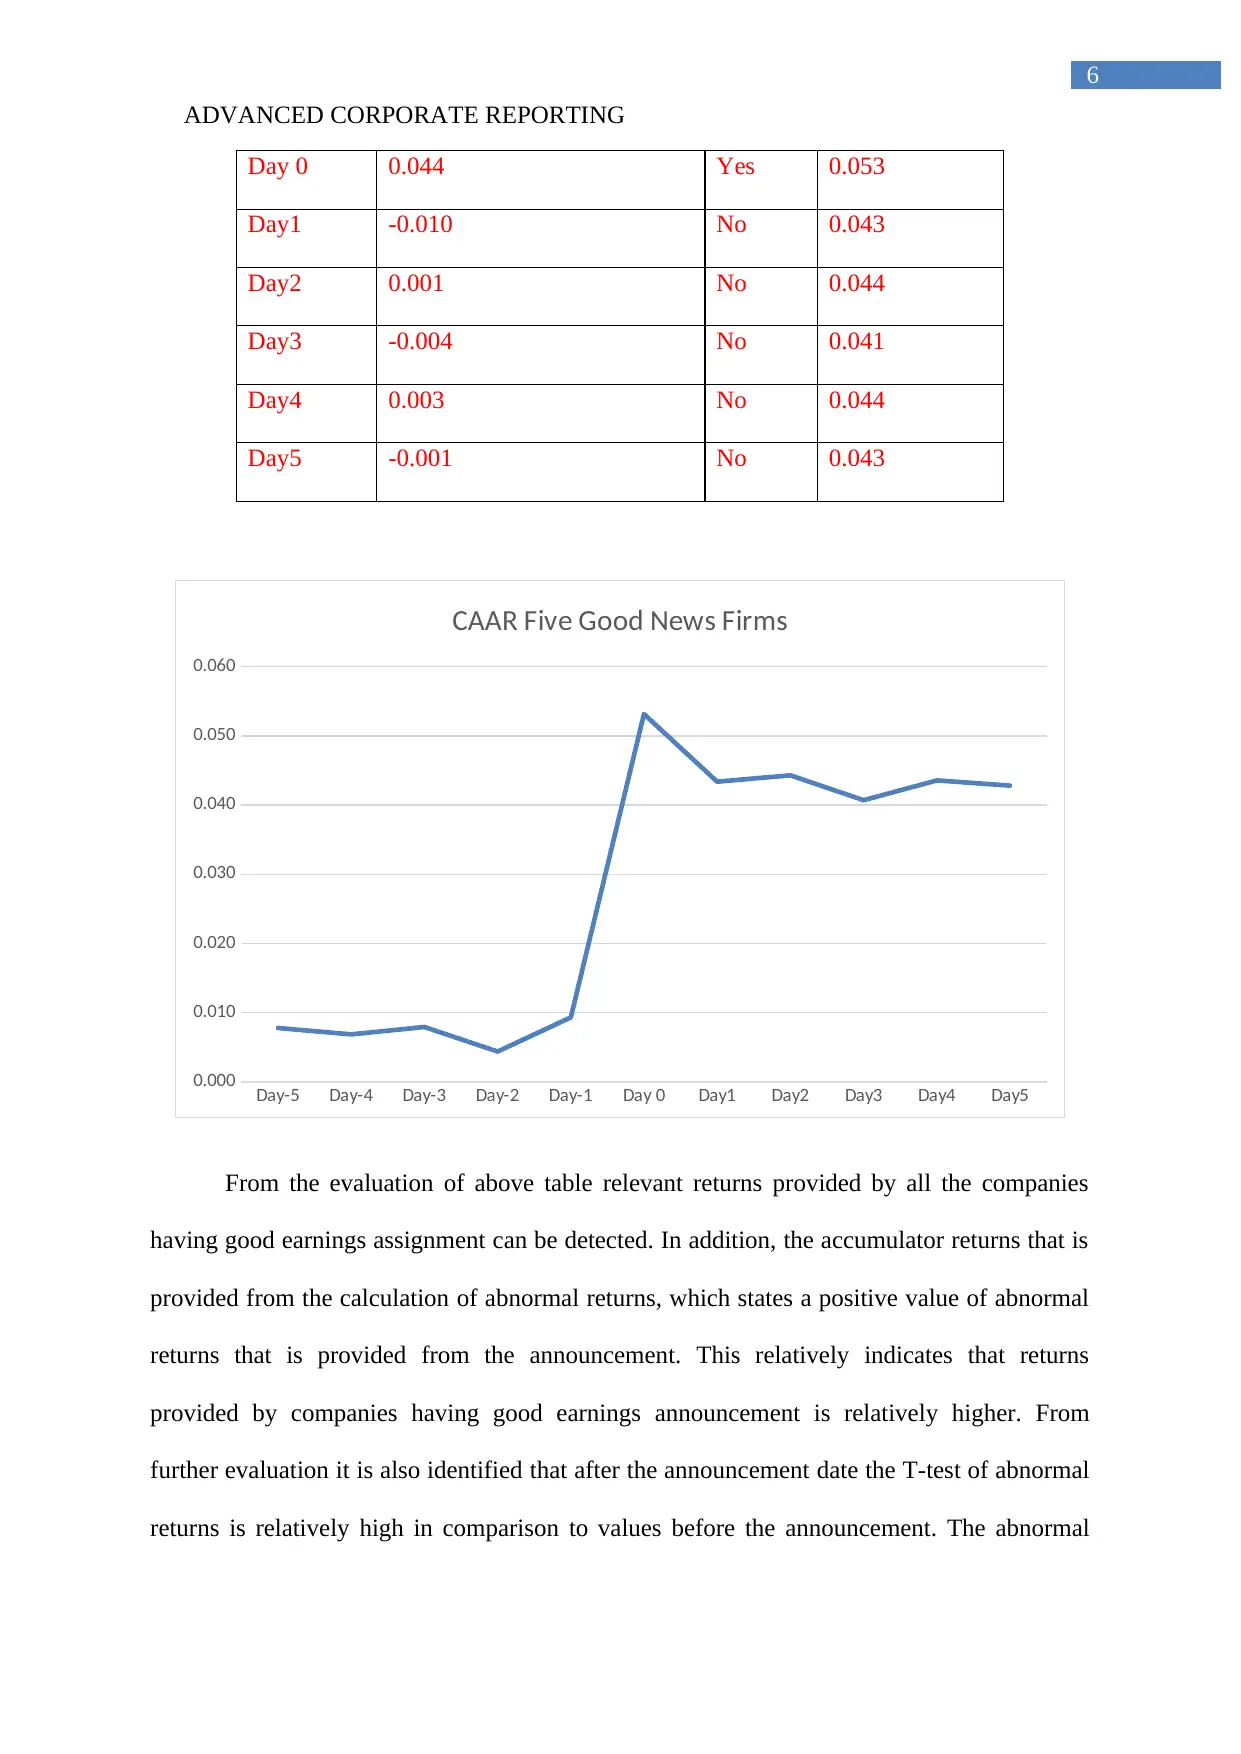
Day 0 0.044 Yes 0.053
Day1 -0.010 No 0.043
Day2 0.001 No 0.044
Day3 -0.004 No 0.041
Day4 0.003 No 0.044
Day5 -0.001 No 0.043
Day-5 Day-4 Day-3 Day-2 Day-1 Day 0 Day1 Day2 Day3 Day4 Day5
0.000
0.010
0.020
0.030
0.040
0.050
0.060
CAAR Five Good News Firms
From the evaluation of above table relevant returns provided by all the companies
having good earnings assignment can be detected. In addition, the accumulator returns that is
provided from the calculation of abnormal returns, which states a positive value of abnormal
returns that is provided from the announcement. This relatively indicates that returns
provided by companies having good earnings announcement is relatively higher. From
further evaluation it is also identified that after the announcement date the T-test of abnormal
returns is relatively high in comparison to values before the announcement. The abnormal
6
Day 0 0.044 Yes 0.053
Day1 -0.010 No 0.043
Day2 0.001 No 0.044
Day3 -0.004 No 0.041
Day4 0.003 No 0.044
Day5 -0.001 No 0.043
Day-5 Day-4 Day-3 Day-2 Day-1 Day 0 Day1 Day2 Day3 Day4 Day5
0.000
0.010
0.020
0.030
0.040
0.050
0.060
CAAR Five Good News Firms
From the evaluation of above table relevant returns provided by all the companies
having good earnings assignment can be detected. In addition, the accumulator returns that is
provided from the calculation of abnormal returns, which states a positive value of abnormal
returns that is provided from the announcement. This relatively indicates that returns
provided by companies having good earnings announcement is relatively higher. From
further evaluation it is also identified that after the announcement date the T-test of abnormal
returns is relatively high in comparison to values before the announcement. The abnormal
Paraphrase This Document
Need a fresh take? Get an instant paraphrase of this document with our AI Paraphraser
ADVANCED CORPORATE REPORTING
7
returns during the announcement is relatively higher income parents to all the other days,
which is supported by the signal provider from T-test of abnormal returns.
The calculation also indicates a high CAAR of 0.043, which is derived from the
abnormal returns. This directly indicates the positive attributes of good earnings
announcement, which is conducted by the companies. The highest average abnormal returns
were only detected on the day of the announcement, which was conducted by the company.
This relatively indicates that positive earnings announcement increases the value of shares
and provides investors with abnormal returns. In this context, Frederickson and Zolotoy
(2015) argued that increment in abnormal returns relatively indicates the wrong pricing of
shares, which is conducted by investors.
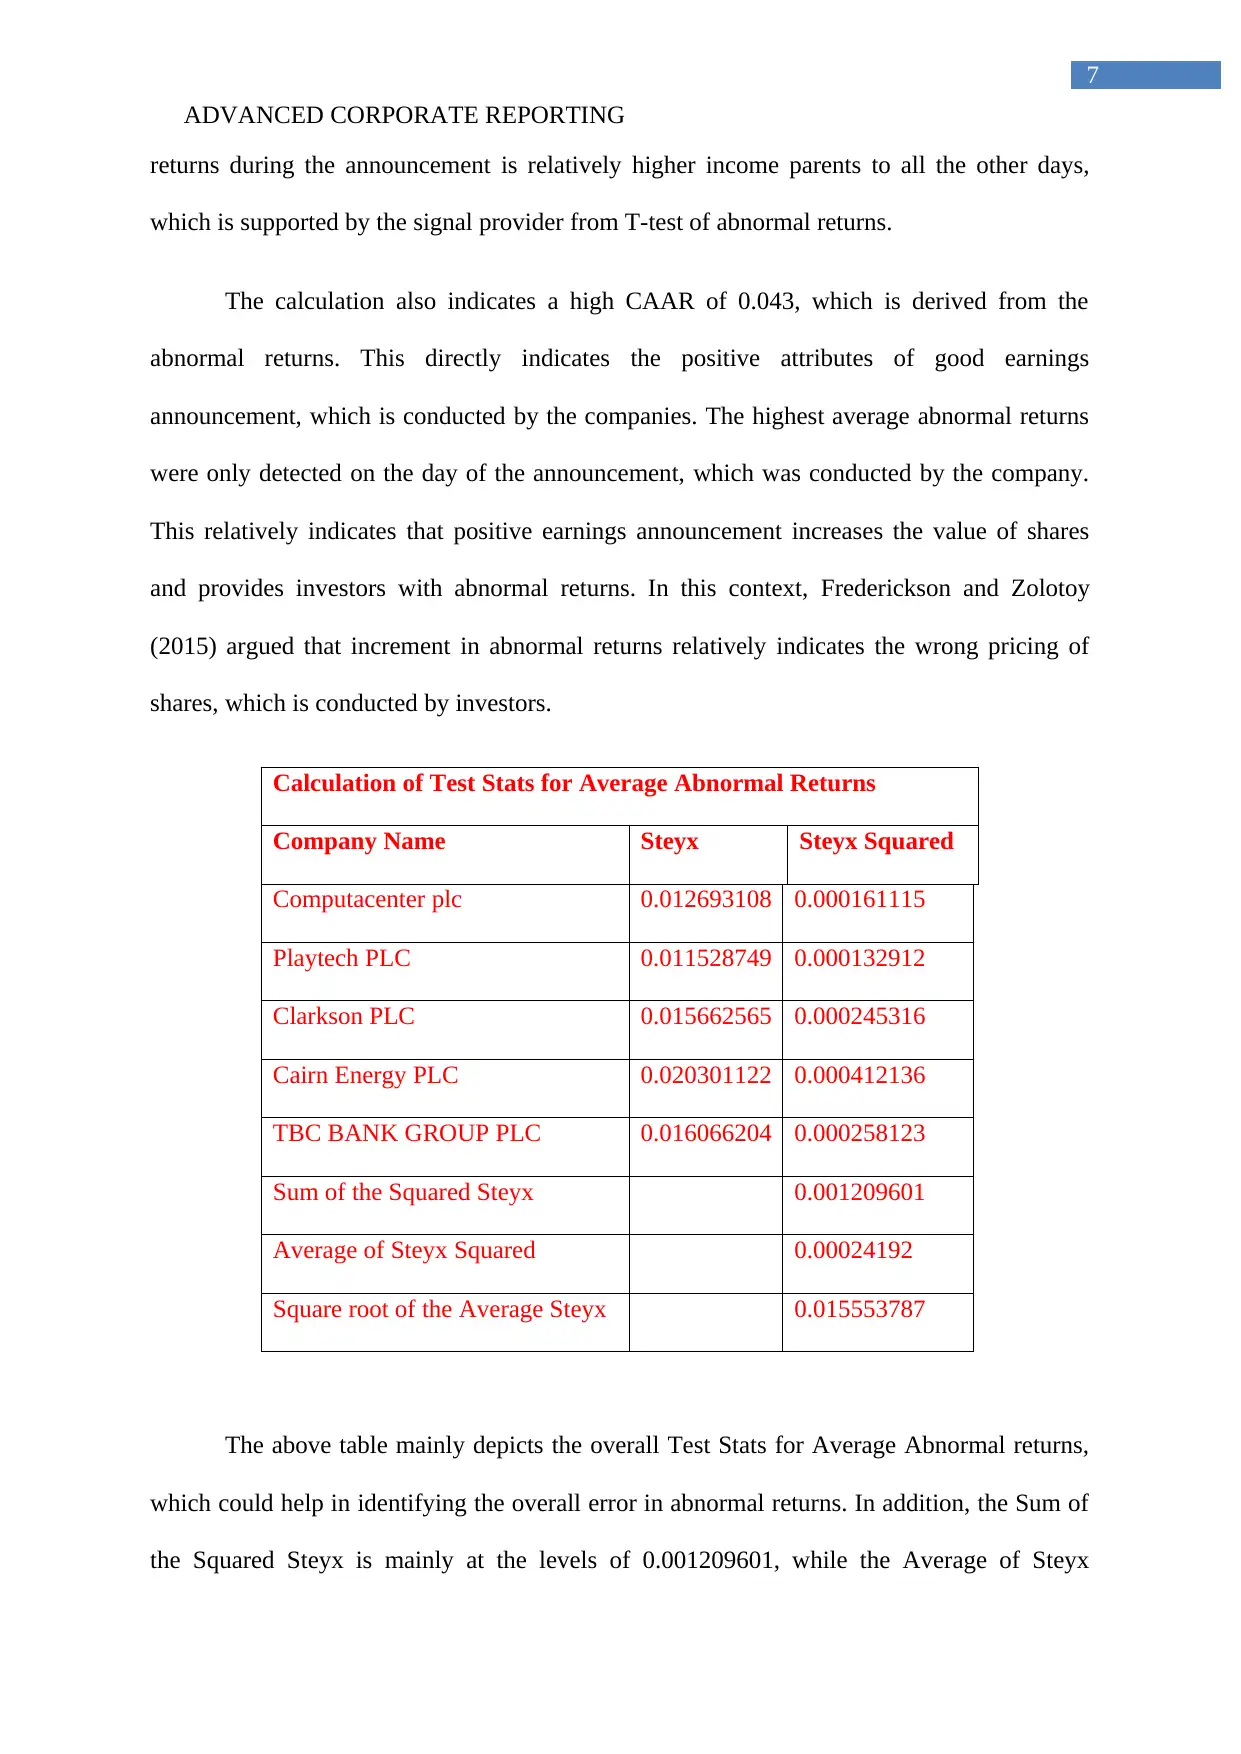
Calculation of Test Stats for Average Abnormal Returns
Company Name Steyx Steyx Squared
Computacenter plc 0.012693108 0.000161115
Playtech PLC 0.011528749 0.000132912
Clarkson PLC 0.015662565 0.000245316
Cairn Energy PLC 0.020301122 0.000412136
TBC BANK GROUP PLC 0.016066204 0.000258123
Sum of the Squared Steyx 0.001209601
Average of Steyx Squared 0.00024192
Square root of the Average Steyx 0.015553787
The above table mainly depicts the overall Test Stats for Average Abnormal returns,
which could help in identifying the overall error in abnormal returns. In addition, the Sum of
the Squared Steyx is mainly at the levels of 0.001209601, while the Average of Steyx
7
returns during the announcement is relatively higher income parents to all the other days,
which is supported by the signal provider from T-test of abnormal returns.
The calculation also indicates a high CAAR of 0.043, which is derived from the
abnormal returns. This directly indicates the positive attributes of good earnings
announcement, which is conducted by the companies. The highest average abnormal returns
were only detected on the day of the announcement, which was conducted by the company.
This relatively indicates that positive earnings announcement increases the value of shares
and provides investors with abnormal returns. In this context, Frederickson and Zolotoy
(2015) argued that increment in abnormal returns relatively indicates the wrong pricing of
shares, which is conducted by investors.
Calculation of Test Stats for Average Abnormal Returns
Company Name Steyx Steyx Squared
Computacenter plc 0.012693108 0.000161115
Playtech PLC 0.011528749 0.000132912
Clarkson PLC 0.015662565 0.000245316
Cairn Energy PLC 0.020301122 0.000412136
TBC BANK GROUP PLC 0.016066204 0.000258123
Sum of the Squared Steyx 0.001209601
Average of Steyx Squared 0.00024192
Square root of the Average Steyx 0.015553787
The above table mainly depicts the overall Test Stats for Average Abnormal returns,
which could help in identifying the overall error in abnormal returns. In addition, the Sum of
the Squared Steyx is mainly at the levels of 0.001209601, while the Average of Steyx
ADVANCED CORPORATE REPORTING
8
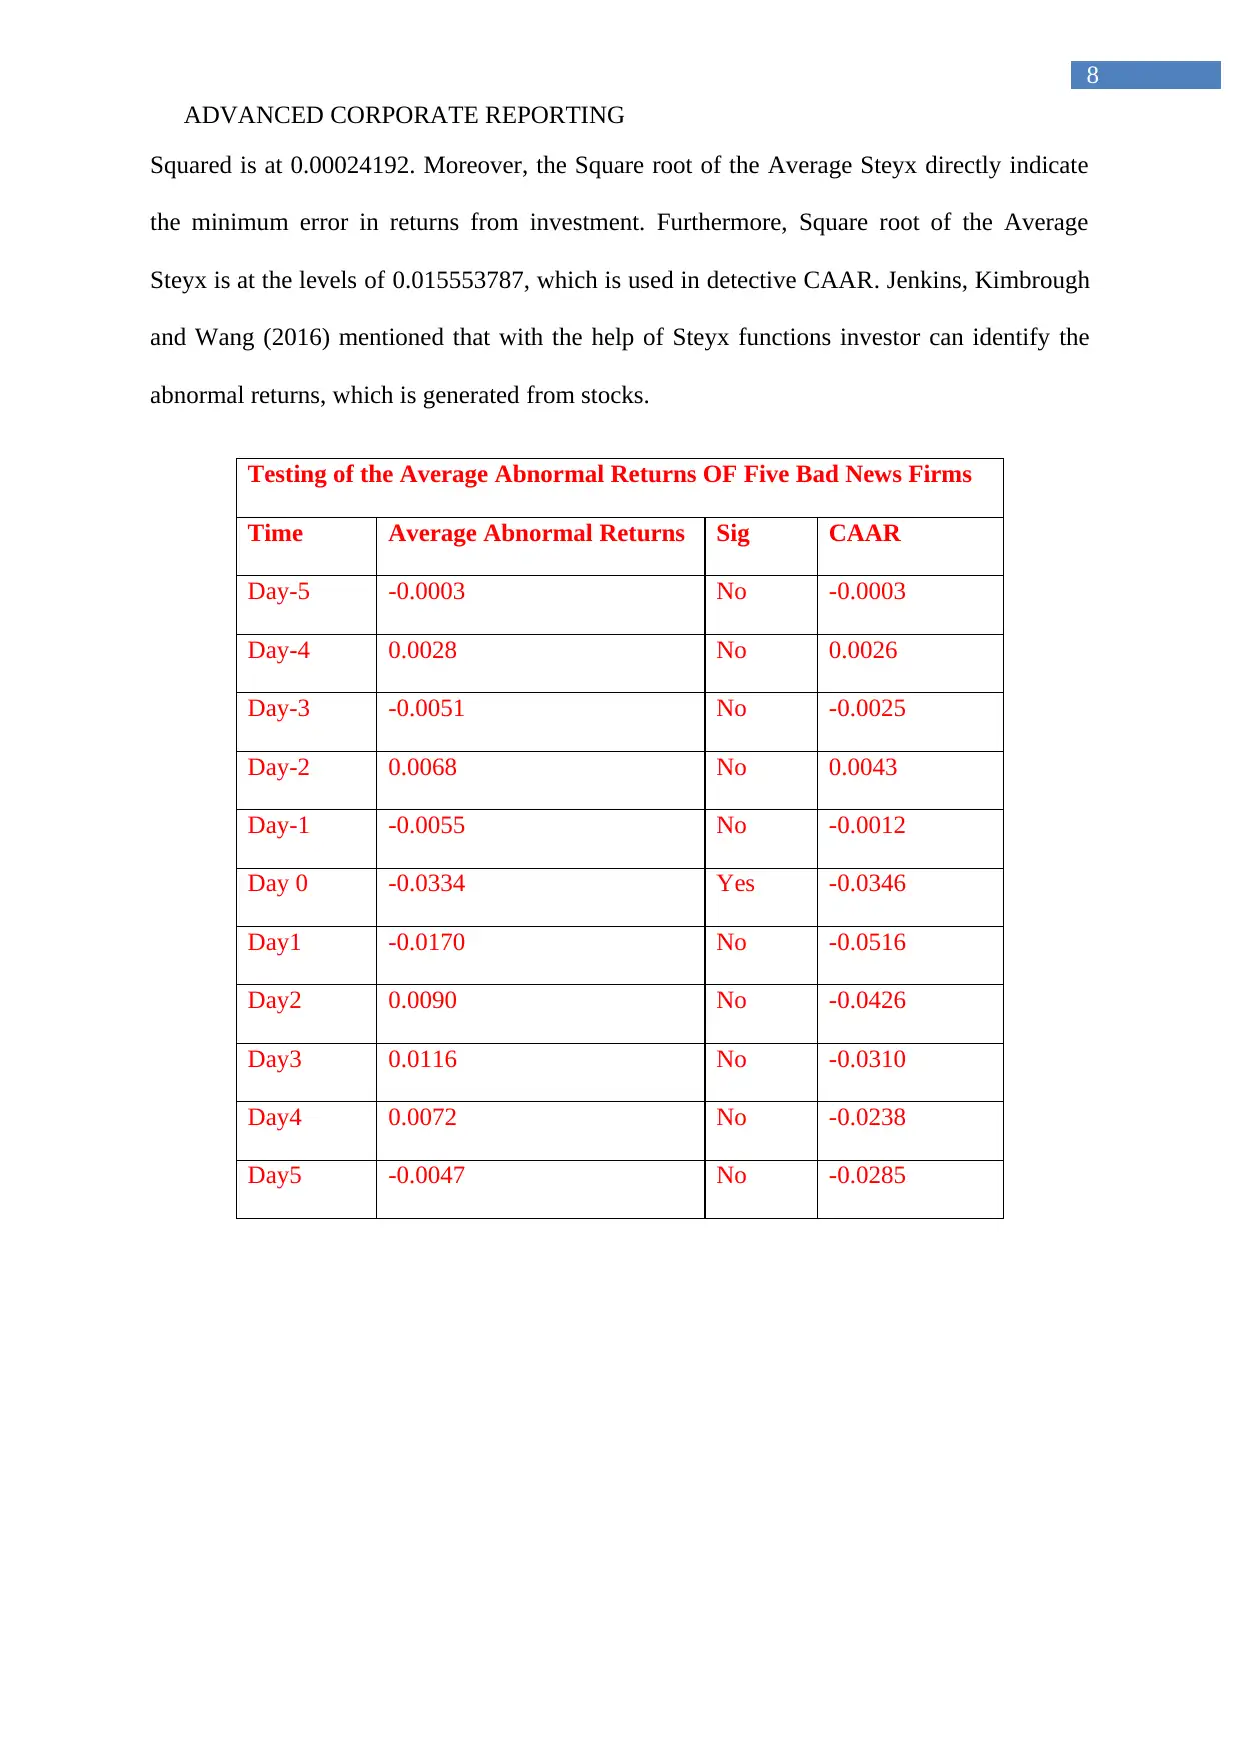
Squared is at 0.00024192. Moreover, the Square root of the Average Steyx directly indicate
the minimum error in returns from investment. Furthermore, Square root of the Average
Steyx is at the levels of 0.015553787, which is used in detective CAAR. Jenkins, Kimbrough
and Wang (2016) mentioned that with the help of Steyx functions investor can identify the
abnormal returns, which is generated from stocks.
Testing of the Average Abnormal Returns OF Five Bad News Firms
Time Average Abnormal Returns Sig CAAR
Day-5 -0.0003 No -0.0003
Day-4 0.0028 No 0.0026
Day-3 -0.0051 No -0.0025
Day-2 0.0068 No 0.0043
Day-1 -0.0055 No -0.0012
Day 0 -0.0334 Yes -0.0346
Day1 -0.0170 No -0.0516
Day2 0.0090 No -0.0426
Day3 0.0116 No -0.0310
Day4 0.0072 No -0.0238
Day5 -0.0047 No -0.0285
8
Squared is at 0.00024192. Moreover, the Square root of the Average Steyx directly indicate
the minimum error in returns from investment. Furthermore, Square root of the Average
Steyx is at the levels of 0.015553787, which is used in detective CAAR. Jenkins, Kimbrough
and Wang (2016) mentioned that with the help of Steyx functions investor can identify the
abnormal returns, which is generated from stocks.
Testing of the Average Abnormal Returns OF Five Bad News Firms
Time Average Abnormal Returns Sig CAAR
Day-5 -0.0003 No -0.0003
Day-4 0.0028 No 0.0026
Day-3 -0.0051 No -0.0025
Day-2 0.0068 No 0.0043
Day-1 -0.0055 No -0.0012
Day 0 -0.0334 Yes -0.0346
Day1 -0.0170 No -0.0516
Day2 0.0090 No -0.0426
Day3 0.0116 No -0.0310
Day4 0.0072 No -0.0238
Day5 -0.0047 No -0.0285
⊘ This is a preview!⊘
Do you want full access?
Subscribe today to unlock all pages.
Trusted by 1+ million students worldwide
ADVANCED CORPORATE REPORTING
9
Day-5 Day-4 Day-3 Day-2 Day-1 Day 0 Day1 Day2 Day3 Day4 Day5
-0.0600
-0.0500
-0.0400
-0.0300
-0.0200
-0.0100
0.0000
0.0100
CAAR Five Bad News Firms
CAAR
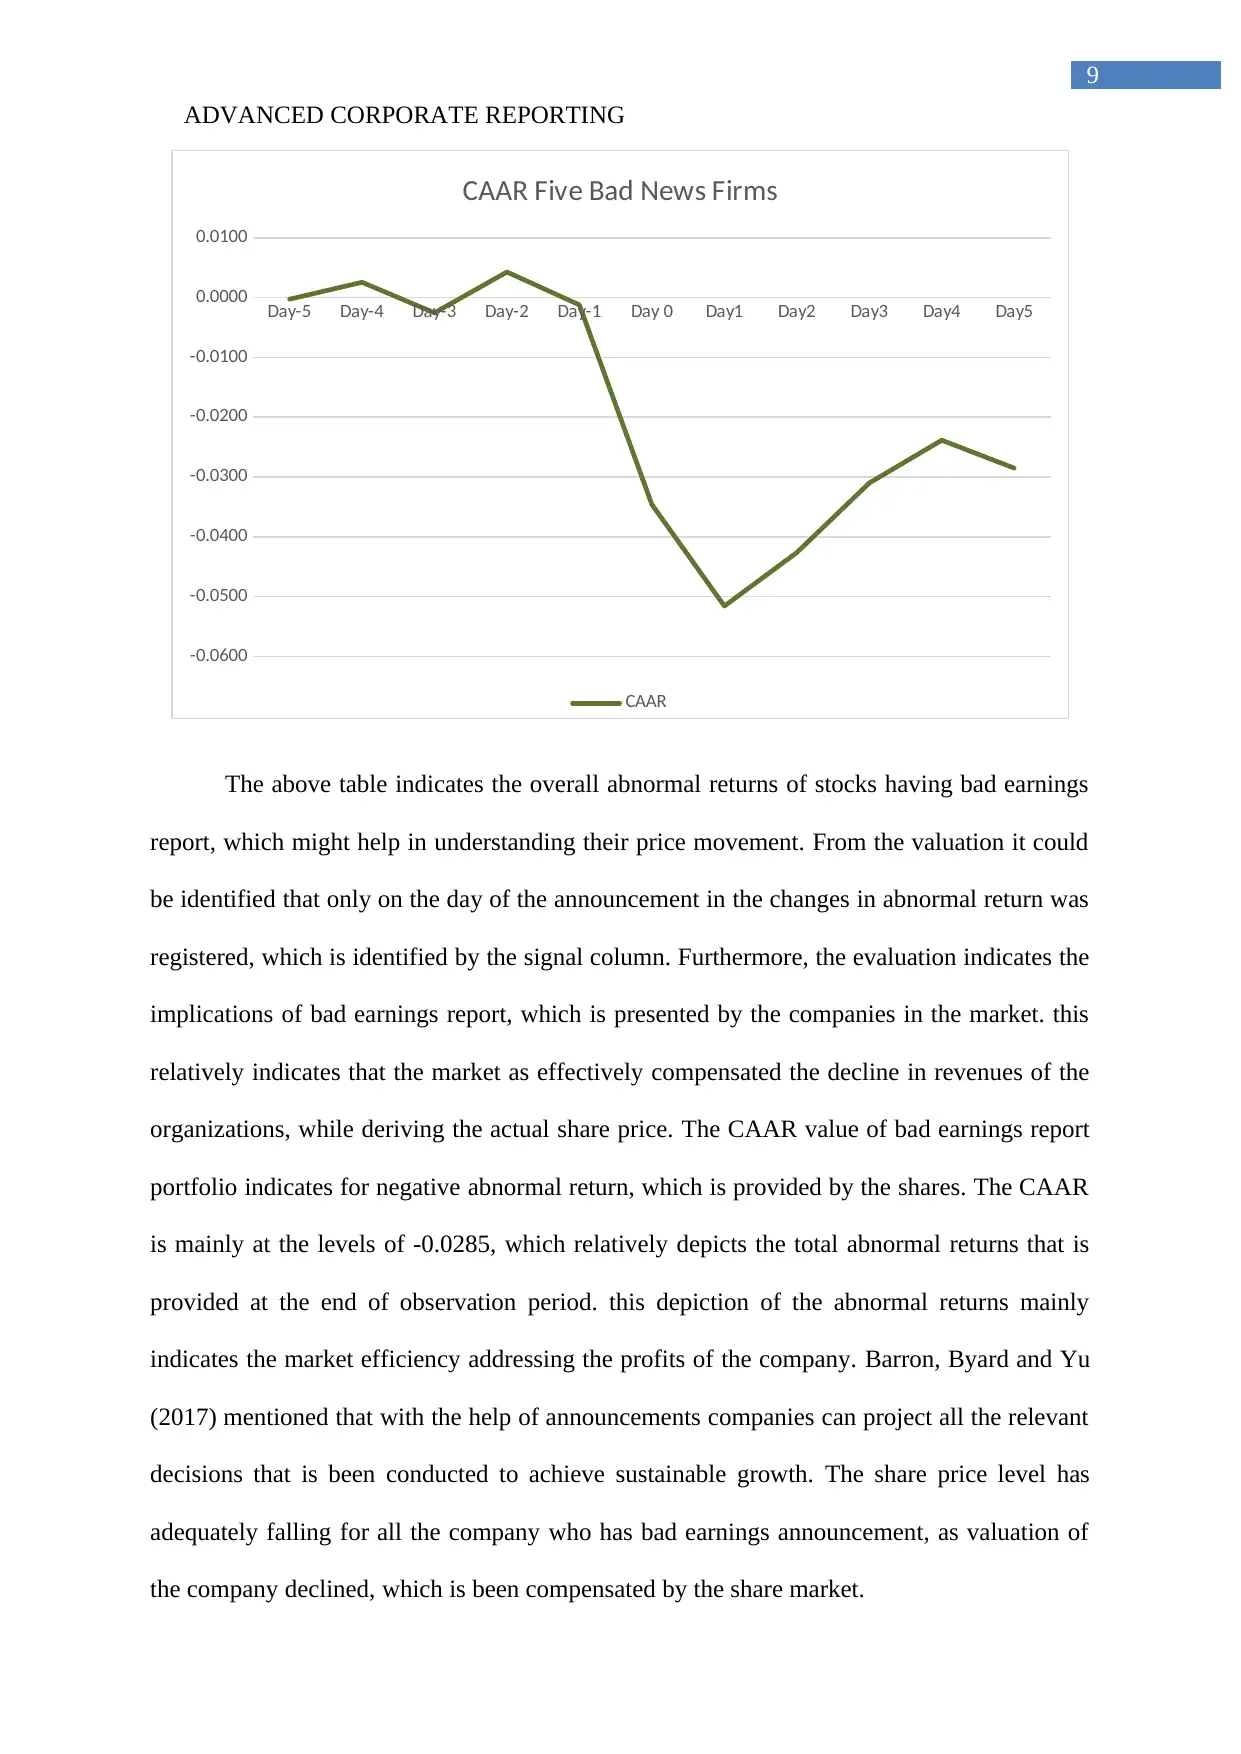
The above table indicates the overall abnormal returns of stocks having bad earnings
report, which might help in understanding their price movement. From the valuation it could
be identified that only on the day of the announcement in the changes in abnormal return was
registered, which is identified by the signal column. Furthermore, the evaluation indicates the
implications of bad earnings report, which is presented by the companies in the market. this
relatively indicates that the market as effectively compensated the decline in revenues of the
organizations, while deriving the actual share price. The CAAR value of bad earnings report
portfolio indicates for negative abnormal return, which is provided by the shares. The CAAR
is mainly at the levels of -0.0285, which relatively depicts the total abnormal returns that is
provided at the end of observation period. this depiction of the abnormal returns mainly
indicates the market efficiency addressing the profits of the company. Barron, Byard and Yu
(2017) mentioned that with the help of announcements companies can project all the relevant
decisions that is been conducted to achieve sustainable growth. The share price level has
adequately falling for all the company who has bad earnings announcement, as valuation of
the company declined, which is been compensated by the share market.
9
Day-5 Day-4 Day-3 Day-2 Day-1 Day 0 Day1 Day2 Day3 Day4 Day5
-0.0600
-0.0500
-0.0400
-0.0300
-0.0200
-0.0100
0.0000
0.0100
CAAR Five Bad News Firms
CAAR
The above table indicates the overall abnormal returns of stocks having bad earnings
report, which might help in understanding their price movement. From the valuation it could
be identified that only on the day of the announcement in the changes in abnormal return was
registered, which is identified by the signal column. Furthermore, the evaluation indicates the
implications of bad earnings report, which is presented by the companies in the market. this
relatively indicates that the market as effectively compensated the decline in revenues of the
organizations, while deriving the actual share price. The CAAR value of bad earnings report
portfolio indicates for negative abnormal return, which is provided by the shares. The CAAR
is mainly at the levels of -0.0285, which relatively depicts the total abnormal returns that is
provided at the end of observation period. this depiction of the abnormal returns mainly
indicates the market efficiency addressing the profits of the company. Barron, Byard and Yu
(2017) mentioned that with the help of announcements companies can project all the relevant
decisions that is been conducted to achieve sustainable growth. The share price level has
adequately falling for all the company who has bad earnings announcement, as valuation of
the company declined, which is been compensated by the share market.
Paraphrase This Document
Need a fresh take? Get an instant paraphrase of this document with our AI Paraphraser
ADVANCED CORPORATE REPORTING
10
Calculation of Test Stats for Average Abnormal Returns
Company Name Steyx Steyx Squared
Hikma Pharmaceutical 0.017386968 0.000302307
Murray Intnl Trust 0.007943647 6.31015E-05
Phoenix Grp Hldgs 0.007989165 6.38268E-05
RIVERSTONE ENERGY LD 0.010552464 0.000111354
Ultra Electronics Holdings plc 0.011360017 0.00012905
Sum of the Squared Steyx 0.000669639
Average of Steyx Squared 0.000133928
Square root of the Average Steyx 0.011572722
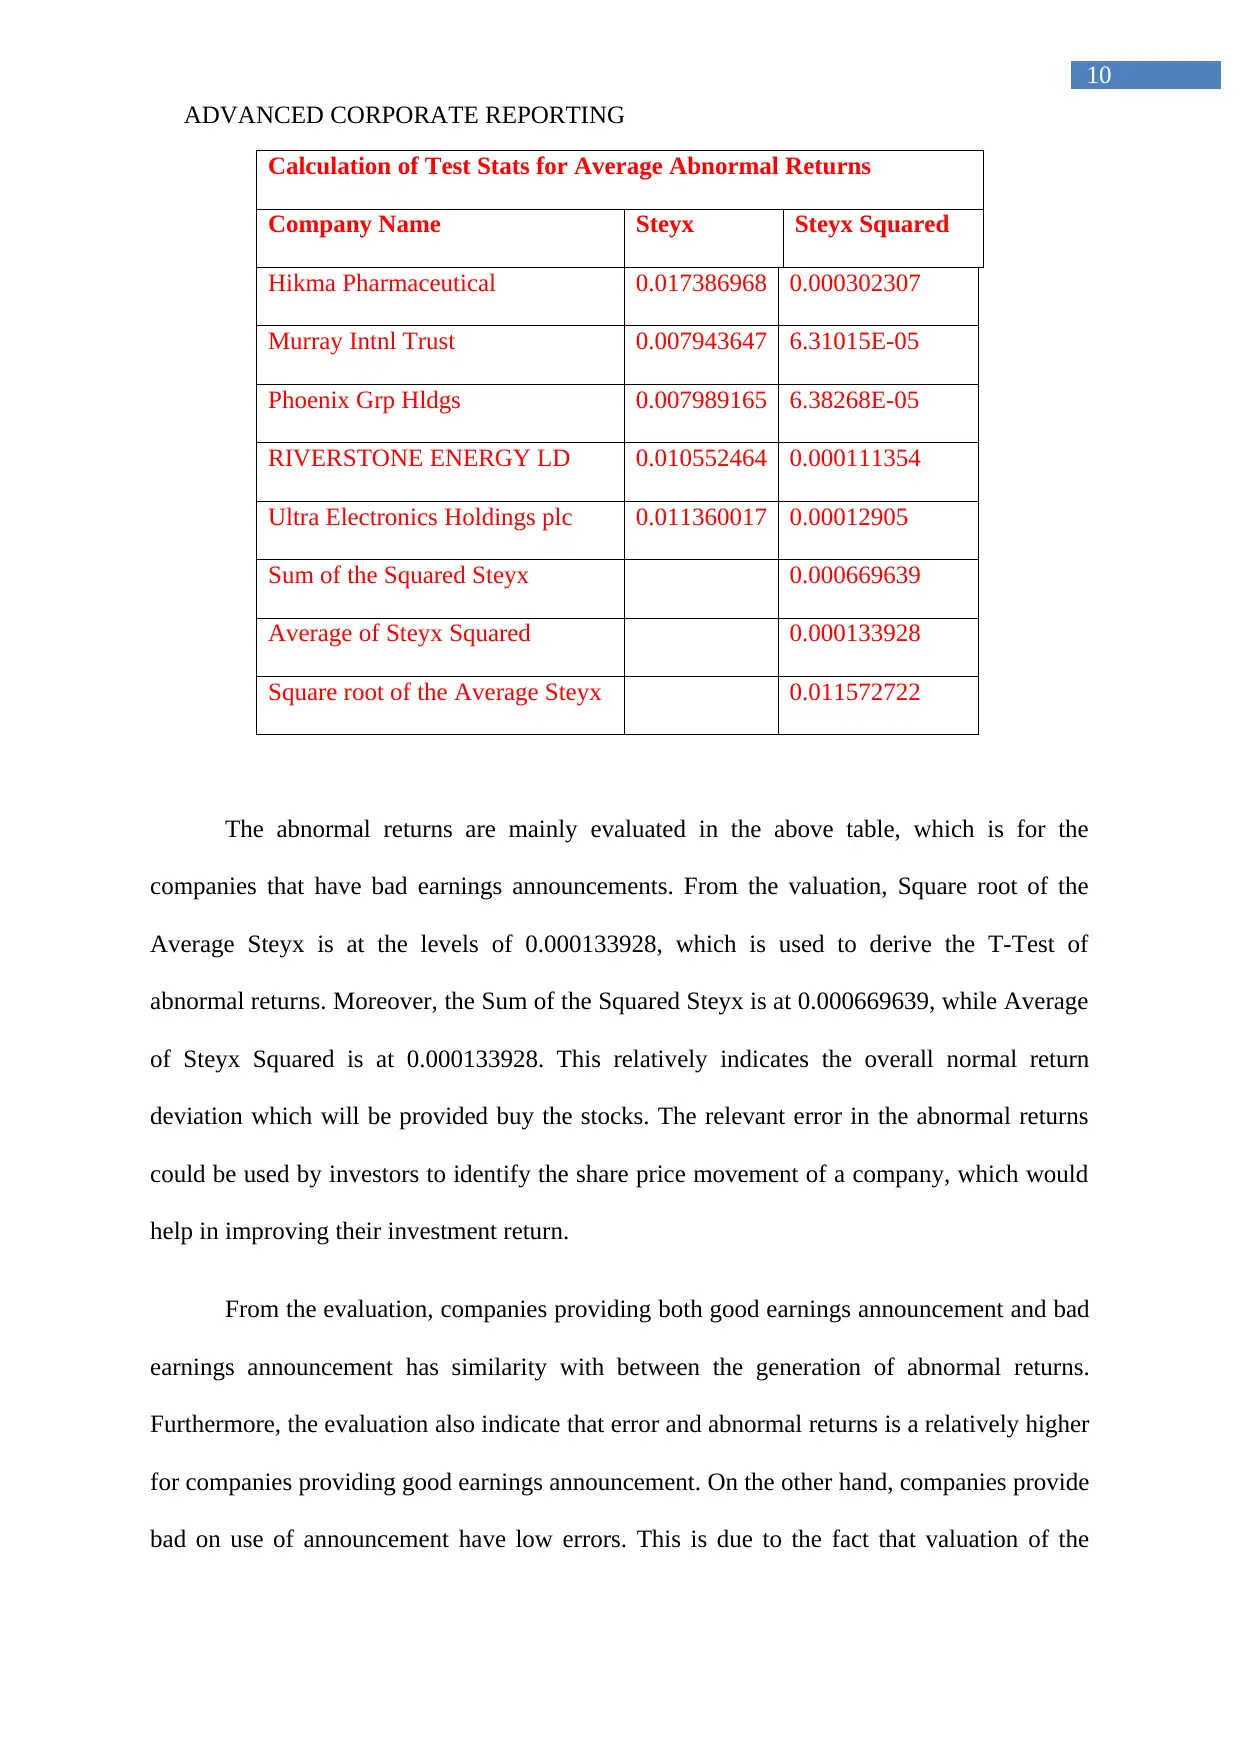
The abnormal returns are mainly evaluated in the above table, which is for the
companies that have bad earnings announcements. From the valuation, Square root of the
Average Steyx is at the levels of 0.000133928, which is used to derive the T-Test of
abnormal returns. Moreover, the Sum of the Squared Steyx is at 0.000669639, while Average
of Steyx Squared is at 0.000133928. This relatively indicates the overall normal return
deviation which will be provided buy the stocks. The relevant error in the abnormal returns
could be used by investors to identify the share price movement of a company, which would
help in improving their investment return.
From the evaluation, companies providing both good earnings announcement and bad
earnings announcement has similarity with between the generation of abnormal returns.
Furthermore, the evaluation also indicate that error and abnormal returns is a relatively higher
for companies providing good earnings announcement. On the other hand, companies provide
bad on use of announcement have low errors. This is due to the fact that valuation of the
10
Calculation of Test Stats for Average Abnormal Returns
Company Name Steyx Steyx Squared
Hikma Pharmaceutical 0.017386968 0.000302307
Murray Intnl Trust 0.007943647 6.31015E-05
Phoenix Grp Hldgs 0.007989165 6.38268E-05
RIVERSTONE ENERGY LD 0.010552464 0.000111354
Ultra Electronics Holdings plc 0.011360017 0.00012905
Sum of the Squared Steyx 0.000669639
Average of Steyx Squared 0.000133928
Square root of the Average Steyx 0.011572722
The abnormal returns are mainly evaluated in the above table, which is for the
companies that have bad earnings announcements. From the valuation, Square root of the
Average Steyx is at the levels of 0.000133928, which is used to derive the T-Test of
abnormal returns. Moreover, the Sum of the Squared Steyx is at 0.000669639, while Average
of Steyx Squared is at 0.000133928. This relatively indicates the overall normal return
deviation which will be provided buy the stocks. The relevant error in the abnormal returns
could be used by investors to identify the share price movement of a company, which would
help in improving their investment return.
From the evaluation, companies providing both good earnings announcement and bad
earnings announcement has similarity with between the generation of abnormal returns.
Furthermore, the evaluation also indicate that error and abnormal returns is a relatively higher
for companies providing good earnings announcement. On the other hand, companies provide
bad on use of announcement have low errors. This is due to the fact that valuation of the
ADVANCED CORPORATE REPORTING
11
company with increase profitability is not easy to comprehend by the investors. Nevertheless,
CAAR of companies having good earnings announcement is a relatively higher in
comparison to the companies having bad earnings announcement. In addition, it is due to the
impact of shareholders sentiments, which derives the actual value of the stock. the companies
provide an expected return, which will be achieved in the fiscal year (Efendi, Park and Smith
2014). However, the non-completion of the projected returns would result in drastic changes
in the share price of the company. Therefore, the good earnings announcement indicated a
more valuation for the company, which increased the chances of abnormal returns and errors.
Though, valuation of bad earnings announcement is effectively conducted by investors,
where the abnormal returns are high.
Conclusion:
From the evaluation of assessment impact of earnings announcement is evaluated,
which might allow investors to obtain abnormal gains from investment. devaluation of good
and bad awnings announcement is conducted within the assessment, which helps in deriving
the chances of error and abnormal returns provided from investment. Furthermore, the use of
statistical tool mainly indicated that abnormal returns are achieved during the announcement
of earnings that is conducted by companies. In addition, the abnormal returns are relatively
positive if news is good, while it is negative during bad announcements. Additionally, the
imperial research is being defected in the assessment, which the mechanism of abnormal
returns during positive earnings announcement. Moreover, the error during the bad earnings
announcement is relatively low, as investors would anticipate the value negative
announcement.
⊘ This is a preview!⊘
Do you want full access?
Subscribe today to unlock all pages.
Trusted by 1+ million students worldwide
1 out of 18
Related Documents


Your All-in-One AI-Powered Toolkit for Academic Success.
+13062052269
info@desklib.com
Available 24*7 on WhatsApp / Email
![[object Object]](/_next/static/media/star-bottom.7253800d.svg)
Unlock your academic potential
Copyright © 2020–2026 A2Z Services. All Rights Reserved. Developed and managed by ZUCOL.