Advanced Data Analytics: Terminologies, Methods, and Evaluation
VerifiedAdded on 2022/11/13
|20
|3658
|360
Presentation
AI Summary
This presentation, created for trainee system analysts at Calcutta Analytics, provides a comprehensive overview of advanced data analytics. It begins by defining key terminologies used by FTSE100 companies, including trend analysis, behavioral analytics, contextual data, data visualization, risk analysis, and financial volatility. The presentation then critically evaluates common data analytics methods such as mean, content analysis, regression analysis, Monte Carlo simulation, and hypothesis testing. It emphasizes the importance of data analytics in improving efficiency, market understanding, cost reduction, and decision-making. The presentation further explores data preparation processes, including understanding objectives, identifying problems, determining processes, identifying performance metrics, selecting and preparing data, and model development methodology. It also covers issues in data presentation, ensuring data quality, and the implementation of data analytics models, concluding with a discussion of data management programs and the building and deployment of models. The presentation aims to equip analysts with a thorough understanding of data analytics principles and practices, including the application of data analytics within the context of a consulting firm. The accompanying speaker notes provide further detail and context for each section.

Advanced Data Analytics 1
Advanced Data Analytics
Course
Date
Number of words
Name
Institution
Advanced Data Analytics
Course
Date
Number of words
Name
Institution
Paraphrase This Document
Need a fresh take? Get an instant paraphrase of this document with our AI Paraphraser
Advanced Data Analytics 2
Advanced-Data Analytics
Terminologies
1. Trend analysis
Trend analysis uses past data to make predictions on the market behaviors in the
future1. Every data analytics specialists need to have knowledge of the analysis data trends in
the market and make a rational financial decision. Therefore, it is crucial to be well-oriented
with how and why trend analysis in identifying and predicting market trends.
Generally, trend analysis is a comparative analysis of data over some time to predict
future behavior. The primary trend analysis in the stock market is to forecast the movements
of stock prices. A stock analyst uses past information and data to give an idea of what to
expect from stocks in the future. As such, a consultant can use trend analysis to advice a
client when to enter the market and when to exit. The analysis can also help the trader spot
potential problems in stock before they occur.
2. Behavioral analytics
Involve an analysis of people’s actions in the buying and selling of stocks. Consumer
behavior helps in the prediction and optimization of stock trading2. The presence of big data
has facilitated the analysis of people behavior and hence, likely to provide an accurate
prediction on market performance and other issues. A data analyst takes a keen interest in
what people say and do regarding the stock market because their actions and communications
have an impact on the stock exchange decisions.
1 J. Patel et al., "Predicting stock and stock price index movement using trend deterministic
data preparation and machine learning techniques." Expert Systems with Applications vol.
42, no. 1, 2015, p. 259-268.
2 G. Nabieu, "Model Behavior Analysis of Stock Market Indicators and Listed Companies:
Evidence from the Ghana Stock Exchange: Automated versus Floor Trading." International
Journal of Business and Management vol. 9, no. 11, 2014, p.234.
Advanced Data Analytics 3
3. Contextual data
This is the data that provide stock market context. The data is used to give a broader
understanding of the specific stock and placing it in a larger picture. Contextual data gives the
historical performance of certain stock to facilitate future decision.
4. Data visualization
It involves the use of graphical representation to present information and data about
stock market performance. Visualization is used to make it easy for the user to recognize
patterns and exceptions and hence make quick interpretations.
5. Risk analysis
It is the process of identifying and quantifying issues with the stock market and
making estimations about their impact. Risk assessment in the stock market is a critical
function of a data analyst to a client for there to be an informed judgment.
6. Financial volatility
It is the statistical measure of the dispersion of returns of a specific stock in the
market. A data analyst tries to measure whether the stock volatility is high or low and advice
the client accordingly. High volatility is associated with high-risk stocks.
Critical Evaluation of Common Data Analytics Methods
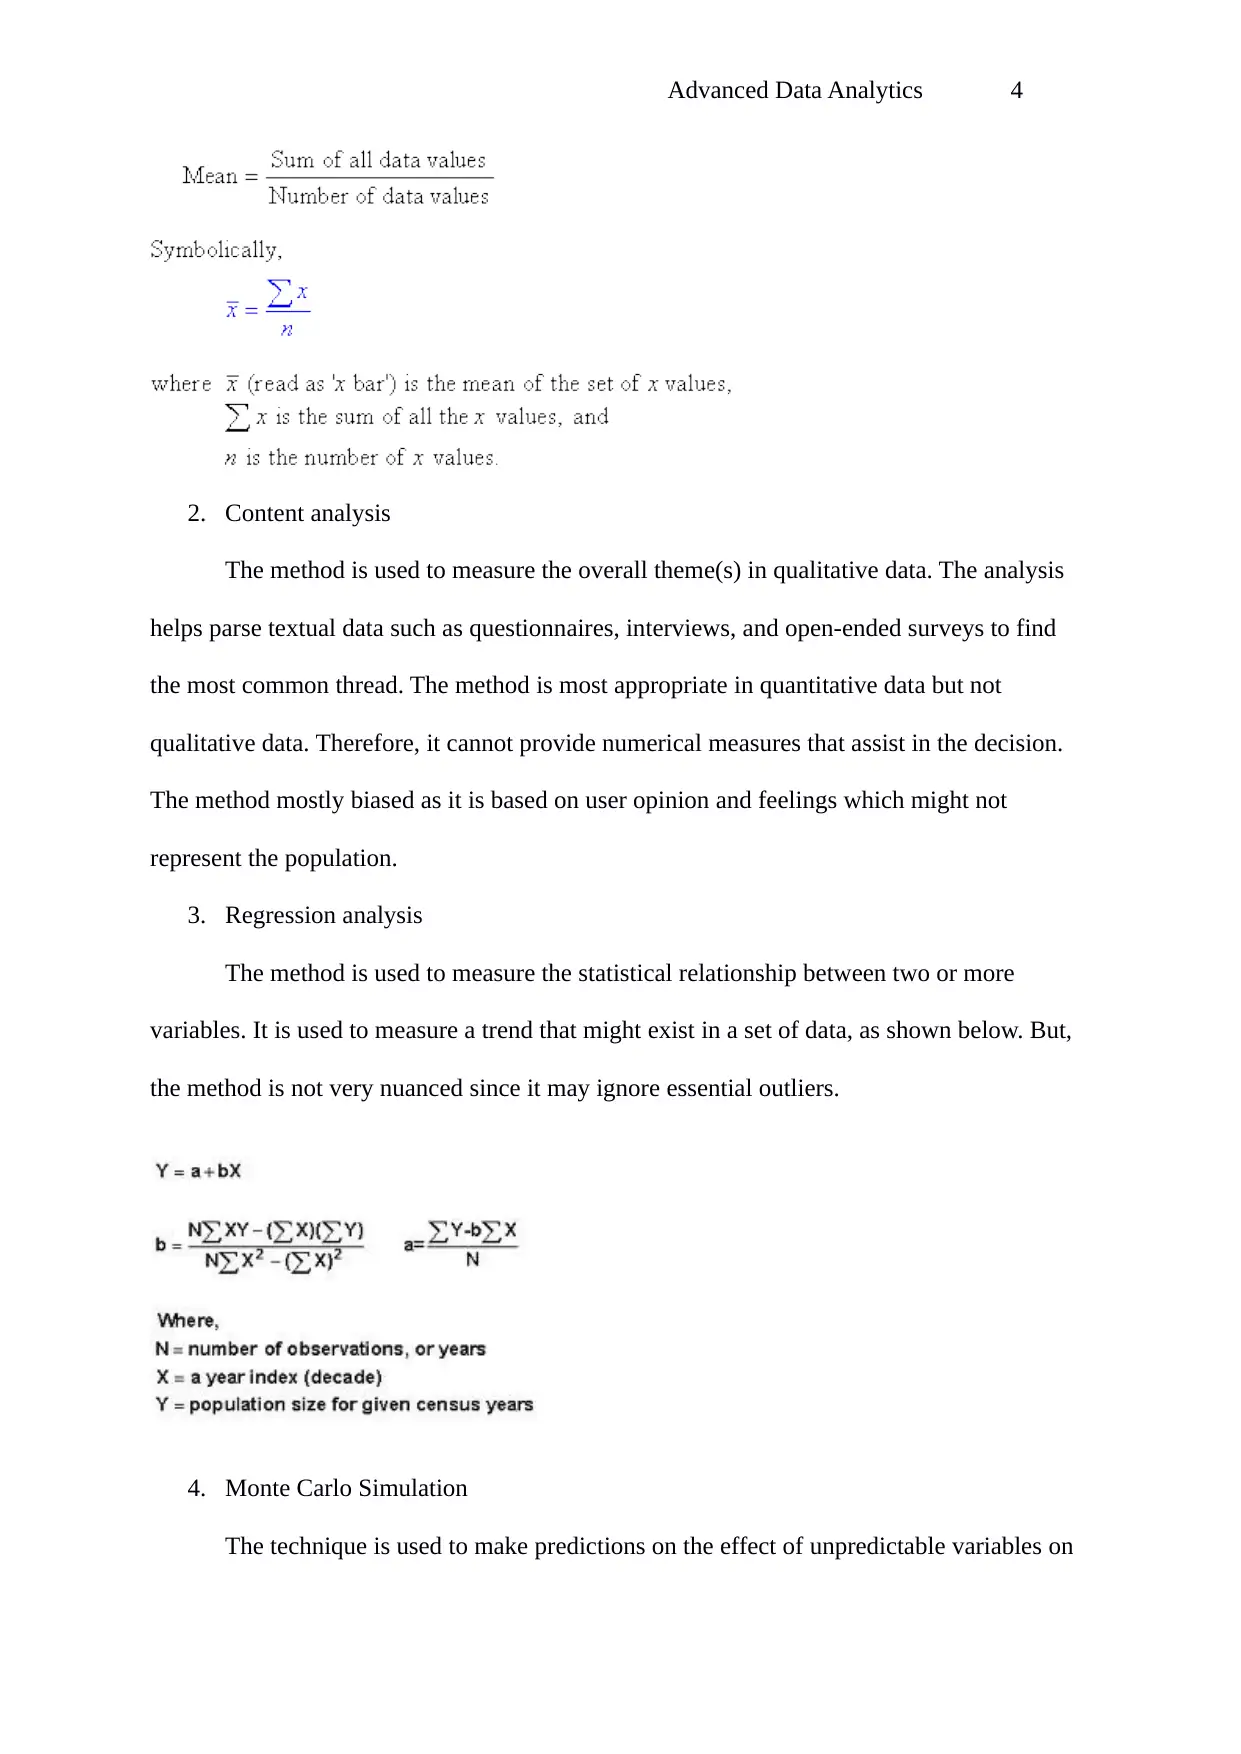
1. Mean
It is the average where the observations are divided by the number of observations
made, as shown in the formula below. Although it is an essential tool in data analysis, it is not
sufficient to facilitate rational decision. Mean is used together with mode and median to give
more information about the data set. Also, mean does not provide an accurate answer for
nuanced decision in extensive data which is likely to be skewed.
3. Contextual data
This is the data that provide stock market context. The data is used to give a broader
understanding of the specific stock and placing it in a larger picture. Contextual data gives the
historical performance of certain stock to facilitate future decision.
4. Data visualization
It involves the use of graphical representation to present information and data about
stock market performance. Visualization is used to make it easy for the user to recognize
patterns and exceptions and hence make quick interpretations.
5. Risk analysis
It is the process of identifying and quantifying issues with the stock market and
making estimations about their impact. Risk assessment in the stock market is a critical
function of a data analyst to a client for there to be an informed judgment.
6. Financial volatility
It is the statistical measure of the dispersion of returns of a specific stock in the
market. A data analyst tries to measure whether the stock volatility is high or low and advice
the client accordingly. High volatility is associated with high-risk stocks.
Critical Evaluation of Common Data Analytics Methods
1. Mean
It is the average where the observations are divided by the number of observations
made, as shown in the formula below. Although it is an essential tool in data analysis, it is not
sufficient to facilitate rational decision. Mean is used together with mode and median to give
more information about the data set. Also, mean does not provide an accurate answer for
nuanced decision in extensive data which is likely to be skewed.
⊘ This is a preview!⊘
Do you want full access?
Subscribe today to unlock all pages.
Trusted by 1+ million students worldwide
Advanced Data Analytics 4
2. Content analysis
The method is used to measure the overall theme(s) in qualitative data. The analysis
helps parse textual data such as questionnaires, interviews, and open-ended surveys to find
the most common thread. The method is most appropriate in quantitative data but not
qualitative data. Therefore, it cannot provide numerical measures that assist in the decision.
The method mostly biased as it is based on user opinion and feelings which might not
represent the population.
3. Regression analysis
The method is used to measure the statistical relationship between two or more
variables. It is used to measure a trend that might exist in a set of data, as shown below. But,
the method is not very nuanced since it may ignore essential outliers.
4. Monte Carlo Simulation
The technique is used to make predictions on the effect of unpredictable variables on
Paraphrase This Document
Need a fresh take? Get an instant paraphrase of this document with our AI Paraphraser
Advanced Data Analytics 5
a specific factor by use of the probability model and hence help in making predictions for
risks and uncertainty. It is used to simulate random data to get several possible outcomes.
Monte Carlo Simulation is critical for testing data uncertainty in results.
5. Hypothesis testing
The method is used to test whether a particular premise is true for data set or
population. It is also considered during data analysis and statistics to test the statistical
significance of the results. However, the method is faced with various errors, including
placebo and Hawthorne effects. Nevertheless, the technique is essential in data analysis and
decision making.
Importance of data analytics
i. Improve efficiency
The data collected and analyzed Calcutta Analytic reflects both internal and external
state of the business. Therefore, the interpretation of the data will help to measure the
performance of employees and the business as a whole.
ii. Market understanding
Calcutta Analytic uses an improved algorithm, which has enabled collection and
analysis of extensive data. The use of data from a variety of sources and people facilitate in
formulating a marketing strategy.
iii. Cost reduction
Big data technologies like cloud analytics and Hadoop used by Calcutta Analytic have
the advantage of low cost, especially when broad data is involved.
iv. Better decision-making
The consultant uses high-speed in-memory analytics and Hadoop as well as a variety
of data sources which enable instant data analysis. The process saves time, and hence,
decisions are made more efficiently and quickly.

Advanced Data Analytics 6
v. Understand the industry
The data collected, analyzed, and presented is useful in the understanding of the
industry. Thus, the business can decide for future operations.
v. Understand the industry
The data collected, analyzed, and presented is useful in the understanding of the
industry. Thus, the business can decide for future operations.
⊘ This is a preview!⊘
Do you want full access?
Subscribe today to unlock all pages.
Trusted by 1+ million students worldwide

Advanced Data Analytics 7
Bibliography
1. Patel, J. et al., "Predicting stock and stock price index movement using trend
deterministic data preparation and machine learning techniques." Expert Systems with
Applications vol. 42, no. 1, 2015, p. 259-268.
2. Nabieu, G, "Model Behavior Analysis of Stock Market Indicators and Listed
Companies: Evidence from the Ghana Stock Exchange: Automated versus Floor
Trading." International Journal of Business and Management 9, no. 11, (2014): 234.
Paraphrase This Document
Need a fresh take? Get an instant paraphrase of this document with our AI Paraphraser
Advanced Data Analytics 8
Guidebook
Evaluation of Analytical Models Data Preparation Processes
The use and creation of analytical models have become a common practice in data
analysis3. Analytical models are used to get a solution to the statistical problem using
mathematical calculations. That is, the results of the model are used to describe a certain
phenomenon in an organization that can be expressed as a mathematical analytic function4.
Analytical models have continued to evolve in a deeper understanding of mathematical use
and application of results. The methods of analytical modeling are not definite since data
scientists are not reducible to articulate rules. In the presence of extensive data, analytical
models are essential in simplifying the method for arriving at the research solution. In the
advent of big data, the data scientists are supposed to come up with models that will enable
them to analyze and interpret data sets. One of the commonly used analytical data modelings
is Cross Industrial Standard Process for Data Mining (CRISP-DM)5.
On the other hand, the data preparation process is all tasks that involve acquisition,
processing, and cleansing data6. Data preparation include “accessing, loading, structuring,
purging, unifying (joining), adjusting data types, checking fields to verify values and ensure
uniformity in data.” The data is used in the predictive analysis model, which help to improve
business effectiveness and success. The model uses a combination of data, statistics, and
3 R. Grossman and K. Siegel. "Organizational models for big data and analytics." Journal of Organization
Design vol. 3, no. 1, 2014, p. 20-25.
4 W. Lin et al., "Combining predictive models in predictive analytical modeling." U.S. Patent
8,370,280, issued February 5, 2013, p. 5.
5 U. Shafique and Q. Haseeb, "A comparative study of data mining process models (KDD, CRISP-DM and
SEMMA)." International Journal of Innovation and Scientific Research vol. 12, no. 1, 2014, p. 217-222.
6 S. Kwak and Jong Hae K, "Statistical data preparation: management of missing values and
outliers." Korean Journal of anesthesiology vol. 70, no. 4, 2017, p. 407.
Advanced Data Analytics 9
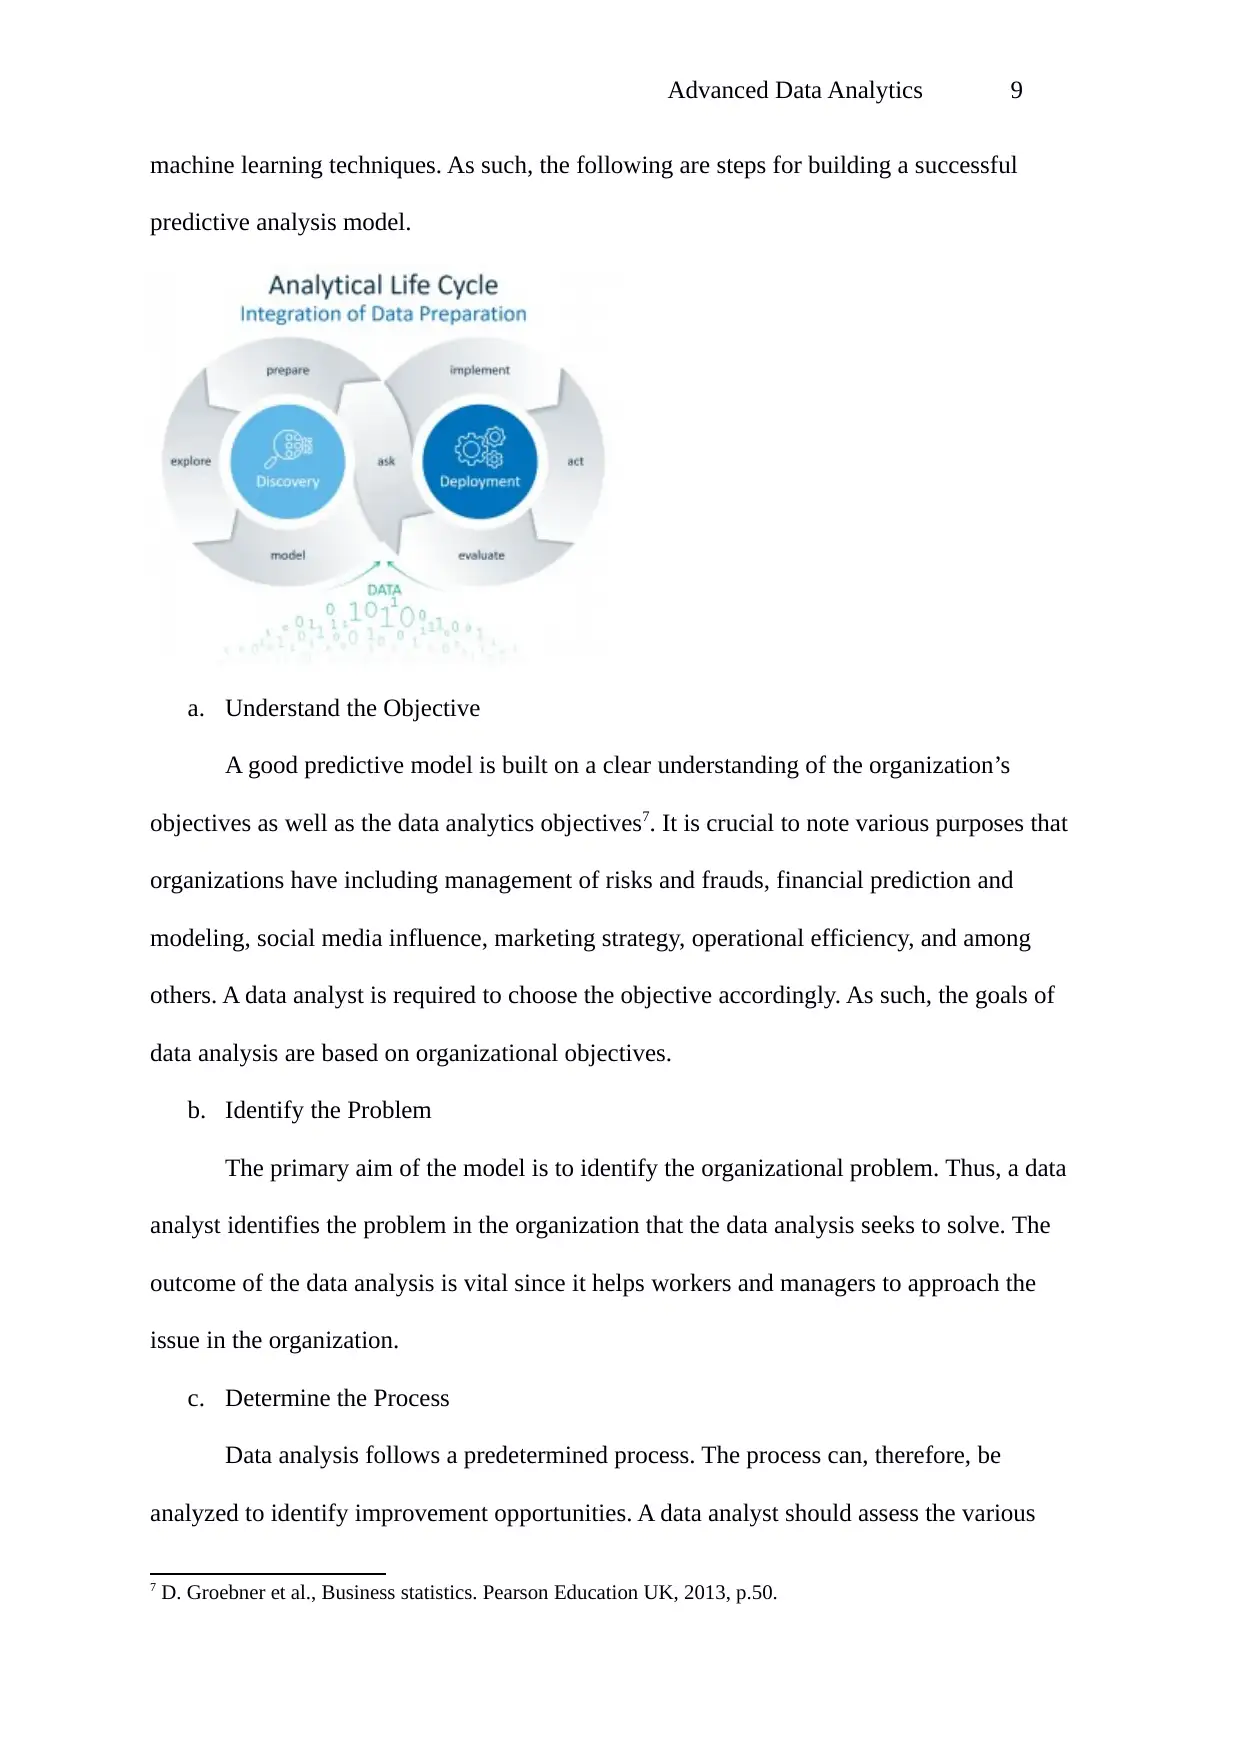
machine learning techniques. As such, the following are steps for building a successful
predictive analysis model.
a. Understand the Objective
A good predictive model is built on a clear understanding of the organization’s
objectives as well as the data analytics objectives7. It is crucial to note various purposes that
organizations have including management of risks and frauds, financial prediction and
modeling, social media influence, marketing strategy, operational efficiency, and among
others. A data analyst is required to choose the objective accordingly. As such, the goals of
data analysis are based on organizational objectives.
b. Identify the Problem
The primary aim of the model is to identify the organizational problem. Thus, a data
analyst identifies the problem in the organization that the data analysis seeks to solve. The
outcome of the data analysis is vital since it helps workers and managers to approach the
issue in the organization.
c. Determine the Process
Data analysis follows a predetermined process. The process can, therefore, be
analyzed to identify improvement opportunities. A data analyst should assess the various
7 D. Groebner et al., Business statistics. Pearson Education UK, 2013, p.50.
⊘ This is a preview!⊘
Do you want full access?
Subscribe today to unlock all pages.
Trusted by 1+ million students worldwide
Advanced Data Analytics 10
methods available choose one and make changes to implement the results of the model.
d. Identify Performance Metrics
Key performance indicators are essential to orient the organizational operations and
management to the targets8. A data scientist should identify right performance metrics that
can quantitatively measure organizational goals and give room for improvements in the
system. The parameter should also allow adjustments or adoption of a different approach in
case the action is taken fails to yield expected outcomes
e. Select and Prepare Data for Modeling
A data scientist needs to select data that are appropriate and align with a business
organization as well as target modeling. Thus, data selection requires a proper understanding
of the business objective and model to be used. A data analyst has three types of data to
choose for modeling, including psychographic, demographic, and behavioral variables. The
critical part in data preparation is analysis format to be used. As such, the model is trained
using past data to ensure the suitable format is used, and data clean-up is done correctly. As a
result, variables become well-defined, and multiple data sets merged.
f. Model Development Methodology
Model Development Methodology “is used to structure, plan, and control the process
of developing a system in an organization.” As a business consultant, there are various
development methodologies to adopt in data analytics such as “agile software development,
dynamic systems development model, feature-driven development, rapid application
development, systems development life cycle, etc.” The various approaches available are for
minimizing risks in modeling by the use of software in short iterations where the data
analysts can evaluate results.
g. Random Data Sampling
8 D. Parmenter, Key performance indicators: developing, implementing, and using winning KPIs. John Wiley &
Sons, 2015, p. 10.
Paraphrase This Document
Need a fresh take? Get an instant paraphrase of this document with our AI Paraphraser
Advanced Data Analytics 11
Data sampling is used to make selections, manipulations, and analysis of data subsets
to identify patterns and trends9. Traditionally, data are split into training and test sets.
Extensive data set is used to create the model while the remaining ones are used as test sets of
the results from the model. The process is used to create an executable model of outcomes in
a manner that is efficient and effective.
h. Data Management Program
Data management is critical in ensuring the success of the data preparation process. A
data analyst requires to implements a program for data governance, which assists in assuring
data analytics quality and consistency. A good data management program forms a foundation
for data management. Also, organizational management contributes to an effective and
efficient model performance.
i. Implementation of the Model
The model is implemented in the data analytics system after it has been developed and
validated. Model implementation in the system has several methods, including “account
management systems, decision-making systems, customer relationship management systems,
analytics platforms, collection systems, etc.”
j. Building and Deployment of the Model
A robust data analytics model is run on many algorithms. Several algorithms give
various possible outcomes from which the most efficient result is selected. After
development, the model needs to be deployed in data analytics and decision-making. There
are three methods of implementing a data analytics model, including model scoring,
integration in reporting, and integration in business operations10.
9 L. Palinkas et al., "Purposeful sampling for qualitative data collection and analysis in mixed method
implementation research." Administration and policy in mental health and mental health services research vol.
42, no. 5, 2015, p. 533-544.
10 S. Sagiroglu and D. Sinanc, "Big data: A review." In 2013 International Conference on Collaboration
Advanced Data Analytics 12
Issues in Data Presentation
Businesses want to create value by adopting data modeling and curation practices.
However, to achieve efficiency in data analytics, data analysts should consider several
challenges for making the modeling process work effectively. The most significant problem is
creating a correlation of data with real-world and integrates it with business processes and
analytics software. Other issues include data curation and modeling across disparate sources
and data stores.
i. Ensuring data quality
Ensuring data quality is a challenge mainly owing to extensive data that require
additional effort11. Traditionally, the data quality assurance involves hand-coded business
logic, which is challenging to maintain and scale. Automated data cleaning and preparation is
an investment in data engineering that is expensive. The process can be impeded if the
managers fail a better understanding of the project value.
ii. Identifying contributors to dirty data
Data accuracy needs to be assured onset at the source. If the modeling is based on
inaccurate data, it will give wrong results and decisions and will crumbles12. Data inaccuracy
occurs at the time of collection and acquisition or during cleaning. Therefore, if the business
decision is made based on wrong data, it could result in severe repercussions to the business.
iii. Enabling fitness for purpose
The data prepared for analysis need to be correct and trustworthy for the intended use
Technologies and Systems (CTS), IEEE, 2013, p. 42-47.
11 N. Anney, "Ensuring the quality of the findings of qualitative research: Looking at trustworthiness criteria."
Journal of Emerging Trends in Educational Research and Policy Studies (JETERAPS) vol. 5, no. 2, 2014, p.
272-281.
12 J. Wang et al., "A sample-and-clean framework for fast and accurate query processing on dirty data." In
Proceedings of the 2014 ACM SIGMOD international conference on Management of data, ACM, 2014, p. 469-
480.
⊘ This is a preview!⊘
Do you want full access?
Subscribe today to unlock all pages.
Trusted by 1+ million students worldwide
1 out of 20
Related Documents


Your All-in-One AI-Powered Toolkit for Academic Success.
+13062052269
info@desklib.com
Available 24*7 on WhatsApp / Email
![[object Object]](/_next/static/media/star-bottom.7253800d.svg)
Unlock your academic potential
Copyright © 2020–2026 A2Z Services. All Rights Reserved. Developed and managed by ZUCOL.