Advanced Economics Assignment: Market Analysis, BUS105, Semester 1
VerifiedAdded on 2022/10/13
|12
|2161
|7
Homework Assignment
AI Summary
This Advanced Economics assignment analyzes the impact of events in the Middle East on the Australian petrol and passenger car markets, illustrating these effects with supply and demand diagrams. It further examines the influence of electric vehicles and government policies encouraging higher education on the economy, utilizing the production possibility frontier model to demonstrate shifts in output. The assignment also explores factors influencing long-run economic growth, including capital accumulation, labor productivity, and technological innovation, and assesses the effects of sales taxes on cigarette and coffee markets. Finally, it discusses the oligopoly market structure of Australian retail giants, Coles and Woolworths, highlighting market characteristics and competition within the industry.
Running head: ADVANCED ECONOMICS
ADVANCED ECONOMICS
Name of the Student
Name of the University
Author Note
Course ID:
ADVANCED ECONOMICS
Name of the Student
Name of the University
Author Note
Course ID:
Paraphrase This Document
Need a fresh take? Get an instant paraphrase of this document with our AI Paraphraser
1ADVANCED ECONOMICS
Table of Contents
Answer to Question 1(a)............................................................................................................2
Answer to Question 1(b)............................................................................................................3
Answer to Question 2(a)............................................................................................................4
Answer to question 2(b).............................................................................................................6
Answer to Question 3(a)............................................................................................................6
Answer to Question 3(b)............................................................................................................8
Reference..................................................................................................................................10
2ADVANCED ECONOMICS
S1
S
D
P1
P
Q1
E1
Q
E
Price
Quantity
D
S1
S
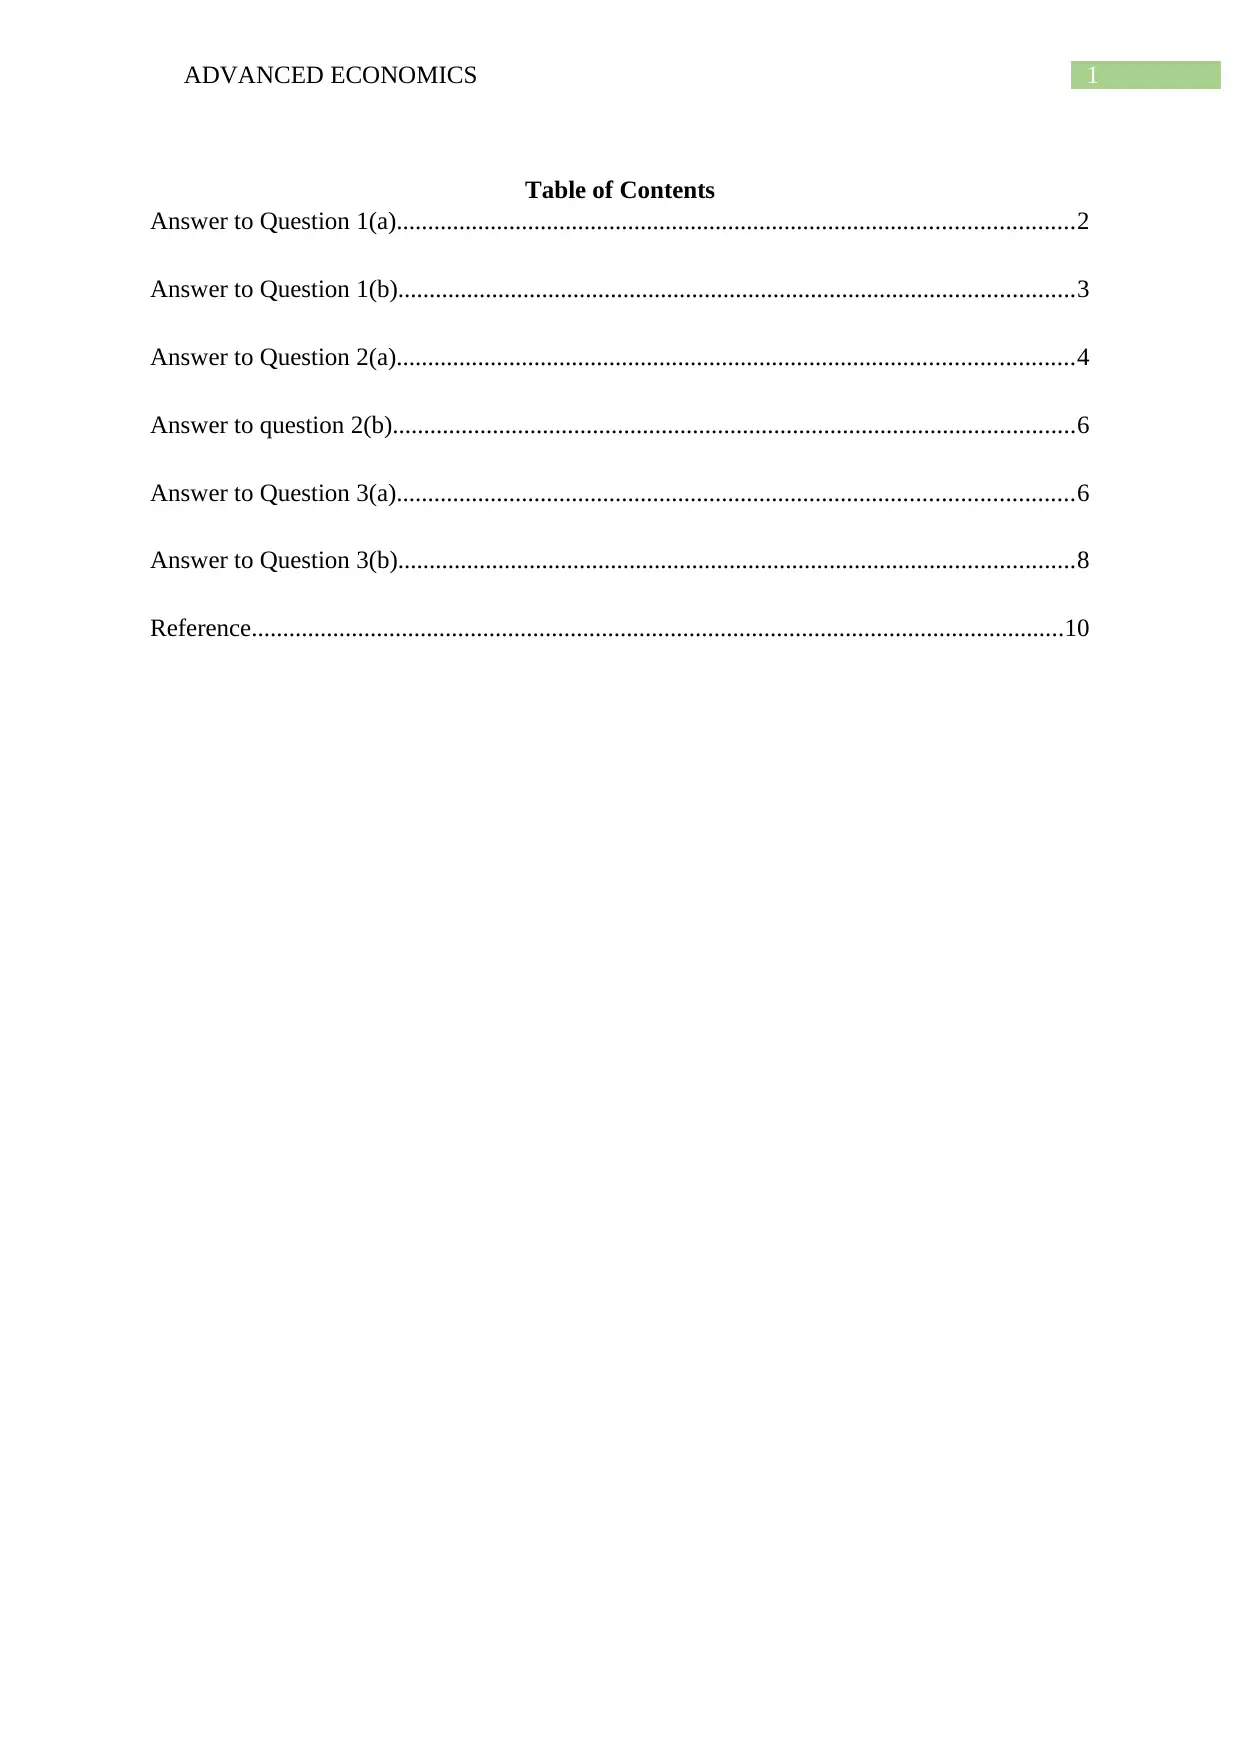
Answer to Question 1
(a)
Recently, the tension caused in Saudi Arabia because of the Iran attack may have an
impact on petrol as well as passenger petrol cars market in Australia. Due to the attack, the
petrol price is rising all over the world (Economictimes.com 2019). The impact has clearly
illustrated in the diagram below:
In the case of the petrol market in Australia
Figure 1: Impact of petrol prices in the Australian market
(Source: Goodwin et al. 2015)
The above diagram shows the effect of the rise in petrol price in the market in
Australia. The actual supply anddemand curve was SS and DD, respectively. The vertical and
horizontal line measures the price and quantity. The original price was at P. The equilibrium
was at E.Now, the cost of petrol increased to P1. The market now wants to adjust and obtain
S1
S
D
P1
P
Q1
E1
Q
E
Price
Quantity
D
S1
S
Answer to Question 1
(a)
Recently, the tension caused in Saudi Arabia because of the Iran attack may have an
impact on petrol as well as passenger petrol cars market in Australia. Due to the attack, the
petrol price is rising all over the world (Economictimes.com 2019). The impact has clearly
illustrated in the diagram below:
In the case of the petrol market in Australia
Figure 1: Impact of petrol prices in the Australian market
(Source: Goodwin et al. 2015)
The above diagram shows the effect of the rise in petrol price in the market in
Australia. The actual supply anddemand curve was SS and DD, respectively. The vertical and
horizontal line measures the price and quantity. The original price was at P. The equilibrium
was at E.Now, the cost of petrol increased to P1. The market now wants to adjust and obtain
⊘ This is a preview!⊘
Do you want full access?
Subscribe today to unlock all pages.
Trusted by 1+ million students worldwide
3ADVANCED ECONOMICS
D1
S
D
P1
P
Q1
E1
Q
E
Price
Quantity
D
D1
S
equilibrium. Consequently, the supply curve moves to the left, thus the quantity supply falls
from Q to Q1.
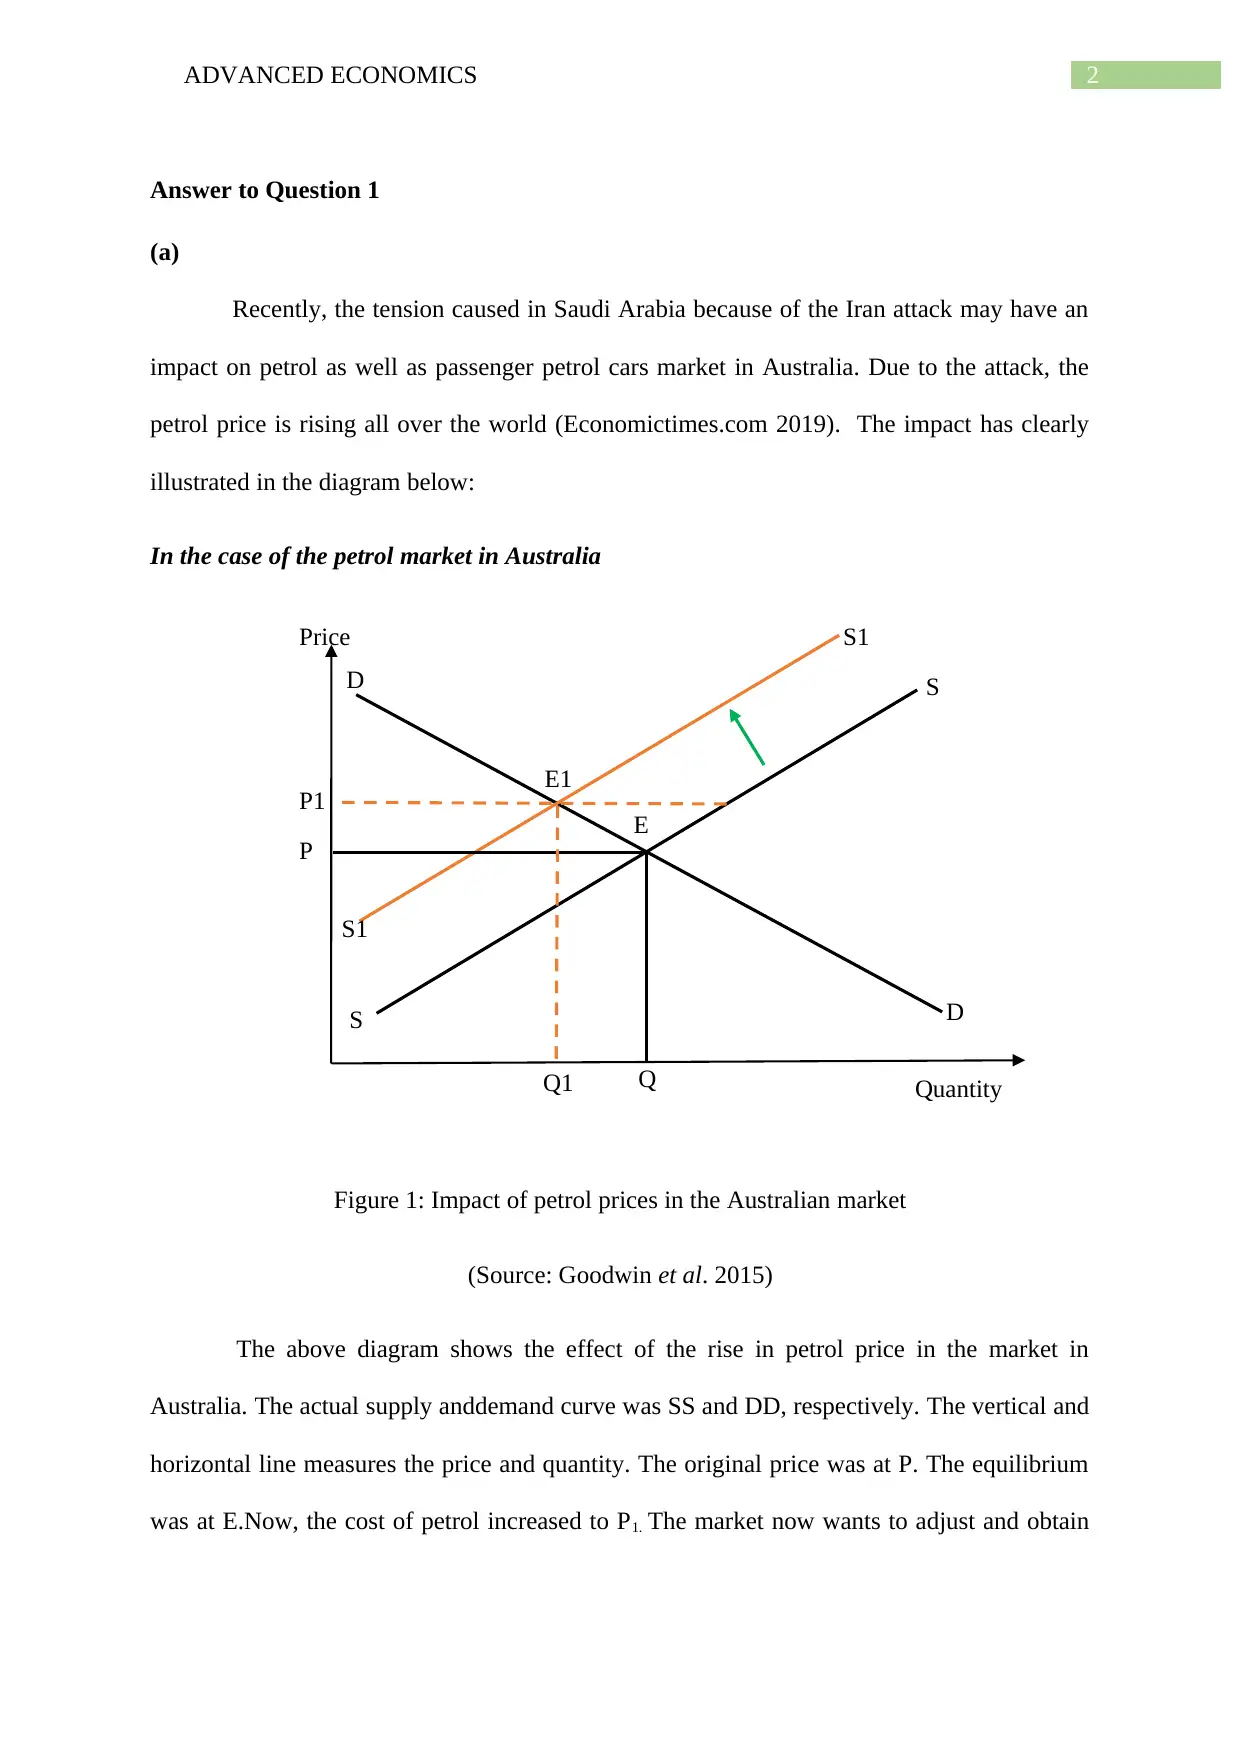
In case of passenger petrol cars market in Australia
In this case, the demand of the people for passenger cars may decrease the petrol
price in future. With the help of the graphical model, the effect is presented below:
Figure 2: Change in demand in the Australian passenger cars market
(Source: Goodwin et al. 2015)
In this figure, the price effect is studied. The people of Australia will continue to
demand a passenger car; therefore, the demand curve moves to the left to D1D1. Again, the
marketplace will want to attain equilibrium; therefore, the price of petrol will fall. Thus, the
new equilibrium quantity will be at Q1 when the original equilibrium price is at P1.
(b)
Australia recently is selling more vehicles that are electric and the government there
has predicted that by 2035, the sale of electric cars will rise by 50 per cent. Iran currently the
D1
S
D
P1
P
Q1
E1
Q
E
Price
Quantity
D
D1
S
equilibrium. Consequently, the supply curve moves to the left, thus the quantity supply falls
from Q to Q1.
In case of passenger petrol cars market in Australia
In this case, the demand of the people for passenger cars may decrease the petrol
price in future. With the help of the graphical model, the effect is presented below:
Figure 2: Change in demand in the Australian passenger cars market
(Source: Goodwin et al. 2015)
In this figure, the price effect is studied. The people of Australia will continue to
demand a passenger car; therefore, the demand curve moves to the left to D1D1. Again, the
marketplace will want to attain equilibrium; therefore, the price of petrol will fall. Thus, the
new equilibrium quantity will be at Q1 when the original equilibrium price is at P1.
(b)
Australia recently is selling more vehicles that are electric and the government there
has predicted that by 2035, the sale of electric cars will rise by 50 per cent. Iran currently the
Paraphrase This Document
Need a fresh take? Get an instant paraphrase of this document with our AI Paraphraser
4ADVANCED ECONOMICS
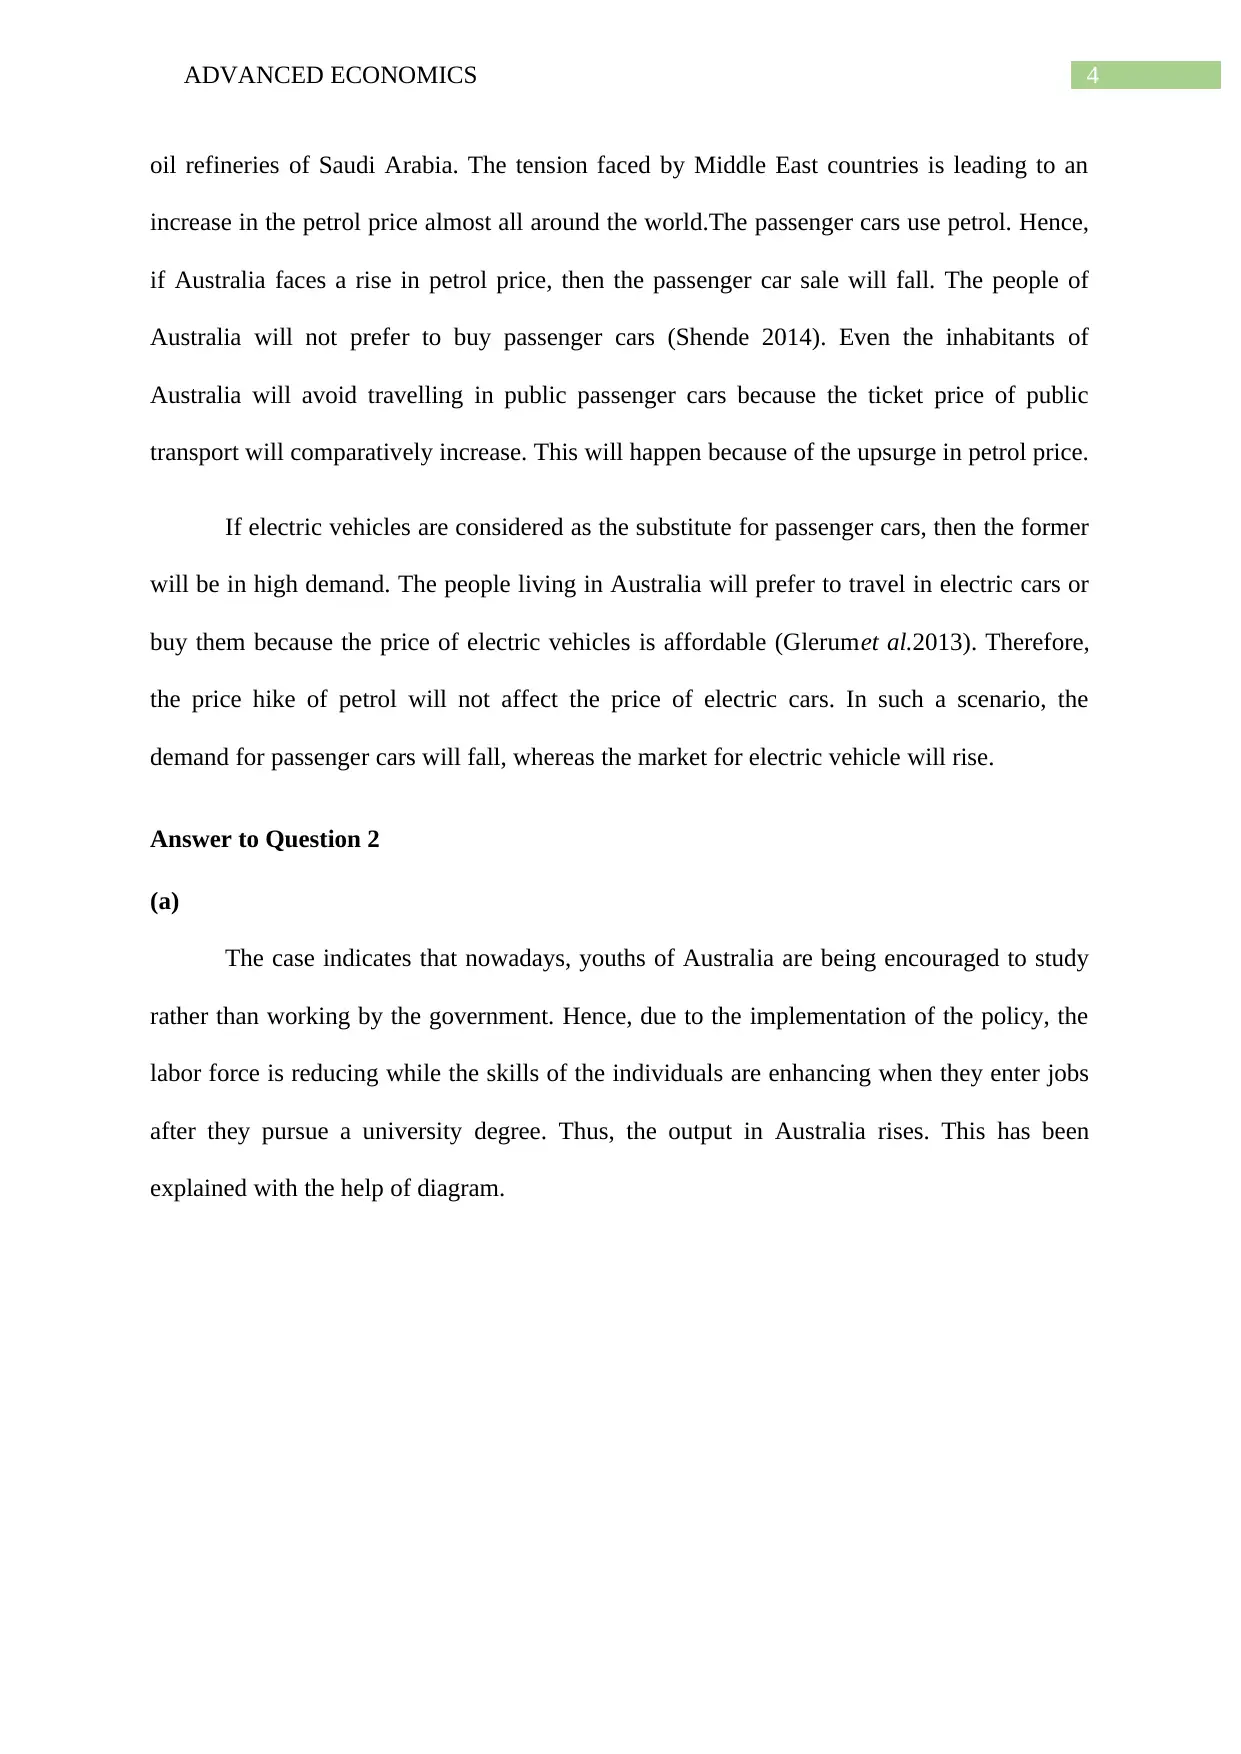
oil refineries of Saudi Arabia. The tension faced by Middle East countries is leading to an
increase in the petrol price almost all around the world.The passenger cars use petrol. Hence,
if Australia faces a rise in petrol price, then the passenger car sale will fall. The people of
Australia will not prefer to buy passenger cars (Shende 2014). Even the inhabitants of
Australia will avoid travelling in public passenger cars because the ticket price of public
transport will comparatively increase. This will happen because of the upsurge in petrol price.
If electric vehicles are considered as the substitute for passenger cars, then the former
will be in high demand. The people living in Australia will prefer to travel in electric cars or
buy them because the price of electric vehicles is affordable (Glerumet al.2013). Therefore,
the price hike of petrol will not affect the price of electric cars. In such a scenario, the
demand for passenger cars will fall, whereas the market for electric vehicle will rise.
Answer to Question 2
(a)
The case indicates that nowadays, youths of Australia are being encouraged to study
rather than working by the government. Hence, due to the implementation of the policy, the
labor force is reducing while the skills of the individuals are enhancing when they enter jobs
after they pursue a university degree. Thus, the output in Australia rises. This has been
explained with the help of diagram.
5ADVANCED ECONOMICS
Education Level
E
E1
PPF1 Labor force
PPF1
PPF
LL1 PPF
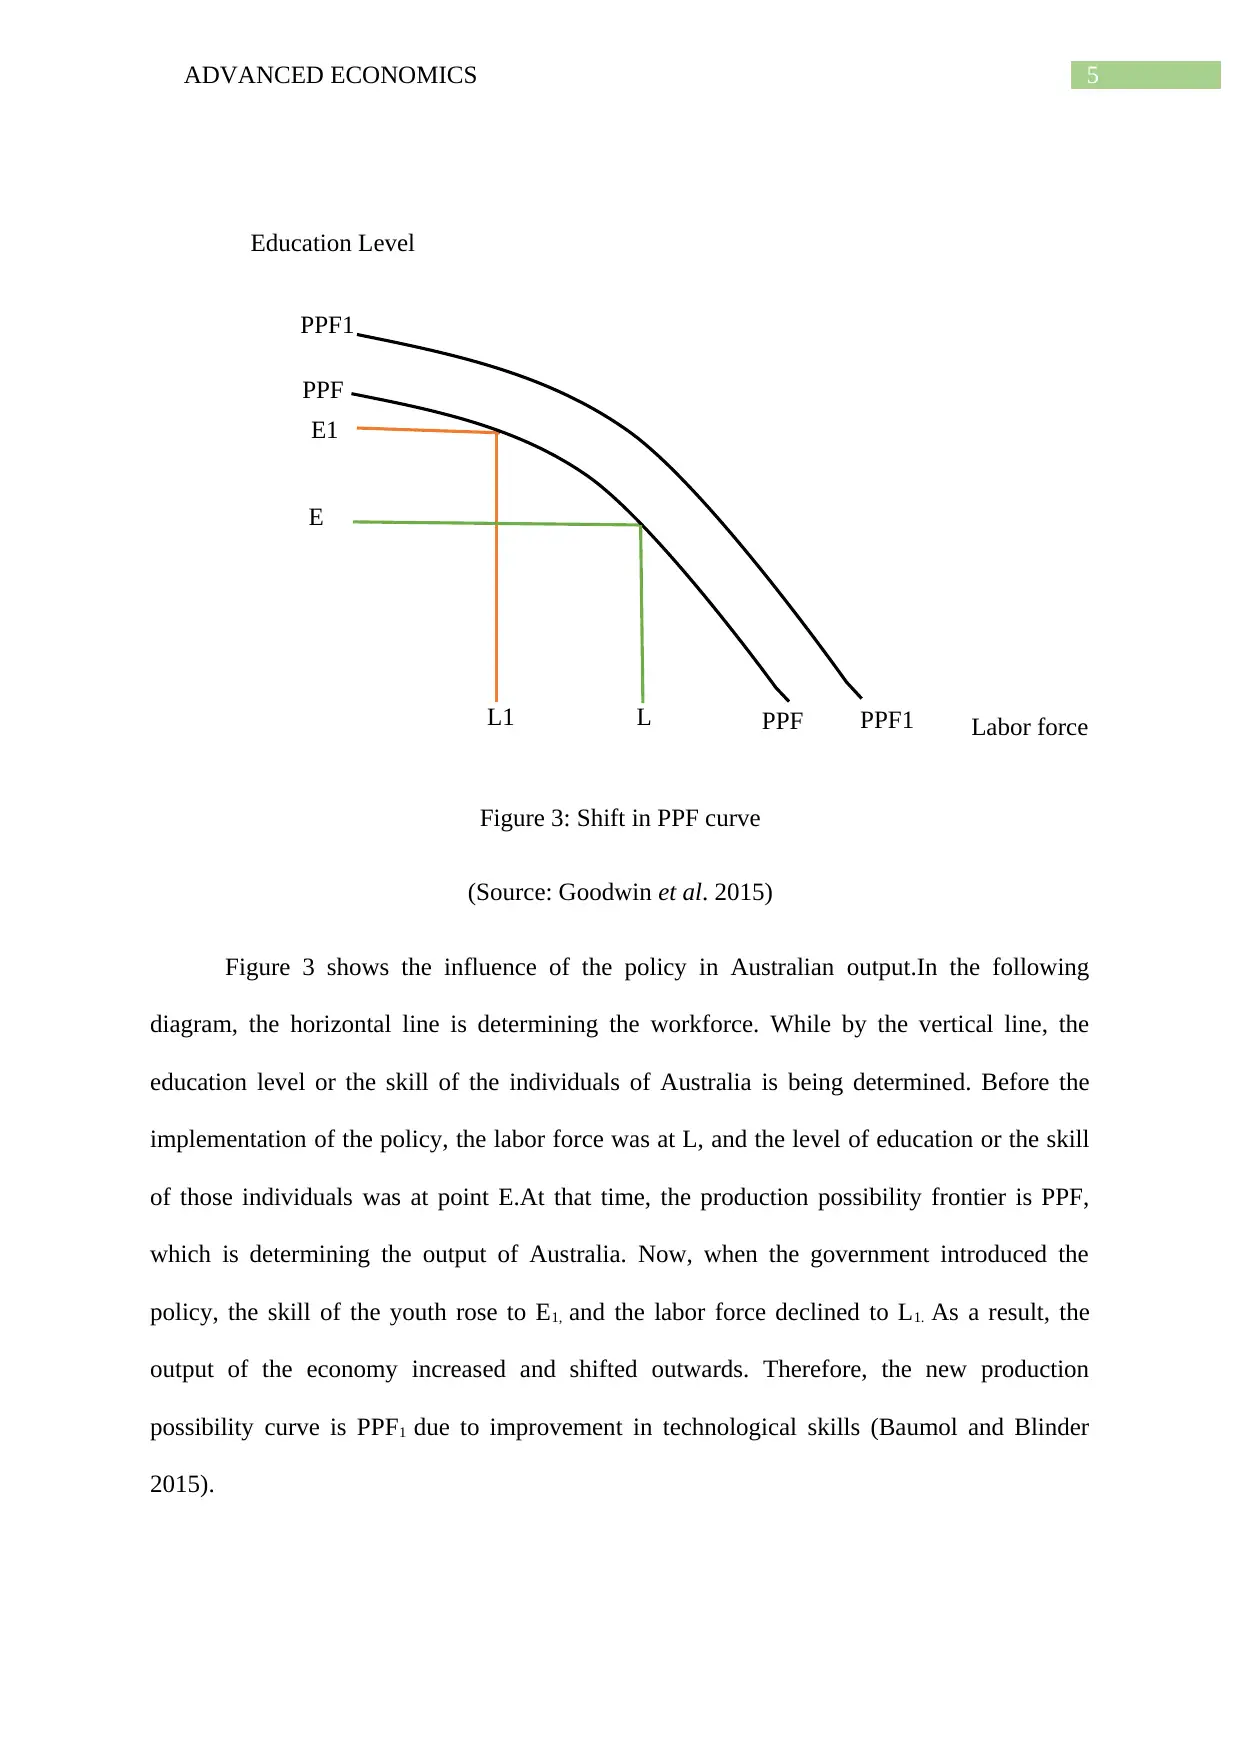
Figure 3: Shift in PPF curve
(Source: Goodwin et al. 2015)
Figure 3 shows the influence of the policy in Australian output.In the following
diagram, the horizontal line is determining the workforce. While by the vertical line, the
education level or the skill of the individuals of Australia is being determined. Before the
implementation of the policy, the labor force was at L, and the level of education or the skill
of those individuals was at point E.At that time, the production possibility frontier is PPF,
which is determining the output of Australia. Now, when the government introduced the
policy, the skill of the youth rose to E1, and the labor force declined to L1. As a result, the
output of the economy increased and shifted outwards. Therefore, the new production
possibility curve is PPF1 due to improvement in technological skills (Baumol and Blinder
2015).
Education Level
E
E1
PPF1 Labor force
PPF1
PPF
LL1 PPF
Figure 3: Shift in PPF curve
(Source: Goodwin et al. 2015)
Figure 3 shows the influence of the policy in Australian output.In the following
diagram, the horizontal line is determining the workforce. While by the vertical line, the
education level or the skill of the individuals of Australia is being determined. Before the
implementation of the policy, the labor force was at L, and the level of education or the skill
of those individuals was at point E.At that time, the production possibility frontier is PPF,
which is determining the output of Australia. Now, when the government introduced the
policy, the skill of the youth rose to E1, and the labor force declined to L1. As a result, the
output of the economy increased and shifted outwards. Therefore, the new production
possibility curve is PPF1 due to improvement in technological skills (Baumol and Blinder
2015).
⊘ This is a preview!⊘
Do you want full access?
Subscribe today to unlock all pages.
Trusted by 1+ million students worldwide
6ADVANCED ECONOMICS
(b)
The mentioned question, the answer will deal with the three significant indicators,
which indicates the economic growth in the long-run. The three factors are capital
accumulation, labor productivity and innovation to technology.
Capital Accumulation-Addition of capital happens when an economy's assets rise because of
an increase in profit and investment (Becker 2017). Therefore, this leads to worker’s
productivity as well as the production of the goods. Hence, the country faces economic
growth.
Labor Productivity-When the worker is working in the country becomes more efficient; it
leads to more productivity. From the practical and theoretical aspects, it states that when there
is more productivity of labor, then the more growth in the economy is seen (Pelinescu 2015).
Innovation to technology- The advancement of technology means that change made to
improve productivity. This helps in producing more amount of output with the same or fewer
resources. Hence, the country can notice growth in their economy.
According to Rodrik (2014), if a government introduce monetary as well as fiscal
policy, then the plan will help to accumulate more capital, increase the productivity of labor
and brings innovation to the technology, which will bring a change in economic growth. For
example, in the previous case, the Australian government has introduced a new policy that
the youth of the country is encouraged to pursue higher studies so that their skill improves
when they join new jobs. As a result, when they enter the job after achieving the degree from
the university, at that time, the worker’s productivity was found to be increasing as well as
the enhancement of technology was seen. Therefore, the economic growth of Australia is
rising.
Paraphrase This Document
Need a fresh take? Get an instant paraphrase of this document with our AI Paraphraser
7ADVANCED ECONOMICS
Consumer Tax Burden
S
D
Pc
P
Qp Q
E
Price
Quantity
D
Sales tax
S
Pp
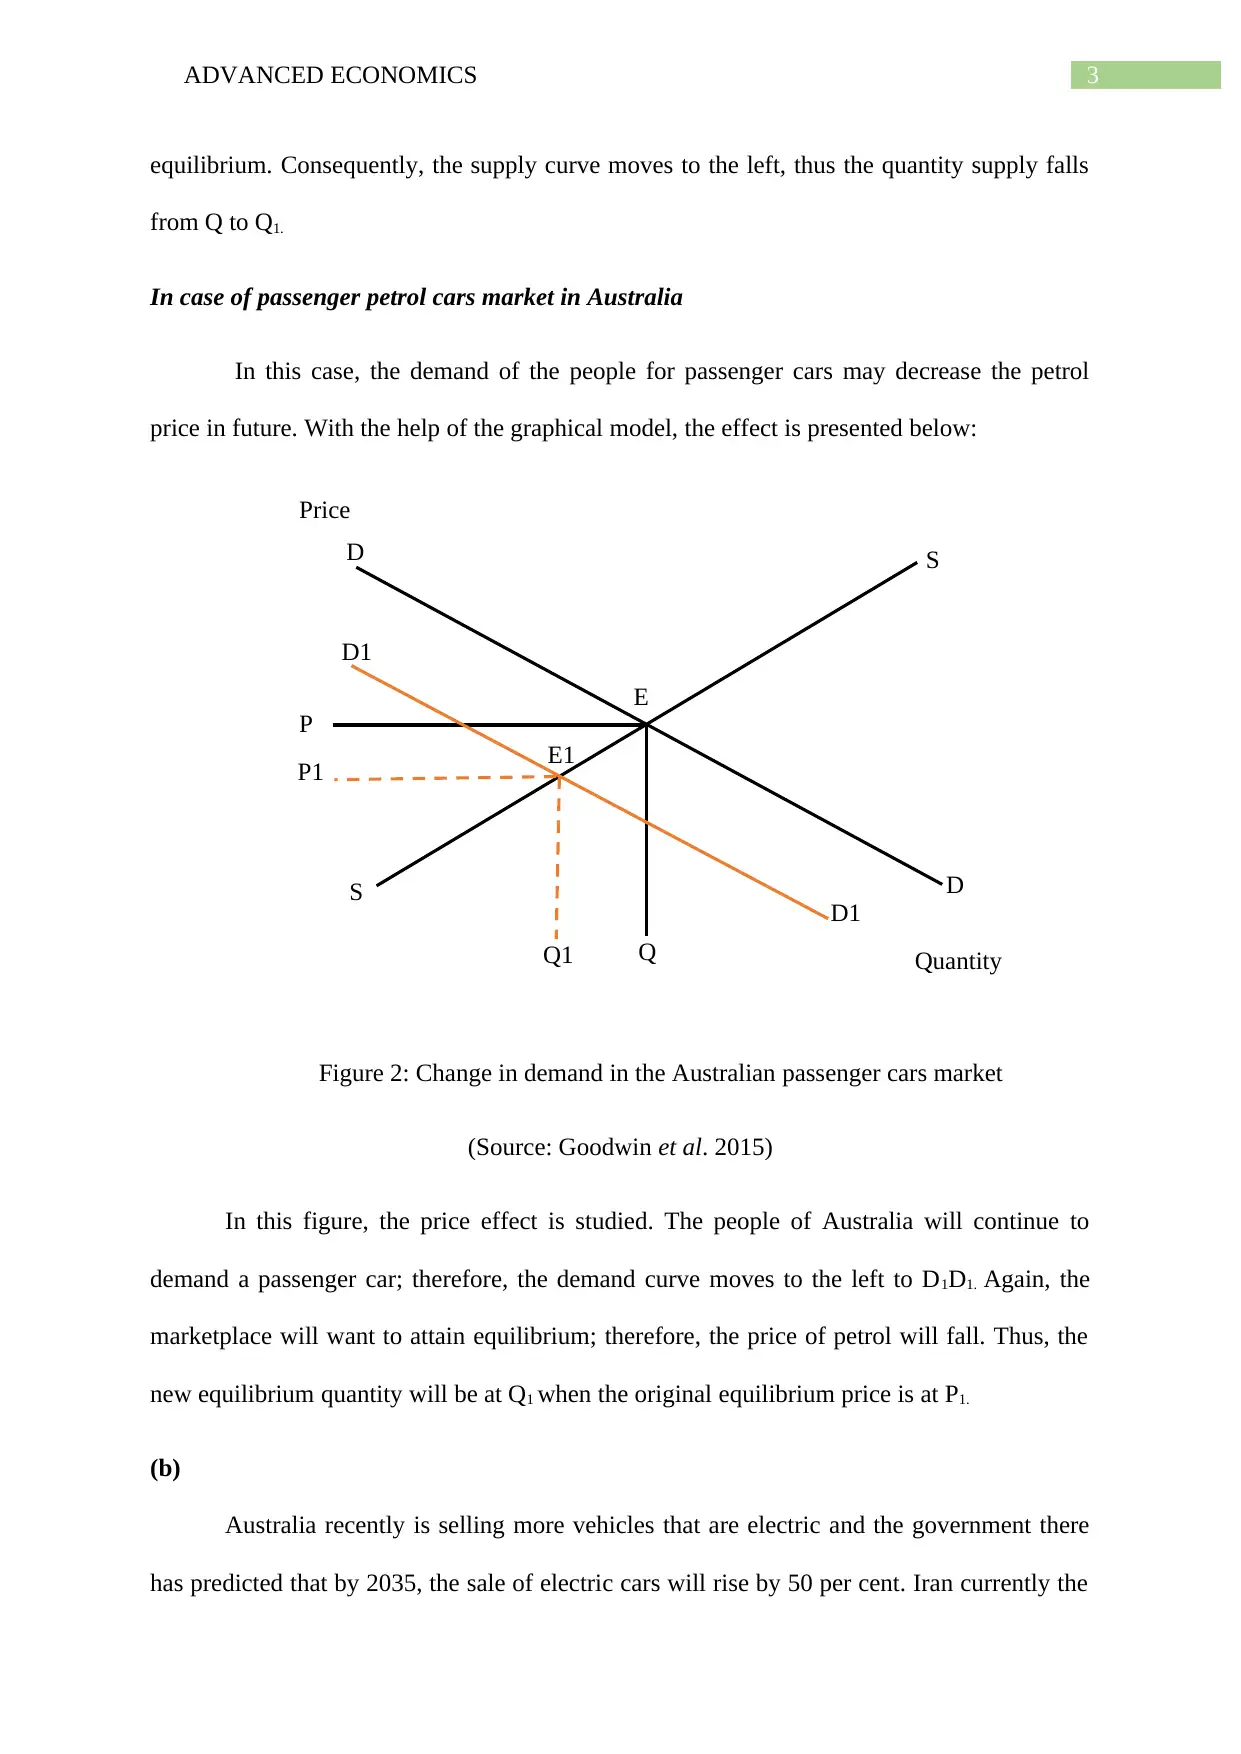
Answer to Question 3(a)
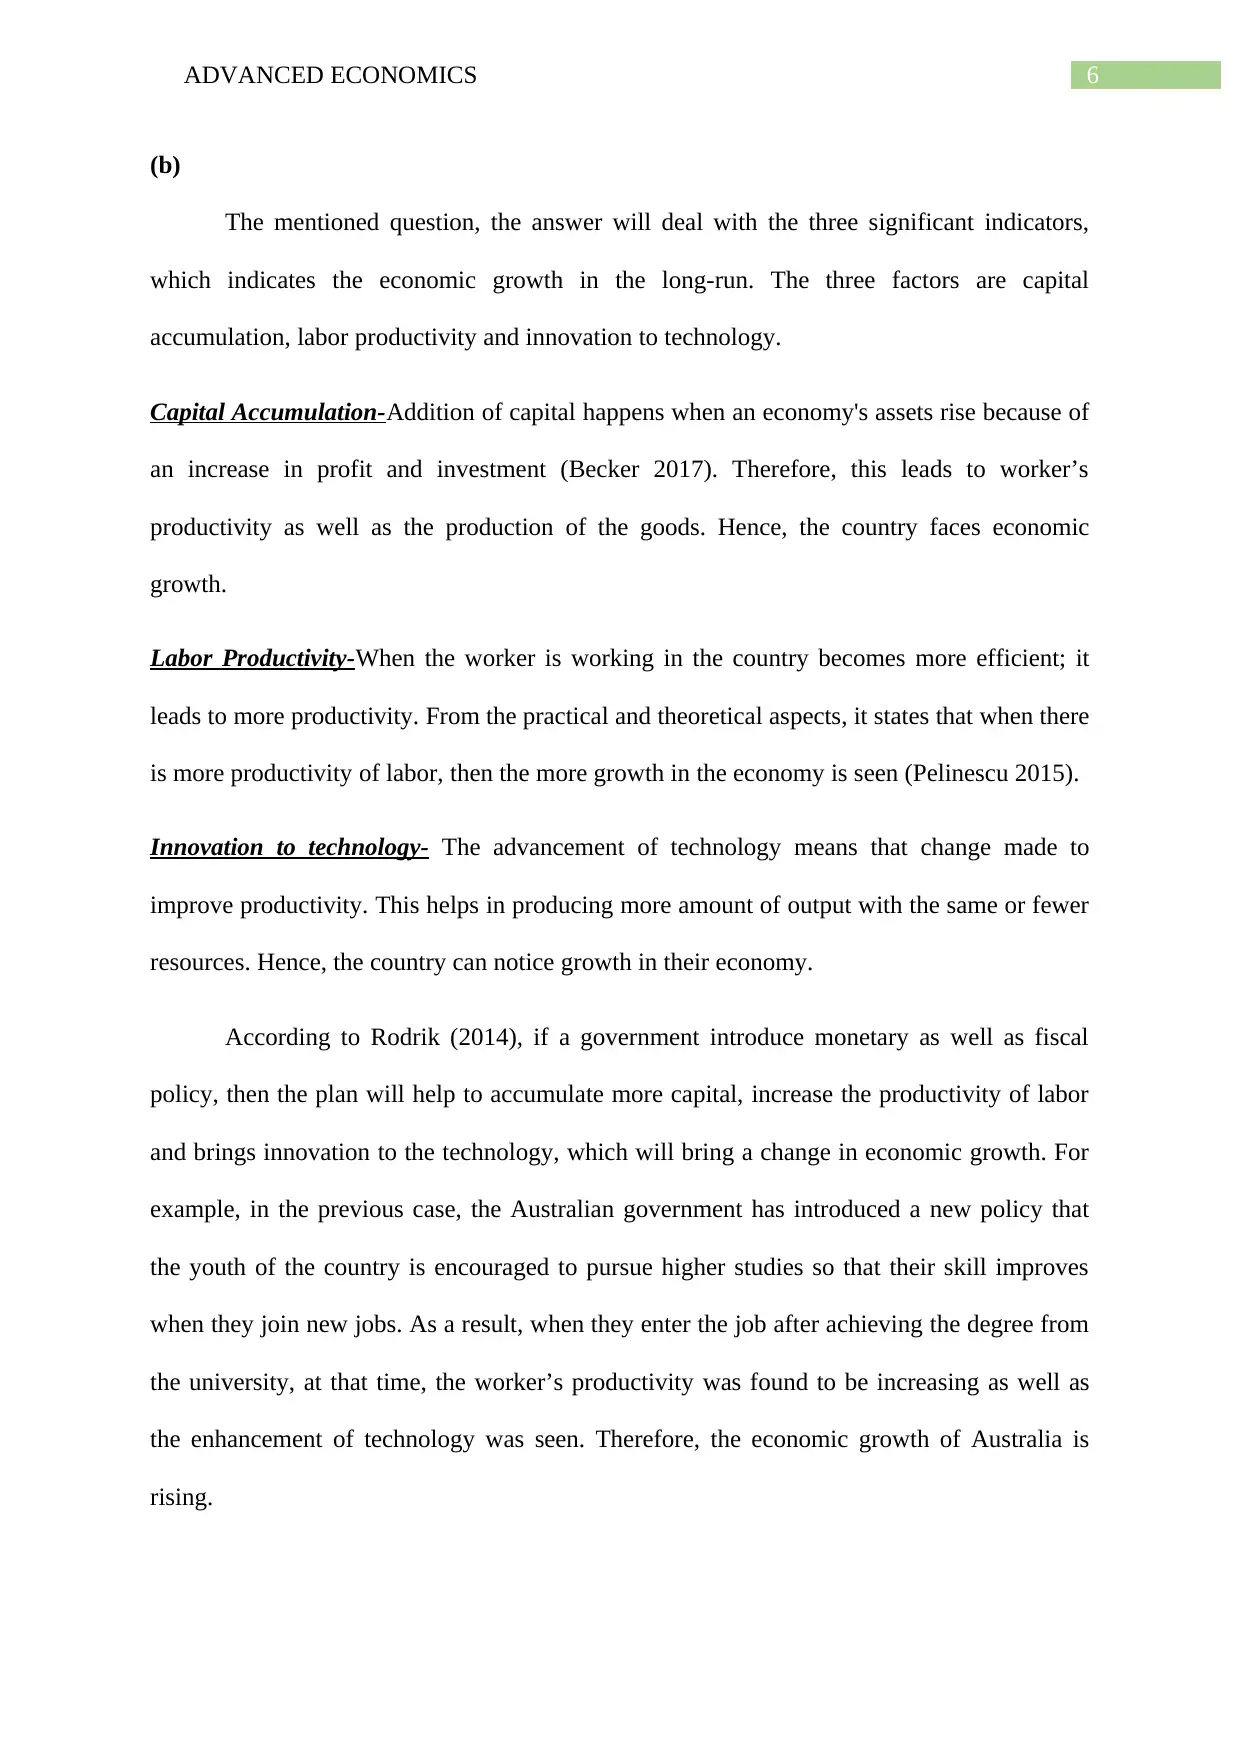
The cigarette demand is known to be inelastic that means that the demand of the
consumers for this product remains the same even if the price of the cigarette rises. Now, on
all the brands of the cigarette if the government starts to impose a sales tax. Generally, both
produceras well as consumer endures the burden of the tax. However, the consumer, in this
case, bears the tax burden more than the producer does because the demand is more inelastic
than supply, which means that the change in cigarette price does not have any impact on the
consumer’s demand (DeCicca, Kenkel and Liu 2013).
Now, suppose the tax is imposed on the product, coffee. As known, demand for coffee is
elastic. Therefore, the producer bears the tax burden more than the consumer does because a
minimal price rise of coffee can lead to a massive fall in demand. The reason behind it is that
the consumer who used to buy coffee will now buy tea, as they are a substitute for each other.
Both the cases are explained with the help of the diagram below:
Figure 4: Tax imposition on cigarette
Consumer Tax Burden
S
D
Pc
P
Qp Q
E
Price
Quantity
D
Sales tax
S
Pp
Answer to Question 3(a)
The cigarette demand is known to be inelastic that means that the demand of the
consumers for this product remains the same even if the price of the cigarette rises. Now, on
all the brands of the cigarette if the government starts to impose a sales tax. Generally, both
produceras well as consumer endures the burden of the tax. However, the consumer, in this
case, bears the tax burden more than the producer does because the demand is more inelastic
than supply, which means that the change in cigarette price does not have any impact on the
consumer’s demand (DeCicca, Kenkel and Liu 2013).
Now, suppose the tax is imposed on the product, coffee. As known, demand for coffee is
elastic. Therefore, the producer bears the tax burden more than the consumer does because a
minimal price rise of coffee can lead to a massive fall in demand. The reason behind it is that
the consumer who used to buy coffee will now buy tea, as they are a substitute for each other.
Both the cases are explained with the help of the diagram below:
Figure 4: Tax imposition on cigarette
8ADVANCED ECONOMICS
ProducerTax Burden
S
D
Pc
P
Qp Q
E
Price
Quantity
D
Sales tax
S
Pp
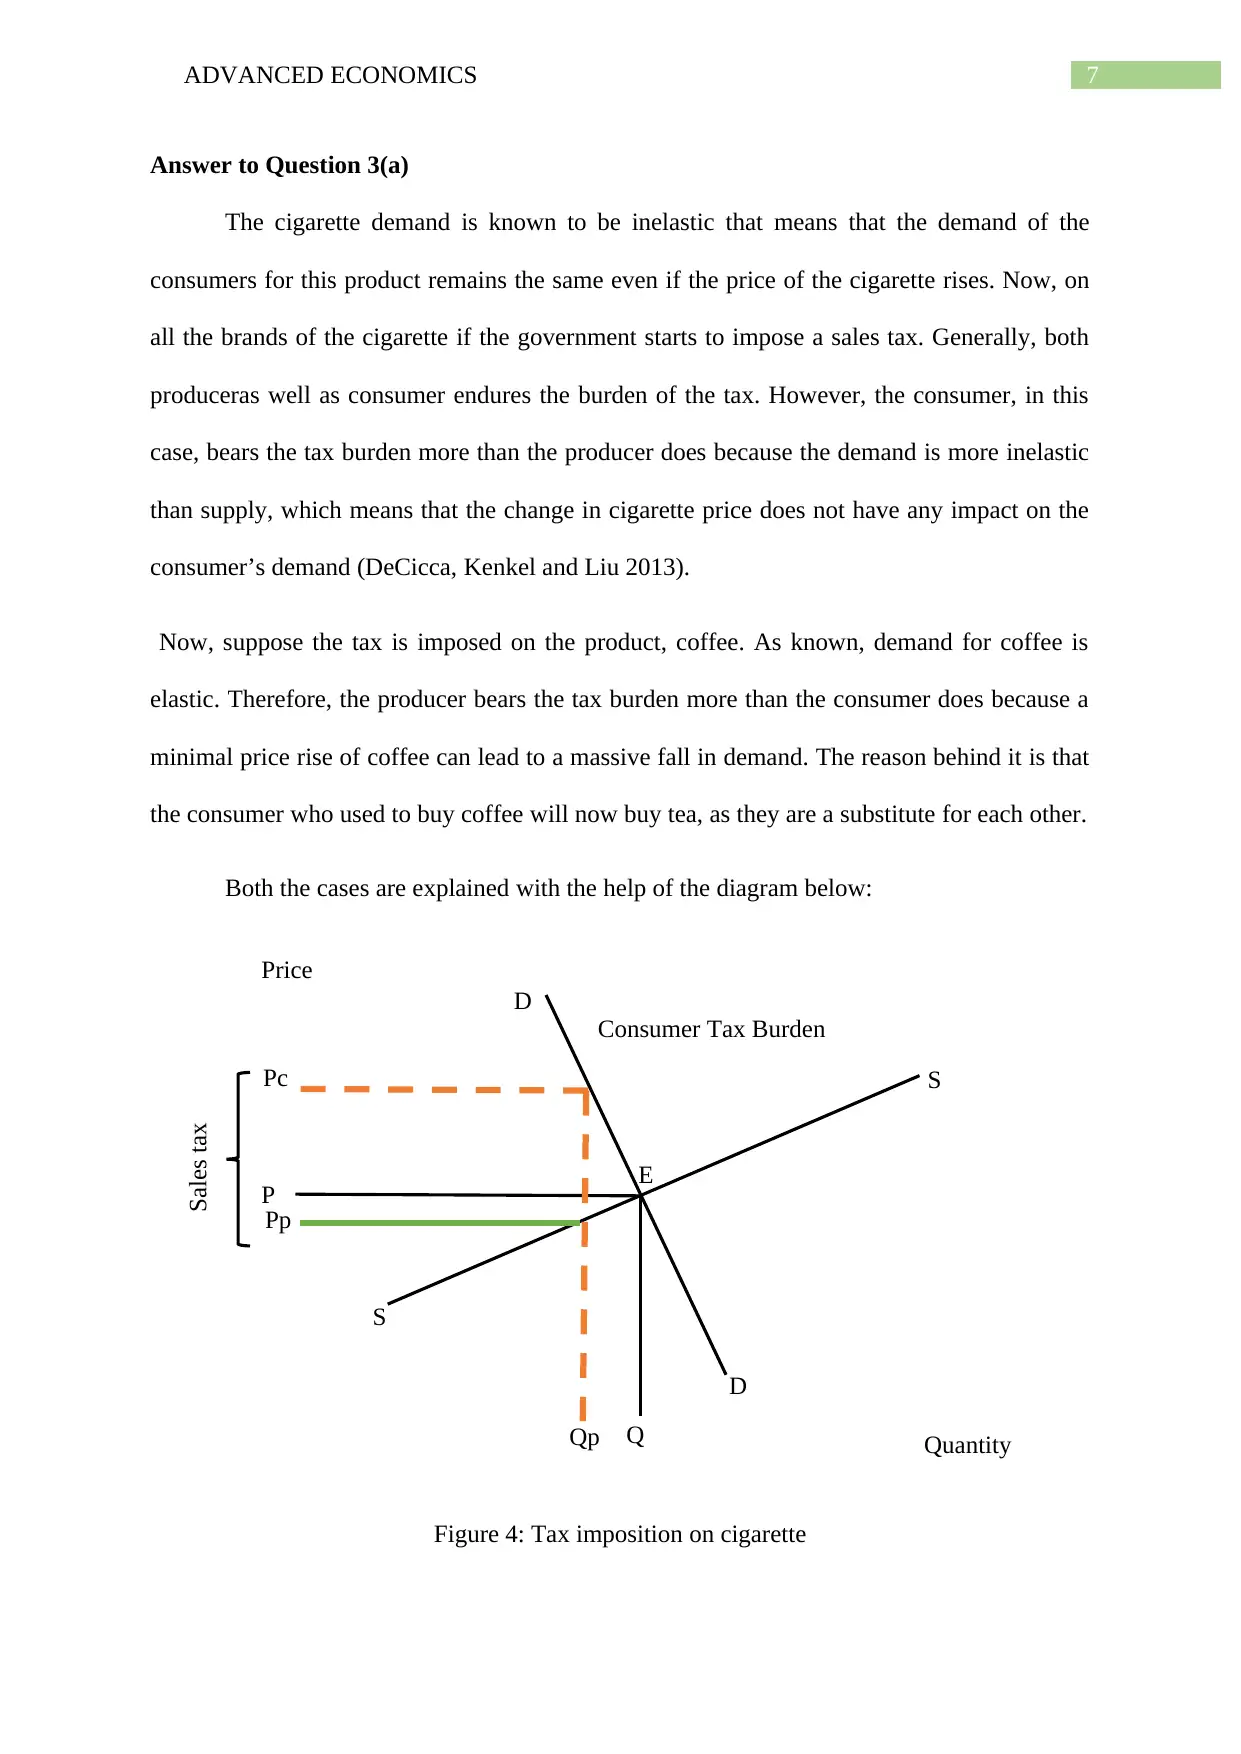
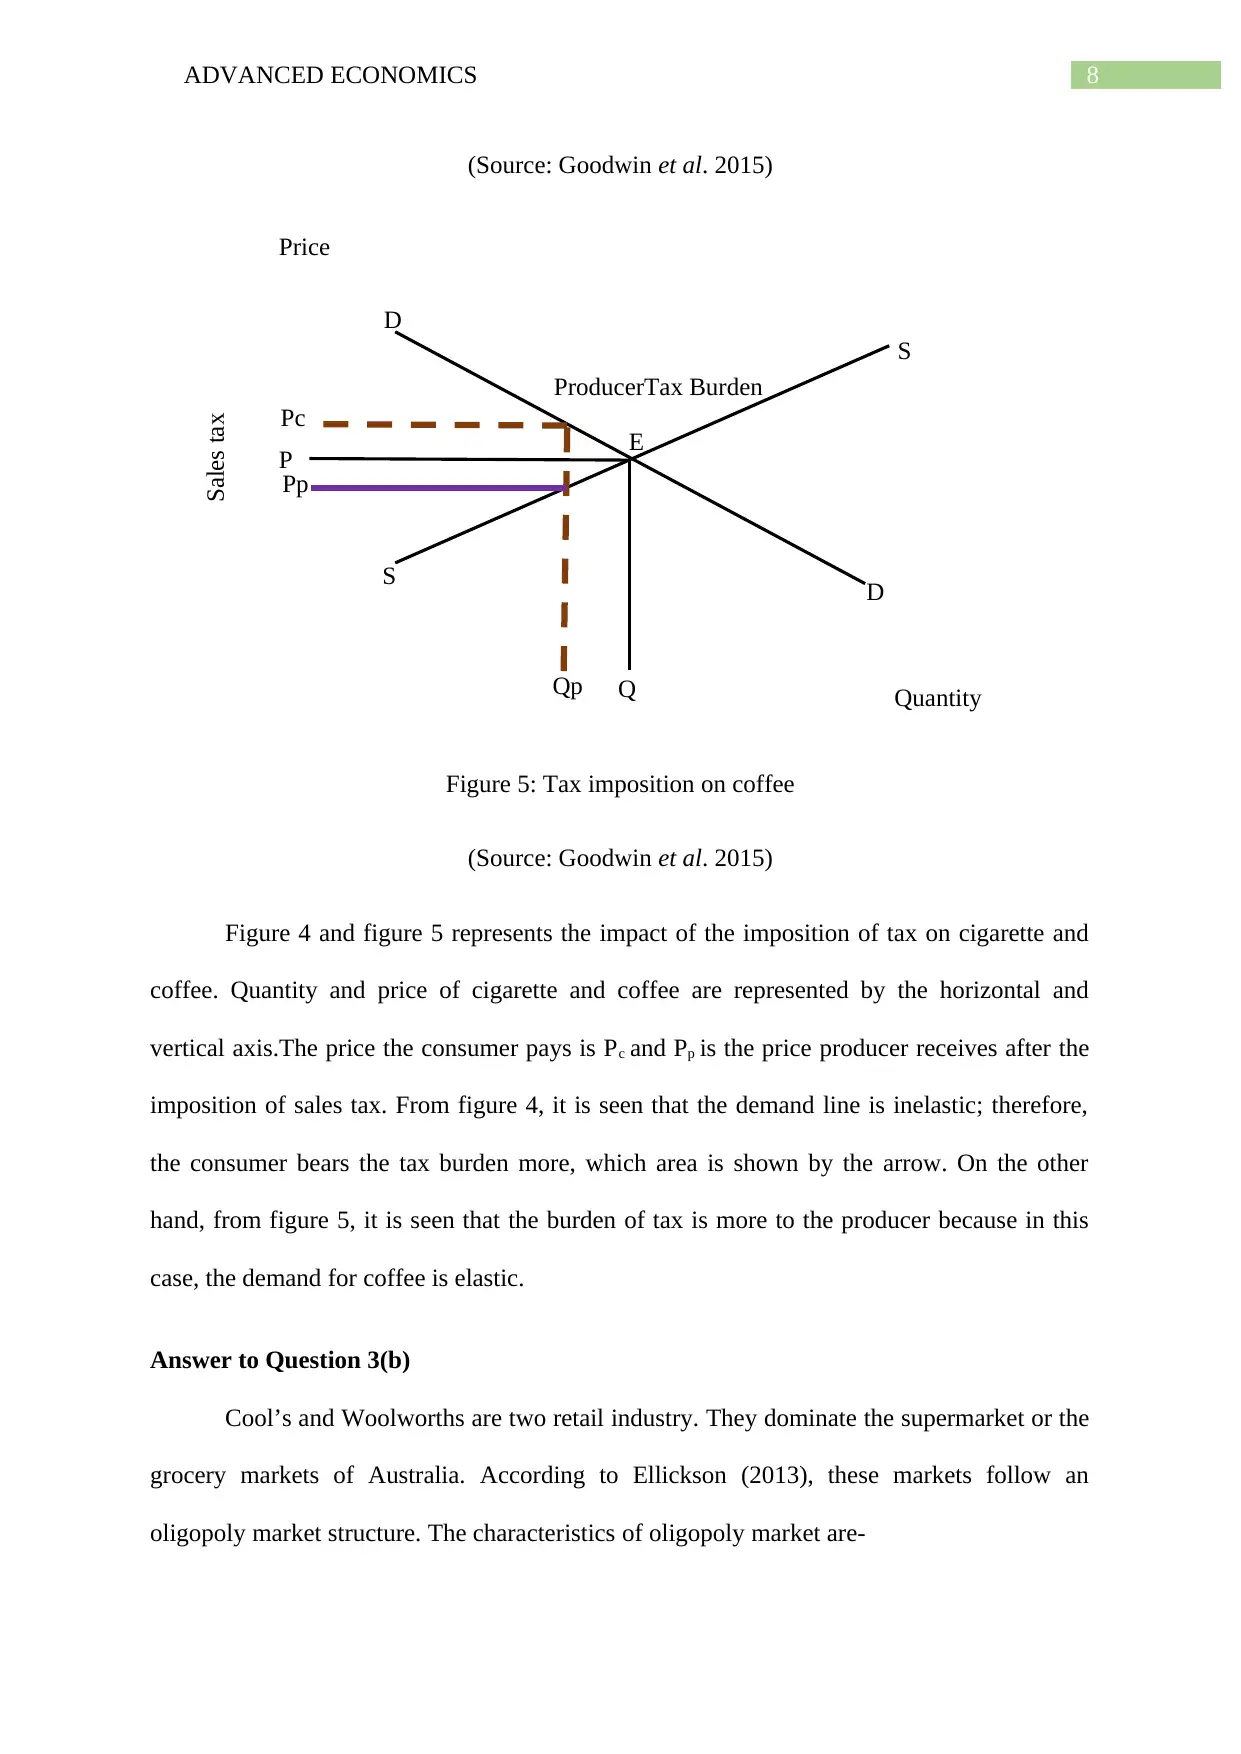
(Source: Goodwin et al. 2015)
Figure 5: Tax imposition on coffee
(Source: Goodwin et al. 2015)
Figure 4 and figure 5 represents the impact of the imposition of tax on cigarette and
coffee. Quantity and price of cigarette and coffee are represented by the horizontal and
vertical axis.The price the consumer pays is Pc and Pp is the price producer receives after the
imposition of sales tax. From figure 4, it is seen that the demand line is inelastic; therefore,
the consumer bears the tax burden more, which area is shown by the arrow. On the other
hand, from figure 5, it is seen that the burden of tax is more to the producer because in this
case, the demand for coffee is elastic.
Answer to Question 3(b)
Cool’s and Woolworths are two retail industry. They dominate the supermarket or the
grocery markets of Australia. According to Ellickson (2013), these markets follow an
oligopoly market structure. The characteristics of oligopoly market are-
ProducerTax Burden
S
D
Pc
P
Qp Q
E
Price
Quantity
D
Sales tax
S
Pp
(Source: Goodwin et al. 2015)
Figure 5: Tax imposition on coffee
(Source: Goodwin et al. 2015)
Figure 4 and figure 5 represents the impact of the imposition of tax on cigarette and
coffee. Quantity and price of cigarette and coffee are represented by the horizontal and
vertical axis.The price the consumer pays is Pc and Pp is the price producer receives after the
imposition of sales tax. From figure 4, it is seen that the demand line is inelastic; therefore,
the consumer bears the tax burden more, which area is shown by the arrow. On the other
hand, from figure 5, it is seen that the burden of tax is more to the producer because in this
case, the demand for coffee is elastic.
Answer to Question 3(b)
Cool’s and Woolworths are two retail industry. They dominate the supermarket or the
grocery markets of Australia. According to Ellickson (2013), these markets follow an
oligopoly market structure. The characteristics of oligopoly market are-
⊘ This is a preview!⊘
Do you want full access?
Subscribe today to unlock all pages.
Trusted by 1+ million students worldwide
9ADVANCED ECONOMICS
Restriction of new firms to enter into the market- Few barriers, in the long run,
prevent new firms from entering into the industry. As a result, the firms, which are
there previously makes a supernormal profit (Fudenberg and Tirole 2013).
Few firms dominate the market- There are few firms in an oligopoly market, which
dominates the other firms present in the market.
Existence of real competition- Since the firms, which dominates have rivals, therefore
it leads to more competition among themselves in the market.
They more or less produce similar products. The mentioned markets of Australia
have rivals, and they always keep an eye on their rivals’ moves. Therefore, this leads to
competition. Since there is competition present in the market structure of Cools and
Woolworths industry, therefore there are few barriers introduced by them in the long run.
This helps in preventing new firms from entering the market. As a result, the Cools and
Woolworths will try to achieve maximum profit.
Paraphrase This Document
Need a fresh take? Get an instant paraphrase of this document with our AI Paraphraser
10ADVANCED ECONOMICS
Reference
Baumol, W.J. and Blinder, A.S., 2015. Microeconomics: Principles and policy. Nelson
Education.
Becker, G.S., 2017. Economic theory. Routledge.
DeCicca, P., Kenkel, D. and Liu, F., 2013. Who pays cigarette taxes? The impact of
consumer price search. Review of Economics and Statistics, 95(2), pp.516-529.
Economictimes.com 2019. How Saudi oil strikes will impact your investments. [online] The
Economic Times. Available at:
https://m.economictimes.com/wealth/personal-finance-news/how-saudi-oil-strikes-will-
impact-your-investments/articleshow/71232119.cms [Accessed 25 Sep. 2019].
Ellickson, P.B., 2013. Supermarkets as a natural oligopoly. Economic Inquiry, 51(2),
pp.1142-1154.
Fudenberg, D. and Tirole, J., 2013. Dynamic models of oligopoly. Routledge.
Glerum, A., Stankovikj, L., Thémans, M. and Bierlaire, M., 2013. Forecasting the demand for
electric vehicles: accounting for attitudes and perceptions. Transportation Science, 48(4),
pp.483-499.
Goodwin, N., Harris, J.M., Nelson, J.A., Roach, B. and Torras, M., 2015. Macroeconomics in
context. Routledge.
Pelinescu, E., 2015. The impact of human capital on economic growth. Procedia Economics
and Finance, 22, pp.184-190.
Rodrik, D., 2014. The past, present, and future of economic growth. Challenge, 57(3), pp.5-
39.

11ADVANCED ECONOMICS
Shende, V., 2014. Analysis of research in consumer behavior of automobile passenger car
customer. International Journal of Scientific and Research Publications, 4(2), p.1.
Shende, V., 2014. Analysis of research in consumer behavior of automobile passenger car
customer. International Journal of Scientific and Research Publications, 4(2), p.1.
⊘ This is a preview!⊘
Do you want full access?
Subscribe today to unlock all pages.
Trusted by 1+ million students worldwide
1 out of 12
Related Documents


Your All-in-One AI-Powered Toolkit for Academic Success.
+13062052269
info@desklib.com
Available 24*7 on WhatsApp / Email
![[object Object]](/_next/static/media/star-bottom.7253800d.svg)
Unlock your academic potential
Copyright © 2020–2026 A2Z Services. All Rights Reserved. Developed and managed by ZUCOL.