7ENT1066 - Advanced Engines: In-Cylinder Pressure Analysis Report

Verified

Added on  2022/09/21

|20
|3236
|19
Report
AI Summary
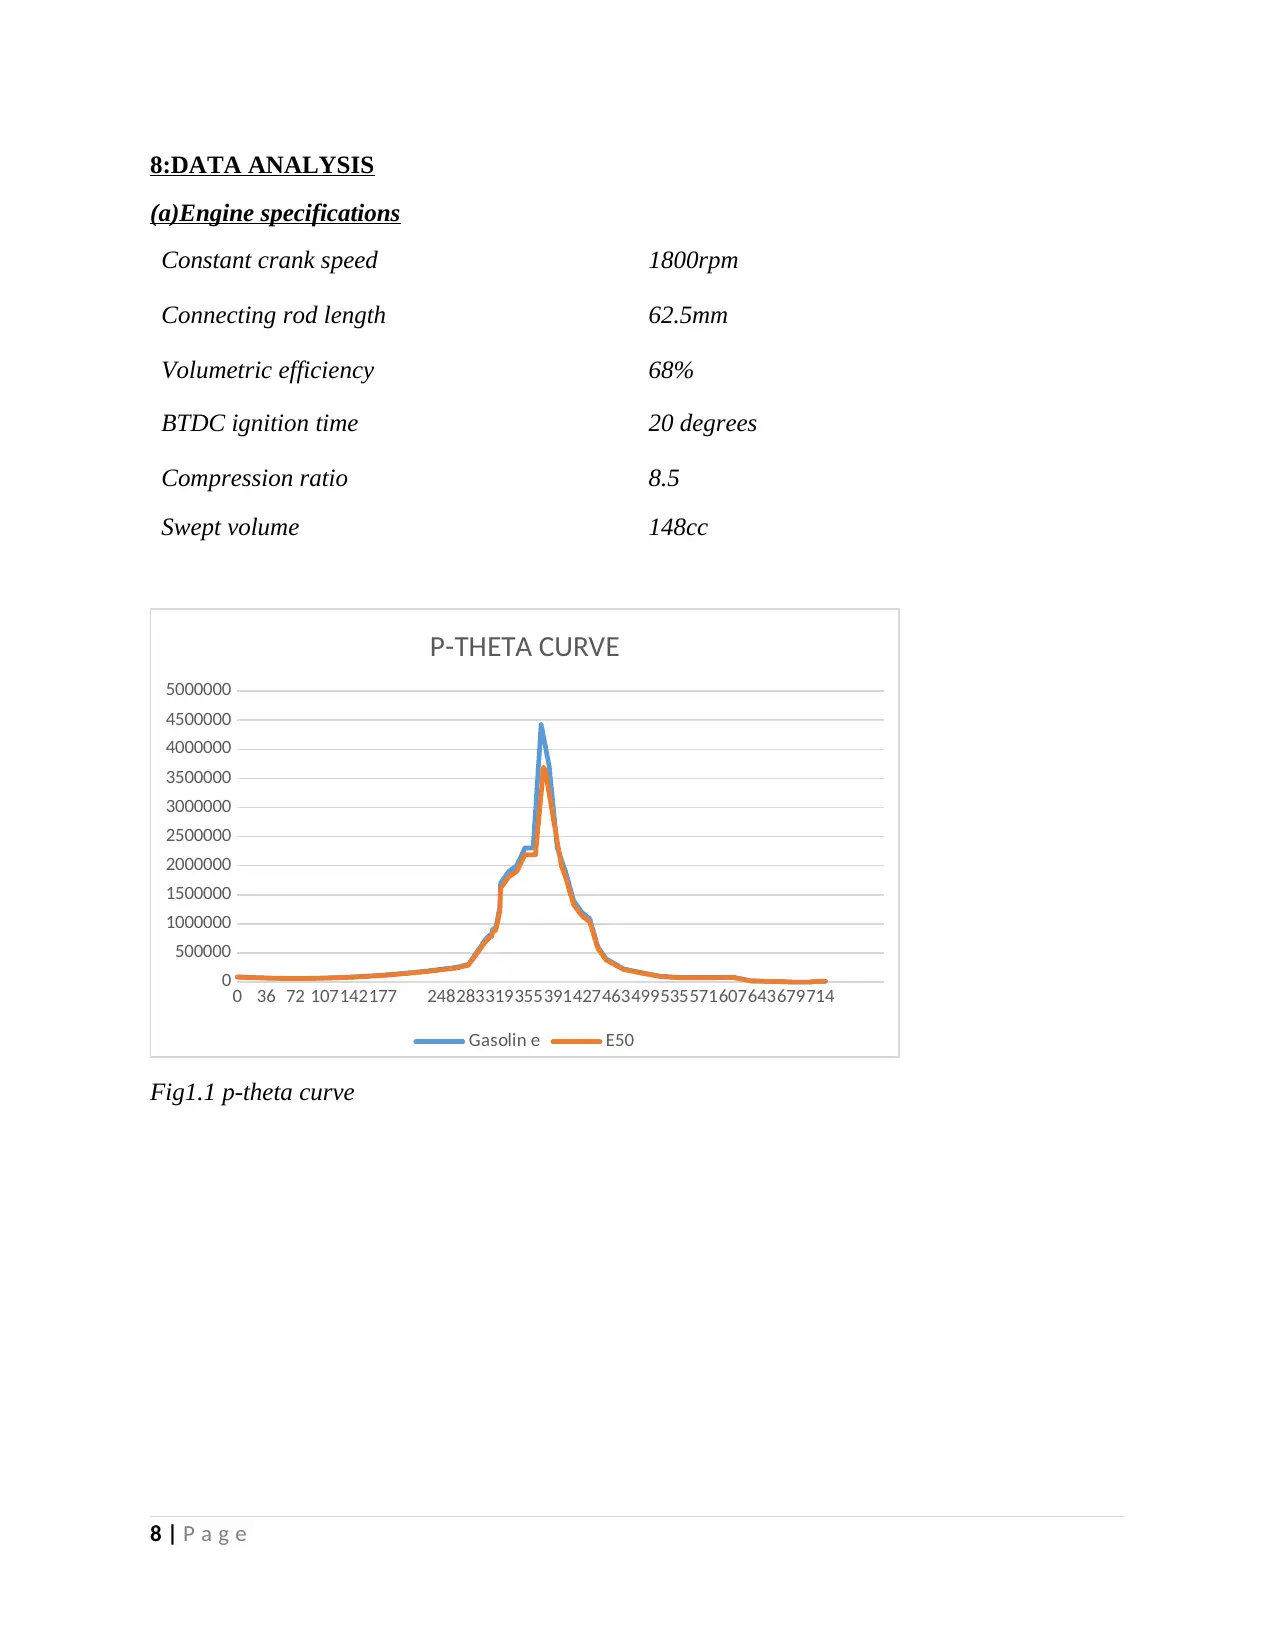
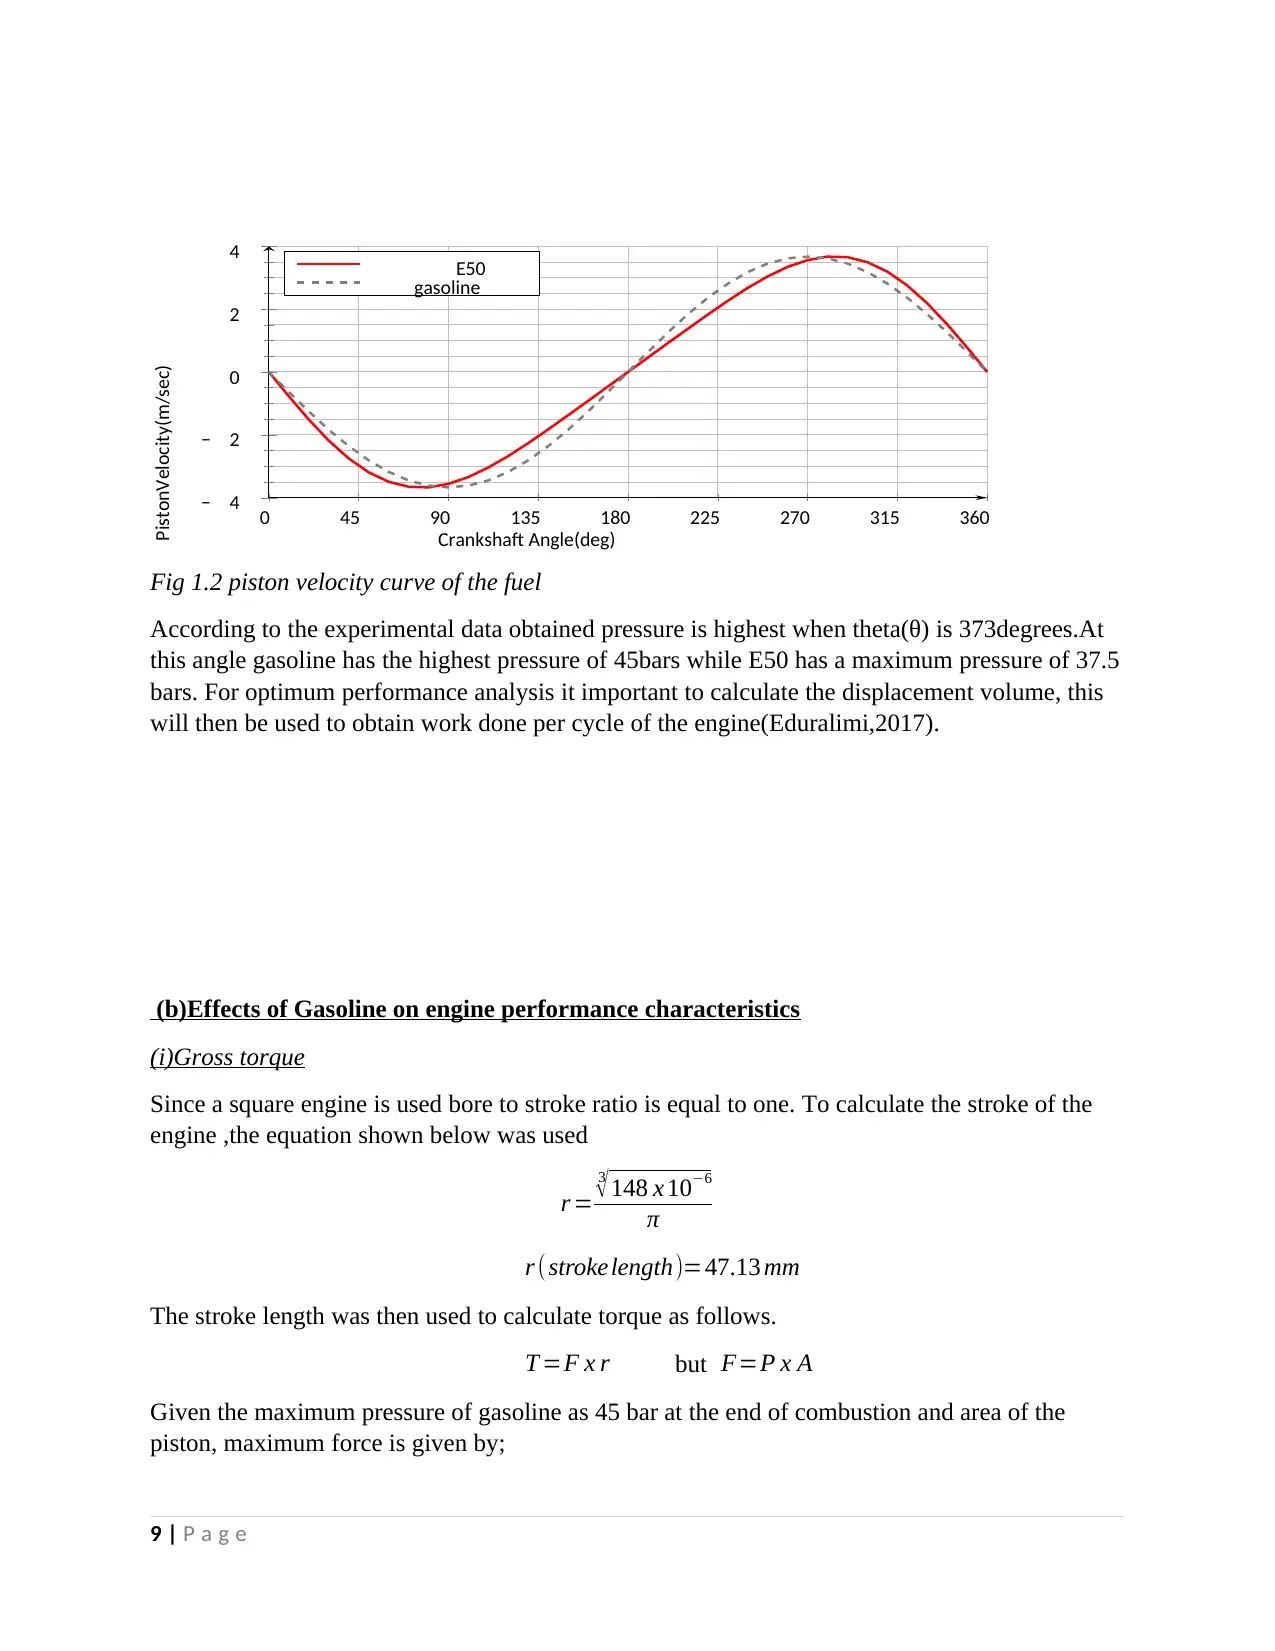
This report analyzes engine operation performance using gasoline and E50 fuel, focusing on in-cylinder pressure analysis. Experimental data was used to generate p-theta curves, which were then used for numerical engine performance analysis. The study covers design variable changes between gasoline and E50, thermodynamic cycle calculations, mass burnt fraction curves, and other pressure analysis curves. Power, specific fuel consumption, and indicated power were calculated for both fuels based on engine specifications. The report includes graphical plots of mass burnt, piston velocity, and heat release curves, demonstrating conformity with theoretical data. The methodologies used include comparing the effects of E50 and gasoline on engine performance, assessing the physiochemical properties of both fuels, calculating heat release values from crank angle, and analyzing empirical relations from mass fraction burned and heat release rate. The experiment also examines how fuel choice affects NOx emissions, flame propagation, and ignition delay duration.
Document Page
1: TITLE: ENGINE IN-CYLINDER PRESSURE ANALYSIS
2: ABSTRACT
In this paper engine operation performance was studied using gasoline E50 which is an ethanol
blend fuel containing equal amount of gasoline and ethanol. From the experimental data p-theta
curves was obtained, this data was manually used to perform numerical engine performance
analysis.
Different design variable changed when the fuel was altered from gasoline to E50.From the
engine thermodynamic cycle calculations, vital coefficients were obtained, this coefficient
proved useful in the drawing of mass burnt fraction curves and other pressure analysis
curves(Etiz,2013).
Power, specific fuel consumption and indicated power were calculated for both fuels, this was
done according to the engine specifications. The experimental peak in-cylinder values were used
to graphically plot mass burnt, piston velocity and heat release curves which showed huge
conformity with the theoretical data and plots.
1 | P a g e
tabler-icon-diamond-filled.svg

Paraphrase This Document

Need a fresh take? Get an instant paraphrase of this document with our AI Paraphraser
Document Page
3: TABLE OF CONTENT
1.Title page……………………………………………………………………………….……….1
2.Abstract………………………………………………………………………………………….1
3.Table of content………………………………………………………...……………………….2
4.List of figures……………………………………………………………………………………2
5.Introduction…………………………………………………………………….………………..3
6.Methodology…………………………………………………………………………...………..5
7.Literature review ………………………………………………………………………………..6
8.Data analysis………………………………………………….…………………………………8
9.Discussion ……………………………………………………………………………………..13
10.Conclusion………………………………..…………………………………………………..15
11.References………………………………………………….…………………………………20
4: LIST OF FIGURES
Fig 1.0 crankshaft alignment………………………………………………………………………4
Fig 1.1 p-theta curve………………………………………………………..……..………………6
Fig 1.2 piston velocity curve…………………………………………………...….………………6
Fig 1.3 mass fraction curve… ………………………………………………………...…………13
Fig 1.4 effects of combustion pressure………………………………………………..…………14
Fig 1.5 heat release rate curve………………………………….………………………...………15
2 | P a g e
Document Page
5: INTRODUCTION
There has been a lot of emphasis in the development of an alternative fuel for engine
systems(Patterson,2014). This tendency is to replace the fossils fuel with an ecofriendly and
efficient fuel. The suitable mode for this to be achieved is by using ethanol blends such as E10,
E50 and E85, this paper does research of E50 fuel and gasoline. Considering most engineers’
objective is to develop an efficient fuel without any modification in the engine control
unit(ECU), it is important to calculate specific fuel consumption(SFC) of gasoline and E50, this
can be done by recording the effects of carbon dioxide, carbon monoxide and nitrogen oxide
formed in combustion of both fuels.
According to the research data analysis, unburnt hydrocarbons which included benzene,
acetaldehyde and formaldehyde were obtained from the exhaust gases, these hydrocarbons were
included in analysis of unburnt mass fraction of the fuel. As for the E50 it was noted that it
generally had greater values of air to fuel ratio and stoichiometric air-fuel ratio that pure
gasoline. Values obtained from the NOx emissions showed that, E50 is a much ecofriendly fuel
compared to gasoline. E50 had minimal effect to the destruction of the environment and
deterioration of human health. From the thermal analysis perspective, the suitable volatile
organic compounds were ethylene, ethane, ethanol and formaldehyde this is because of the
minimal mass emitted in their combustion(Alla,2015). Moreover, from the chemical analysis,
ethanol (108.5) had a higher octane number compared to gasoline (84.4), this made ethanol a
perfect alternative to be used in engines operating with high compression ratio, therefore, engine
thermal efficiency of the engine greatly improved when E50 was used. One vital chemical
property of ethanol was its high heat of vaporization, this reduced the temperature of intake
manifold. From the analysis the temperature changes in both fuels tended to increase the overall
volumetric efficiency of the engine. But this lower temperature also has it drawback since it
lowered the temperatures of combustion of E50 and henceforth increased its ignition delay
duration. This increase made the production level exhaust gases to increase, these gases included
carbon monoxide which had adverse effects on the environment. Another important parameter
for heat release analysis was the Reid Vapor Pressure(RVP) of the fuel, this parameter should
always be checked when deciding on the suitable fuel. Any mistakes can cause the engine to
experience cold transient during warm up phase. When evaluating the mechanical performance
of the engine it was important to note that gasoline has thrice the energy content of ethanol. This
means that the combustion pressure of gasoline was always be higher than that of E50 fuel. This
have affected the torque developed and the power of the engine. Also fuel consumption rate was
always affected depending on the fuel used. The following table shows some simplified
properties of both fuels(Balla,2015).
property Gasoline E50
Density (kg/m3) 773 746
Lower heating value(LHV) 44000 39,591
Latent heat of vaporization(kJ/kg) 305 _
3 | P a g e
Document Page
RVP(kpa) 62 _
Stoichiometric air/fuel ratio 13.6 12.7
RON 14.49 13.31
MON 80.3 83.3
4 | P a g e
tabler-icon-diamond-filled.svg

Paraphrase This Document

Need a fresh take? Get an instant paraphrase of this document with our AI Paraphraser
Document Page
6: METHODOLOGY
The following were the methodologies which were used in the presentation of this paper.
Comparison of effects of E50 and gasoline on the engine operation performance
Using the p-theta curves to ascertain the fuel behavior on the engine operation
Obtaining the mass fraction burned curves from the experimental p-theta data
Assessing the physiochemical properties of both E50 and gasoline, this was used in
analyzing the combustion duration of both fuels
Using the obtained crank angle to calculate the heat release values
Analyzing the empirical relations obtained from the mass fraction burned and the heat
release rate(HRR)
Experimenting on how the choice of fuel affect the NOx emission rates, flame
propagation and ignition delay duration
5 | P a g e
Document Page
7: LITRATURE REVIEW
To properly analyze the data obtained from the experiment it is important to note that the engine
cylinder has two separate volumes, clearance volume this is always constant and is created when
the piston rise or fall in during reciprocation of the crankshaft. When this occurs volume of the
air increases and amount of air is displaced this is called displacement volume. This rotation of
the crankshaft is usually calculated from the top dead center(TDC) of the engine, since a 4stroke
engine was used, this theta values will always range from 0 to 720 degrees. The figures below
show how the displacement of the connecting rod changes the angle θ during 4 cycle of
operation of the engine(Centikaya,2012).
Fig1.0 crankshaft alignment angles
During the rotation of the crankshaft, the connecting rod moves in a circular manner. The engine
experiences both vertical and horizontal displacement, this is a periodic motion, described by
sine and cosine angles. The following equations shows the steps used to calculate the
displacement volume from angles obtained from the experiment.
6 | P a g e
Document Page
7 | P a g e
tabler-icon-diamond-filled.svg

Paraphrase This Document

Need a fresh take? Get an instant paraphrase of this document with our AI Paraphraser
Document Page
8:DATA ANALYSIS
(a)Engine specifications
Constant crank speed 1800rpm
Connecting rod length 62.5mm
Volumetric efficiency 68%
BTDC ignition time 20 degrees
Compression ratio 8.5
Swept volume 148cc
0 36 72 107142177 248283319355391427463499535571607643679714
0
500000
1000000
1500000
2000000
2500000
3000000
3500000
4000000
4500000
5000000
P-THETA CURVE
Gasolin e E50
Fig1.1 p-theta curve
8 | P a g e
Document Page
Fig 1.2 piston velocity curve of the fuel
According to the experimental data obtained pressure is highest when theta(θ) is 373degrees.At
this angle gasoline has the highest pressure of 45bars while E50 has a maximum pressure of 37.5
bars. For optimum performance analysis it important to calculate the displacement volume, this
will then be used to obtain work done per cycle of the engine(Eduralimi,2017).
(b)Effects of Gasoline on engine performance characteristics
(i)Gross torque
Since a square engine is used bore to stroke ratio is equal to one. To calculate the stroke of the
engine ,the equation shown below was used
r =
3
148 x 106
π
r ( strokelength)=47.13 mm
The stroke length was then used to calculate torque as follows.
T =F x r but F=P x A
Given the maximum pressure of gasoline as 45 bar at the end of combustion and area of the
piston, maximum force is given by;
9 | P a g e
0 1801359045 225 270 315 360
4
2
0
2
4
Crankshaft Angle(deg)
PistonVelocity(m/sec)
E50
gasoline
Document Page
F=45.0 x 10⁵ x π x 47.132 x 10⁶
F=31.4 kN
T =31.4 x 103 x 47.13 x 103
T =1.48 Nm
(ii)Maximum power
gross power (P)= 2 πNT
60
P=2 π x1800 x 1.48 x 10/60
¿ 27.897 kW
(iii) air flow into the engine
n=
airFlow ( kg
Hr )
π
4 x D2 Lx Nx no of cyles/ strokexρ(air density )
0.68= airflow(kg /hr )
π
4 x 47.13 x 4 x 1.225 x 109
Air flow=0.274 kg /hr
(iv)The fuel flow rate
Where the A/F ratio of gasoline is 13.6
A/ F= AirFlow
FuelFlow
fuel flow= 0.274
13.6 =0.02014 kg/hr
10 | P a g e
tabler-icon-diamond-filled.svg

Paraphrase This Document

Need a fresh take? Get an instant paraphrase of this document with our AI Paraphraser
Document Page
(v)engine effective pressure
Assuming thermal efficiency of 59.5%
Lower heating value of gasoline=44,000kJ/kg
where m is the fuel consumed per unit time and Q is the net calorific value of gasoline.
efficiency (η)= brake power
energy supplied
n= b . p
˙m xQnet
brake power=0.02014 x 44,000 Kj/kg x0.595 x60
=16.46kW
(vi)specific fuel consumption
SFC= mass of fuel consumption
engine brake power
SFC=60 x 0.02014 x 1000/1.646kw
=734.7g/kWh
(vii)brake mean effective pressure(BMEP)
BMEP¿
BMEP= 164.6 x 60 x 1000
47.13 x 103 x 2.22 x 104 x 4 x 100
=9.44 bars
11 | P a g e
Document Page
(viii)indicated power(IP) and indicated mean effective pressure(IMEP)
workdone
cyle =areaof Pv diagram x Xscalefactor x Yscalefactor
¿ P V x 50,000 x 27
Change in volume(clearance)=engine capacity/compression ratio-1
=148/8.5- 1
=19.733 x 10^-6
Therefore, work done/cycle
=19.733 x 10^-6 x50,000 x 27
=26.64kJ
IP=
workdone
cyle x ( N
n )x no of cyle
60 x 1000
IP=26.64 x 4/(60 x 1000)
=17.76Kw
IMEP= indicatedPower ( kW ) x 60
L x A x ( n
m )x no ofcyle x 100
IMEP=177.6 X 60 / (47.13 x 10^-3 x 2.22 x10^-4 x 4 x 100)
=2.546 kPa
(c)Effects of E50 on engine performance characteristics
12 | P a g e
chevron_up_icon
1 out of 20
circle_padding
hide_on_mobile
zoom_out_icon
[object Object]