Advanced Mathematics for Scientists: Coursework 1311 Assignment

Verified

Added on  2023/01/13

|4
|737
|46
Homework Assignment
AI Summary
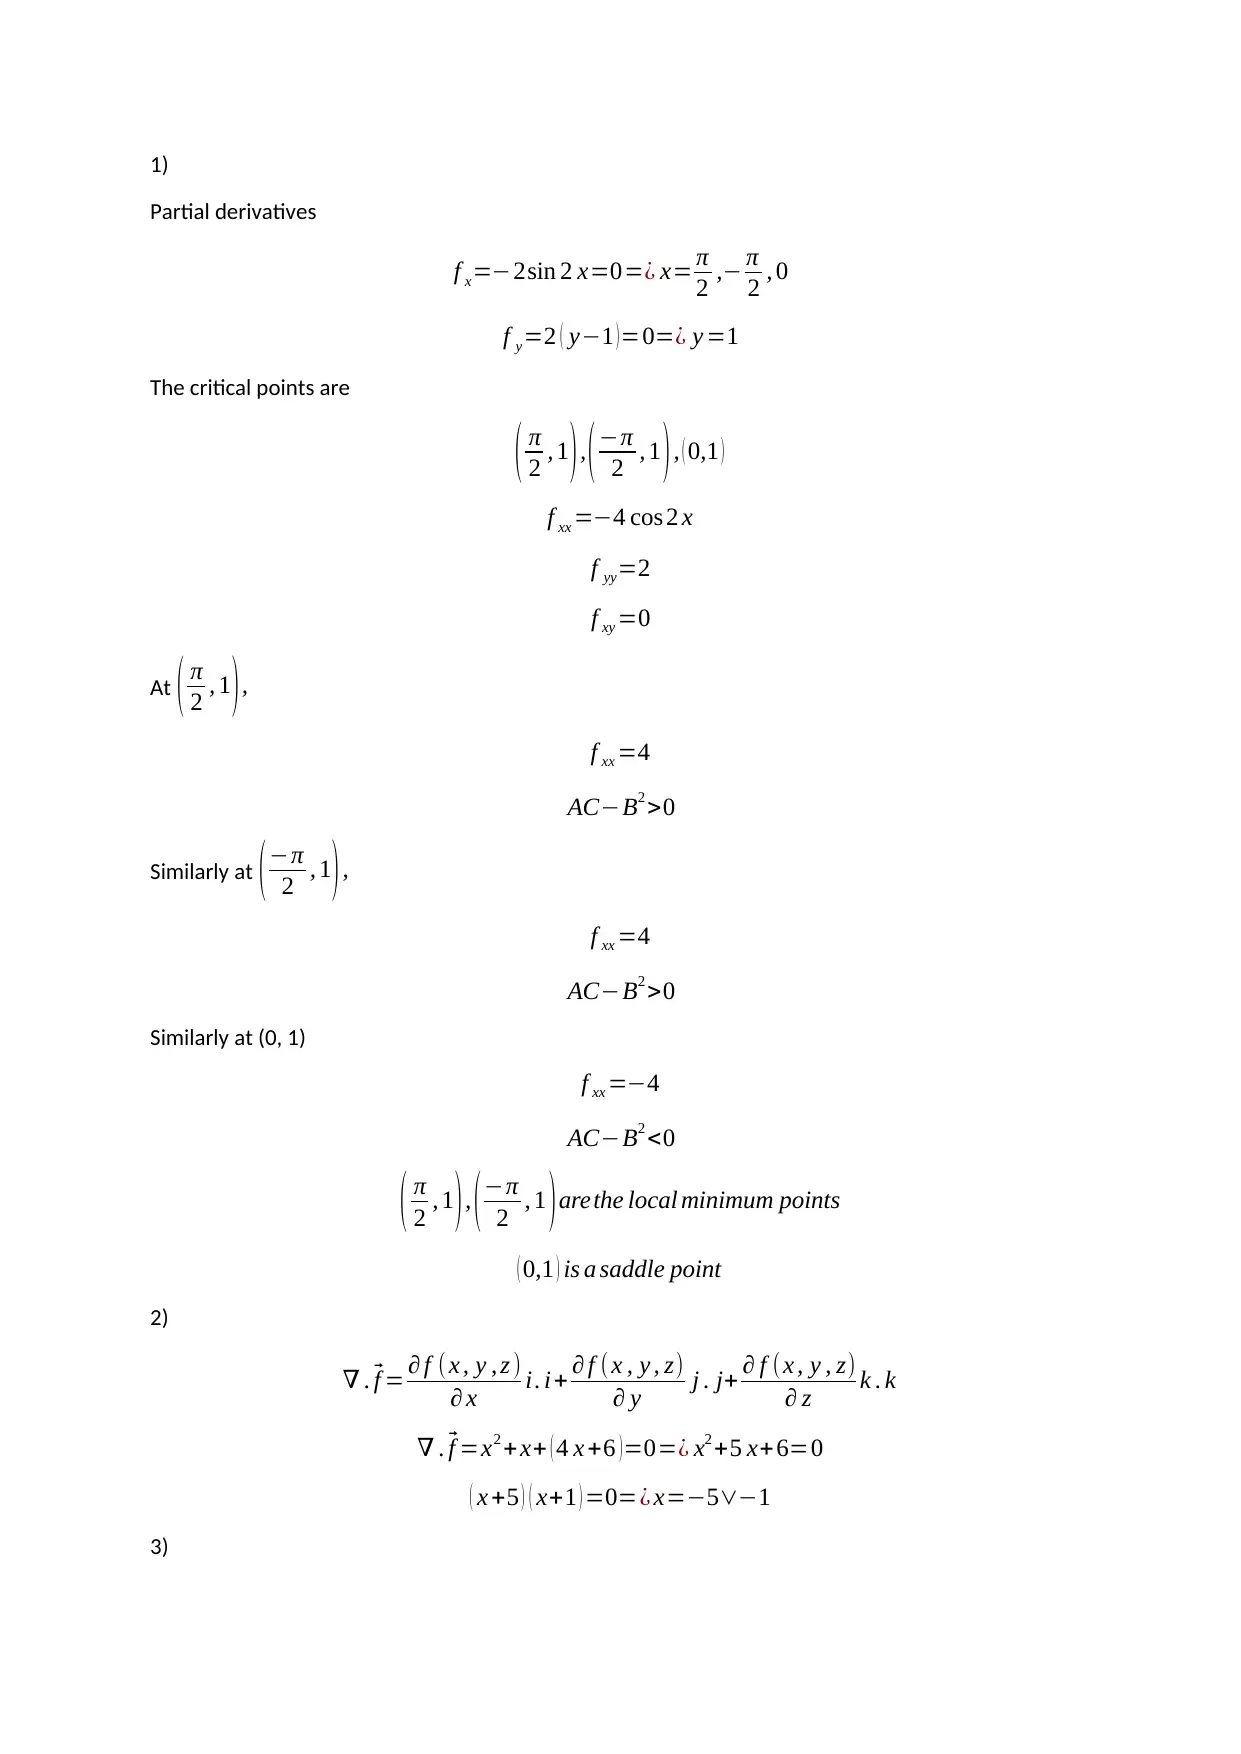
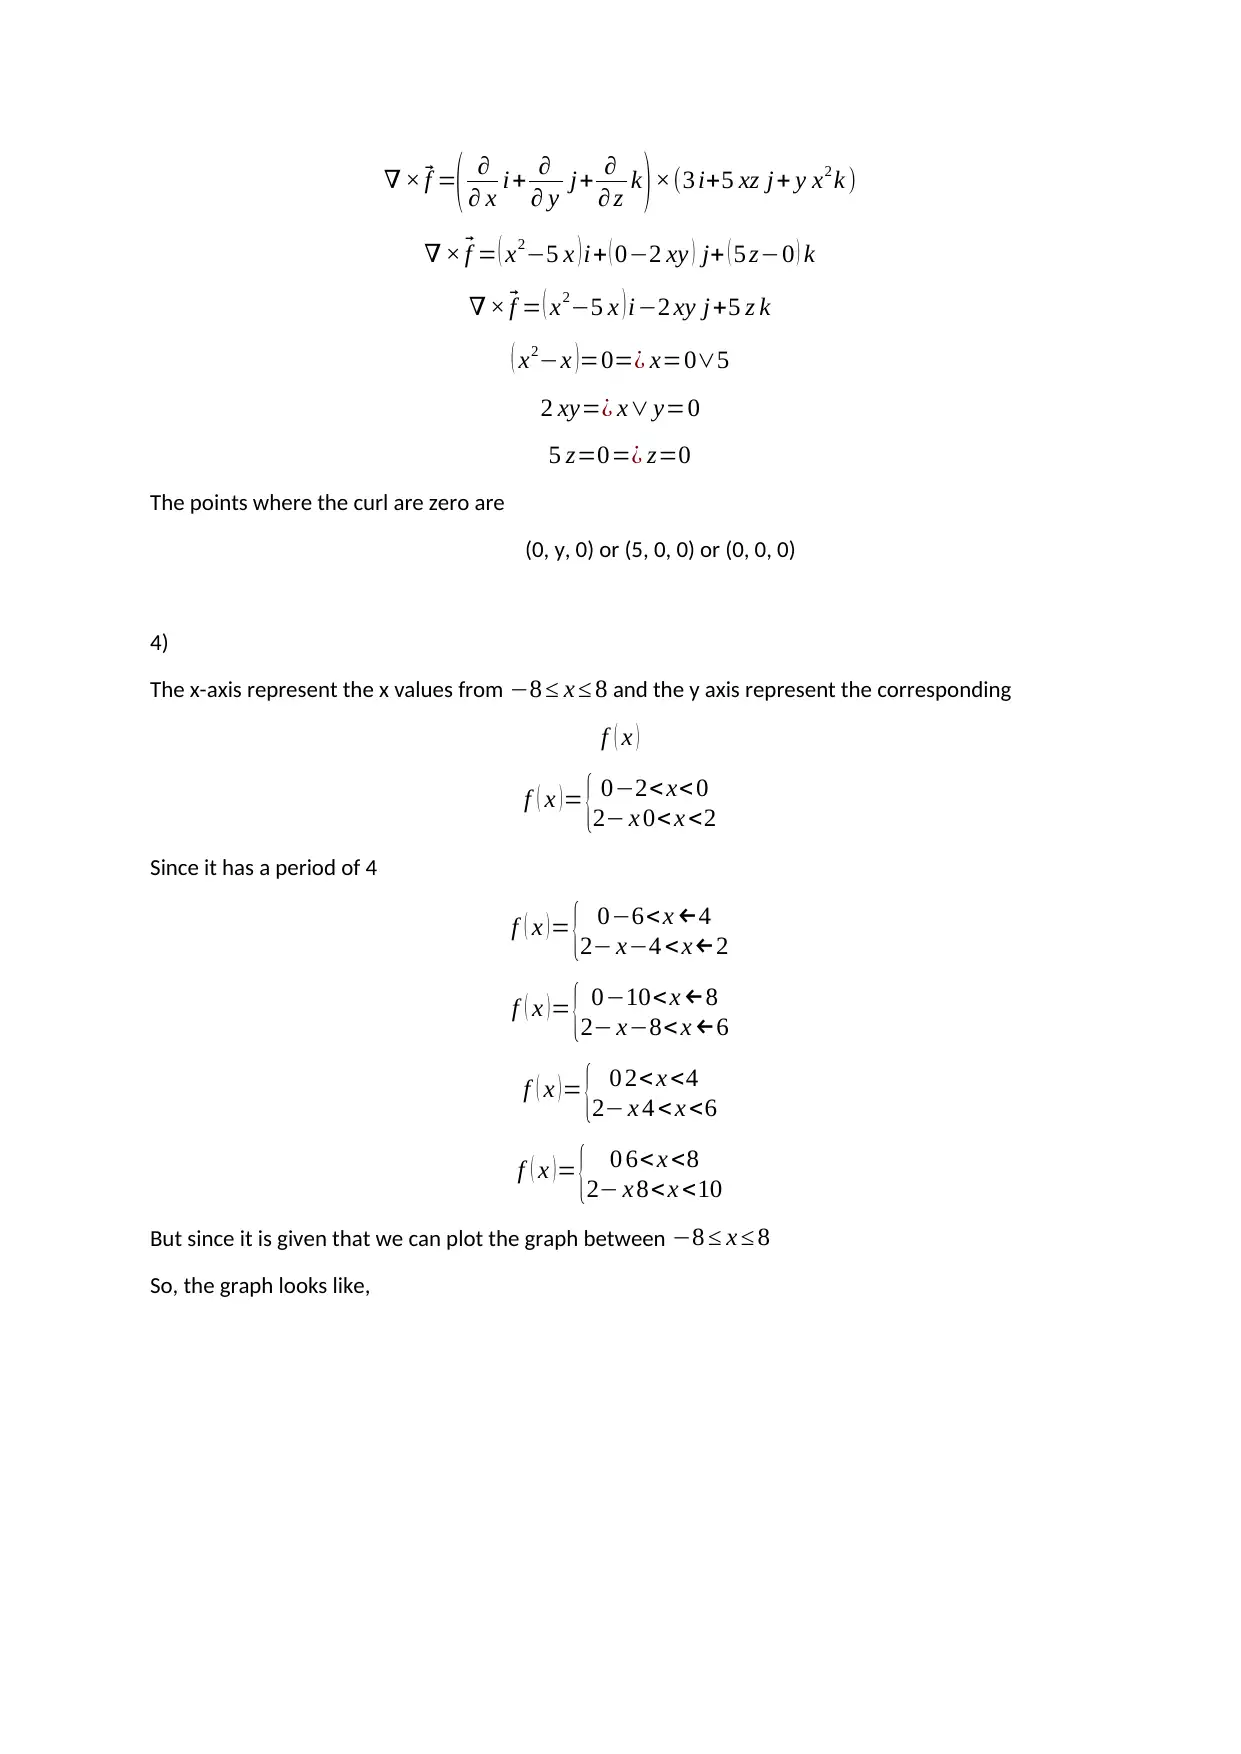
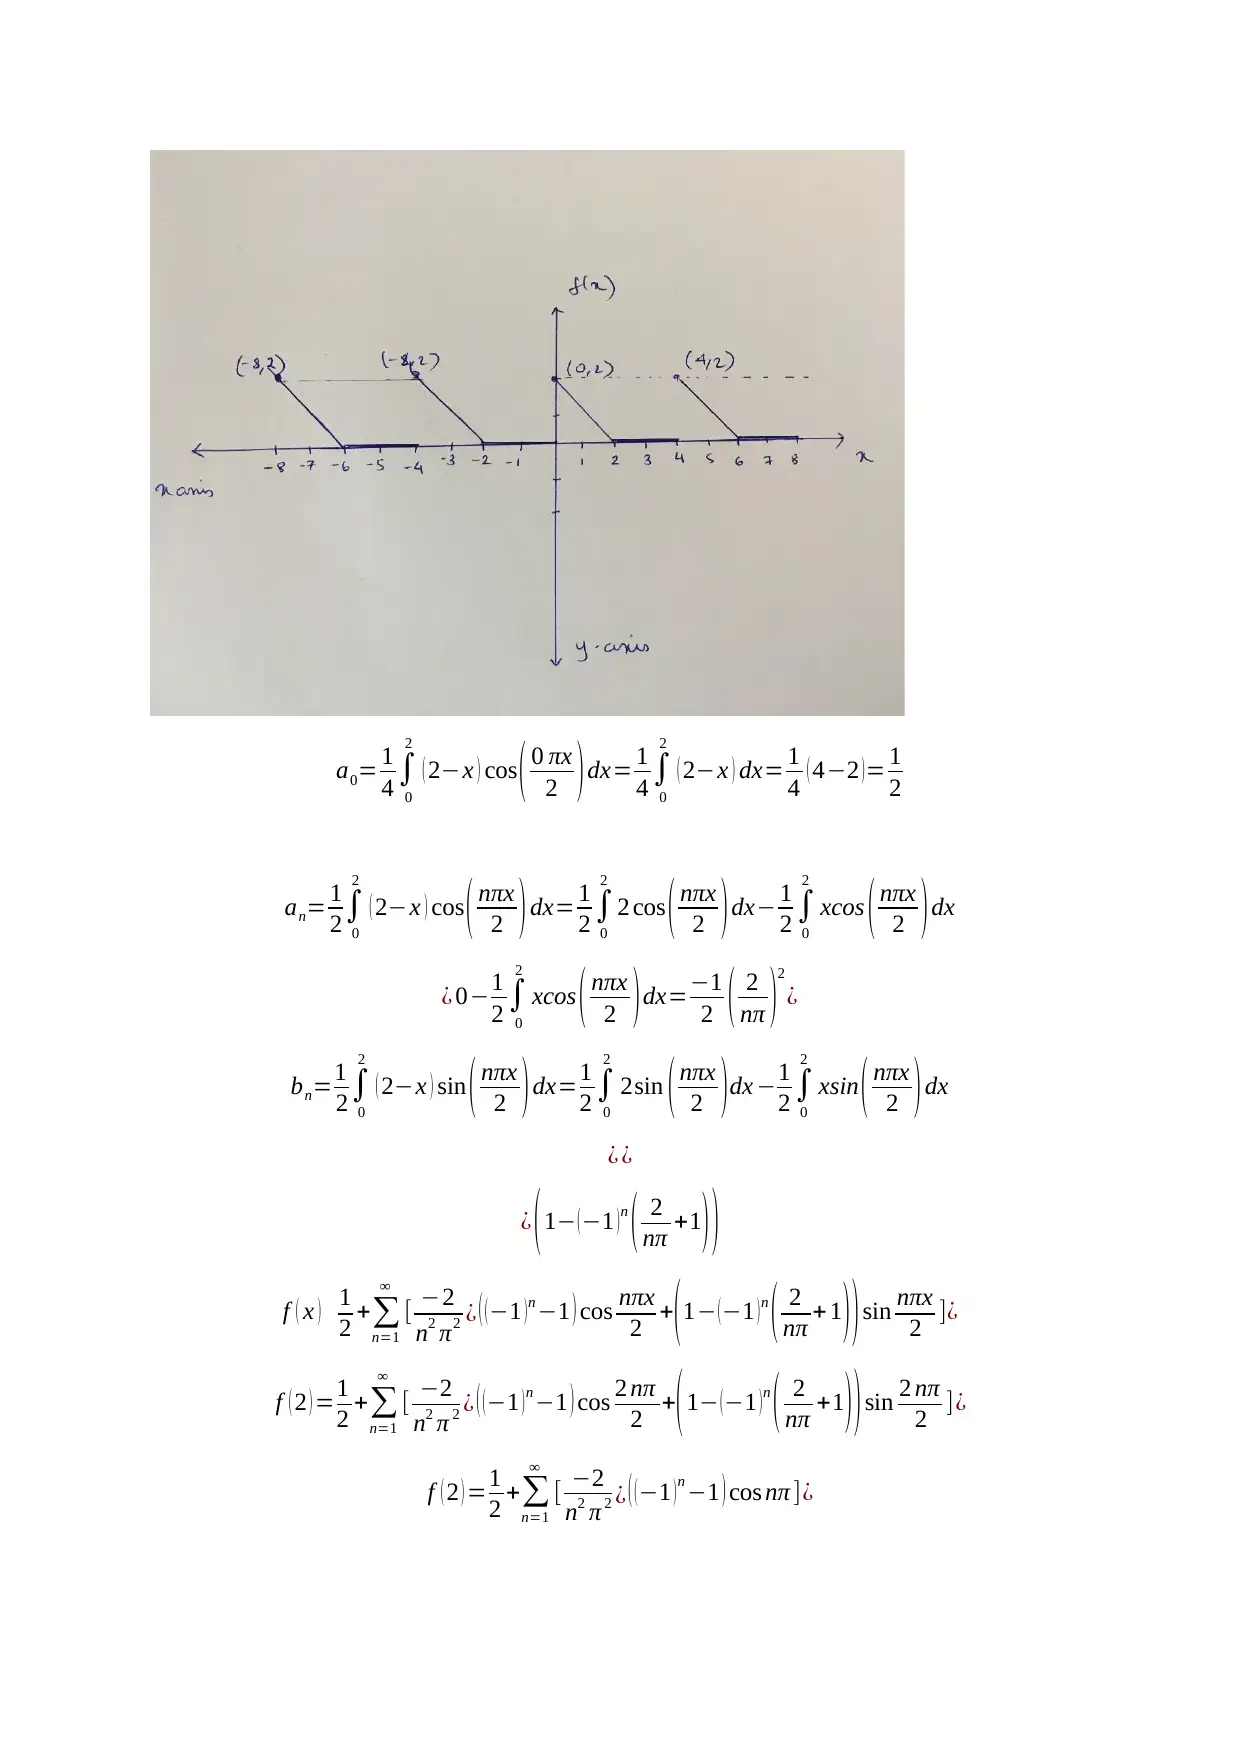
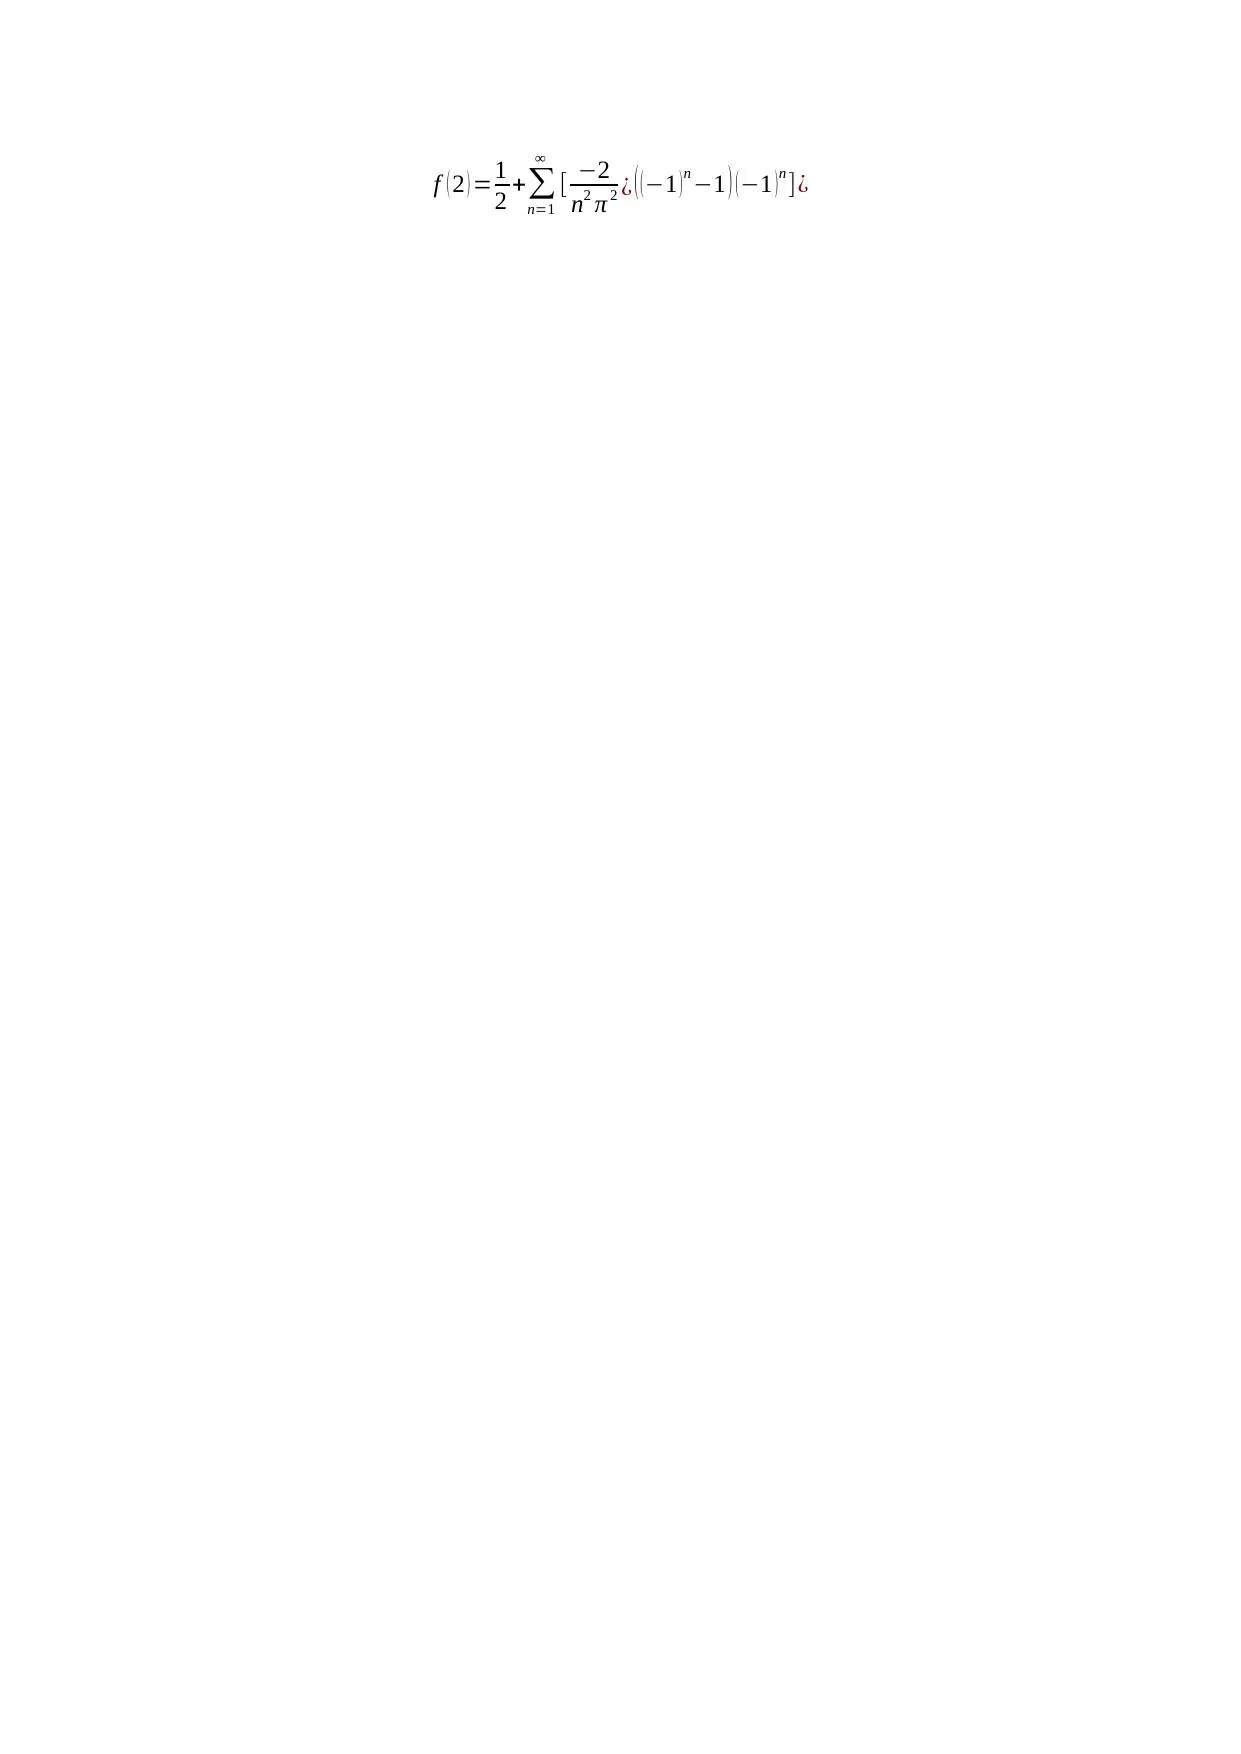
This document provides a comprehensive solution to an advanced mathematics assignment, addressing several key concepts. The solution begins by determining critical points for a given function, classifying them as maxima, minima, or saddle points using partial derivatives. It then explores vector calculus, calculating the divergence of a vector field and identifying locations of convergence. The assignment further delves into the curl of a vector field, determining points where the curl is zero. Finally, the solution analyzes a periodic function, graphing it over a specified interval, deriving its Fourier series representation, and evaluating the function at a specific point. This assignment is a great resource for students studying advanced mathematics and calculus.
Document Page
1)
Partial derivatives
f x=2sin 2 x=0=¿ x= π
2 , π
2 , 0
f y=2 ( y1 ) =0=¿ y =1
The critical points are
( π
2 , 1) , ( π
2 , 1 ) , ( 0,1 )
f xx =4 cos 2 x
f yy=2
f xy =0
At ( π
2 , 1),
f xx =4
ACB2 >0
Similarly at (π
2 , 1 ),
f xx =4
ACB2 >0
Similarly at (0, 1)
f xx =4
ACB2 <0
( π
2 , 1 ) , ( π
2 , 1 ) arethe local minimum points
( 0,1 ) is a saddle point
2)
. f = f (x , y , z )
x i. i+ f (x , y , z)
y j . j+ f (x , y , z)
z k . k
. f =x2 +x+ ( 4 x +6 )=0=¿ x2 +5 x+6=0
( x +5 ) ( x+1 ) =0=¿ x=51
3)
tabler-icon-diamond-filled.svg

Paraphrase This Document

Need a fresh take? Get an instant paraphrase of this document with our AI Paraphraser
Document Page
× f =(
x i+
y j+
z k )×(3 i+5 xz j+ y x2 k )
× f = ( x25 x ) i+ ( 02 xy ) j+ ( 5 z0 ) k
× f = ( x25 x ) i2 xy j+5 z k
( x2x )=0=¿ x=05
2 xy=¿ x y=0
5 z=0=¿ z=0
The points where the curl are zero are
(0, y, 0) or (5, 0, 0) or (0, 0, 0)
4)
The x-axis represent the x values from 8 x 8 and the y axis represent the corresponding
f ( x )
f ( x ) = { 02< x< 0
2 x 0< x <2
Since it has a period of 4
f ( x ) = { 06< x 4
2 x4 < x2
f ( x )= { 010<x 8
2 x8< x 6
f ( x ) = { 0 2< x <4
2 x 4 < x <6
f ( x )= { 0 6< x <8
2 x 8< x <10
But since it is given that we can plot the graph between 8 x 8
So, the graph looks like,
Document Page
a0= 1
4
0
2
( 2x ) cos ( 0 πx
2 )dx= 1
4
0
2
( 2x ) dx= 1
4 ( 42 )= 1
2
an= 1
2
0
2
( 2x ) cos ( nπx
2 )dx= 1
2
0
2
2 cos ( nπx
2 )dx 1
2
0
2
xcos ( nπx
2 )dx
¿ 01
2
0
2
xcos ( nπx
2 )dx=1
2 ( 2
)2
¿
bn=1
2
0
2
( 2x ) sin ( nπx
2 )dx=1
2
0
2
2sin ( nπx
2 )dx 1
2
0
2
xsin ( nπx
2 )dx
¿ ¿
¿ ( 1 ( 1 ) n
( 2
+1 ) )
f ( x ) 1
2 +
n=1

[ 2
n2 π2 ¿ ( ( 1 ) n 1 ) cos nπx
2 +
( 1 ( 1 ) n
( 2
+ 1 ) ) sin nπx
2 ]¿
f ( 2 ) =1
2 +
n=1

[ 2
n2 π 2 ¿ ( ( 1 ) n 1 ) cos 2
2 +
( 1 ( 1 ) n
( 2
+1 ) ) sin 2
2 ]¿
f ( 2 ) =1
2 +
n=1

[ 2
n2 π 2 ¿ ( ( 1 ) n 1 ) cos ]¿
Document Page
f ( 2 ) =1
2 +
n=1

[ 2
n2 π 2 ¿ ( (1 )n 1 ) (1 )n ]¿
chevron_up_icon
1 out of 4
circle_padding
hide_on_mobile
zoom_out_icon
[object Object]