Advanced Quantitative Analysis Report: SPSS Techniques and Results
VerifiedAdded on 2020/01/07
|17
|3066
|246
Report
AI Summary
This report details an advanced quantitative analysis conducted using SPSS, focusing on data input, graphical presentation, and statistical techniques such as regression and ANOVA. The analysis includes a dataset of 26 samples, exploring nominal and scale-based data, and calculating a BMI index. The report presents findings on gender and age group summaries, cross-tabulations, histograms, scatter plots, and frequency distributions. Statistical tests like t-tests and correlation analyses were performed to investigate relationships between variables such as Zung anxiety scores, BMI, age, fat percentage, mobile phone usage, and tumor size. The study concludes with key findings on these relationships, including correlations and significance levels, providing valuable insights into the dataset and the applied statistical methods. The report also contains detailed appendices with SPSS outputs.
Advanced Quantitative
Analysis
1
Analysis
1
Paraphrase This Document
Need a fresh take? Get an instant paraphrase of this document with our AI Paraphraser
TABLE OF CONTENTS
INTRODUCTION................................................................................................................................3
a. Activity 1..........................................................................................................................................3
(i). Task 1.........................................................................................................................................3
(ii). Task 2........................................................................................................................................3
Summary of each gender and age group..........................................................................................3
Cross tabulation...............................................................................................................................4
Histogram.........................................................................................................................................4
Graph for frequency distribution of the age group by gender.........................................................5
Scatter plot of height against weight................................................................................................5
Task 3...............................................................................................................................................6
B. ACTIVITY 2....................................................................................................................................7
(i) Task 1..........................................................................................................................................7
C. ACTIVITY 3....................................................................................................................................7
(i) Task 1..........................................................................................................................................7
CONCLUSION....................................................................................................................................8
REFERENCES.....................................................................................................................................9
APPENDIX........................................................................................................................................10
Appendix 1: Summary of each gender and age group...................................................................10
Appendix 2: Cross-tabulation for age group and gender...............................................................10
Appendix 3: Correlation between Zung anxiety and panic disorder.............................................11
Appendix 4: Correlation between Zung anxiety and BMI............................................................12
Appendix 5: BMI men and women mean......................................................................................13
Appendix 6: Diagnosis before and beyond 45 age limit................................................................13
Appendix 7: Correlation between age and fat % age.....................................................................15
Appendix 8: Relationship between mobile phone usage and tumour size....................................16
2
INTRODUCTION
Process of gathering, analysing and evaluating numerical set of data in huge quantity for the
purpose of making suitable and appropriate decision is called statistics. In the present era, managers
use different statistical software tools for quantitative analysis and among all, SPSS (Statistical
Package for Social Science) is one of the most popular and advanced software that is greatly used
by the decision makers to analyze large amount of data and make suitable decision (Badiou, 2015).
The present assignment aims at performing an advanced quantitative analysis by data input,
graphical presentation and other basic analysis in SPSS. Moreover, statistical techniques such as
regression and ANOVA will be applied to get desirable findings.
A. ACTIVITY 1
(i). Task 1
In this task, data regarding panic disorder and anxiety of 26 selected samples has been
provided. SPSS file has been created by entering all the information about variables gathered from
the survey, as follows:
Nominal data: Information about age group, participants and gender has been categorised
as nominal data (Henriques and et.al., 2015).
Scale-based data: Data with regard to height, weight and score has been classified as scale-
based data.
BMI Index:
A new variable, Body Mass Index (BMI) has been added in SPSS by performing following
steps that are given here as under:
In the Transform tab, compute variable option has been clicked.
In the dialogue box, under the option, “Type & Label”, BMI has been typed labelled for
Body Mass Index
In the Numeric expression window, BMI has been computed by dividing weight to the
height square (height * height).
Finally, a new variable, BMI has been generated representing weight/height.
Attached SPSS variable sheet
(ii). Task 2
Summary of each gender and age group
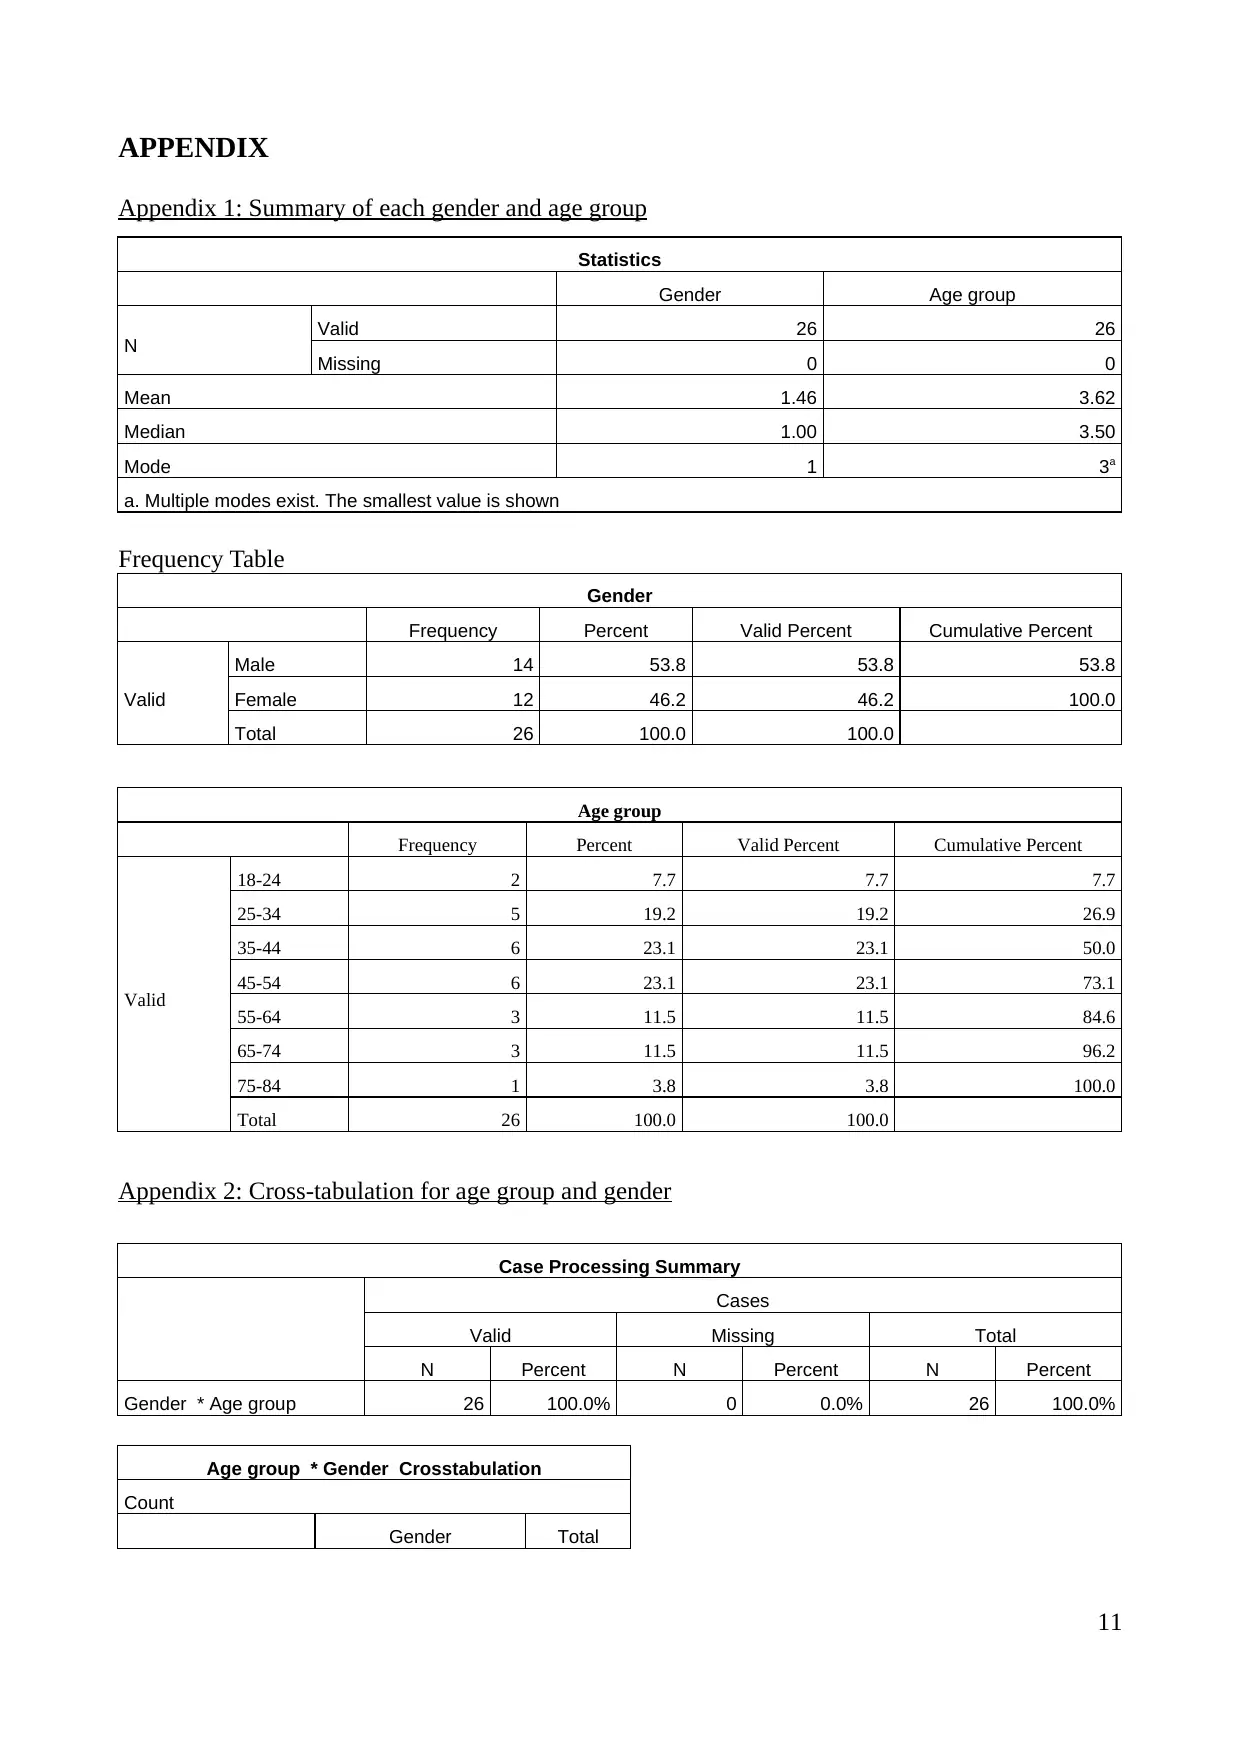
As per the SPSS output (Appendix 1), it can be seen that overall, 14 (53.8%) mail and 12
(46.2%) females has been surveyed. However, with regards to the age group, there are 2 (7.7%)
3
Process of gathering, analysing and evaluating numerical set of data in huge quantity for the
purpose of making suitable and appropriate decision is called statistics. In the present era, managers
use different statistical software tools for quantitative analysis and among all, SPSS (Statistical
Package for Social Science) is one of the most popular and advanced software that is greatly used
by the decision makers to analyze large amount of data and make suitable decision (Badiou, 2015).
The present assignment aims at performing an advanced quantitative analysis by data input,
graphical presentation and other basic analysis in SPSS. Moreover, statistical techniques such as
regression and ANOVA will be applied to get desirable findings.
A. ACTIVITY 1
(i). Task 1
In this task, data regarding panic disorder and anxiety of 26 selected samples has been
provided. SPSS file has been created by entering all the information about variables gathered from
the survey, as follows:
Nominal data: Information about age group, participants and gender has been categorised
as nominal data (Henriques and et.al., 2015).
Scale-based data: Data with regard to height, weight and score has been classified as scale-
based data.
BMI Index:
A new variable, Body Mass Index (BMI) has been added in SPSS by performing following
steps that are given here as under:
In the Transform tab, compute variable option has been clicked.
In the dialogue box, under the option, “Type & Label”, BMI has been typed labelled for
Body Mass Index
In the Numeric expression window, BMI has been computed by dividing weight to the
height square (height * height).
Finally, a new variable, BMI has been generated representing weight/height.
Attached SPSS variable sheet
(ii). Task 2
Summary of each gender and age group
As per the SPSS output (Appendix 1), it can be seen that overall, 14 (53.8%) mail and 12
(46.2%) females has been surveyed. However, with regards to the age group, there are 2 (7.7%)
3
⊘ This is a preview!⊘
Do you want full access?
Subscribe today to unlock all pages.
Trusted by 1+ million students worldwide
person from 18-24 age, 5(19.2%) from 25-34, 6(23.1%) from 35-44, 6(23.1%) from 45-54, equal
person 3(11.5%) from 55-64 and 65-74 and only 1 member selected from 75-84 age. None of the
individuals were above the age limit of 85 years.
Cross tabulation
It refers to a combined frequency distribution that is based on two or more categories of
variables. In other words, it is a multivariable frequency table that indicates multiple frequencies of
a specified variable.
Refer Appendix 2
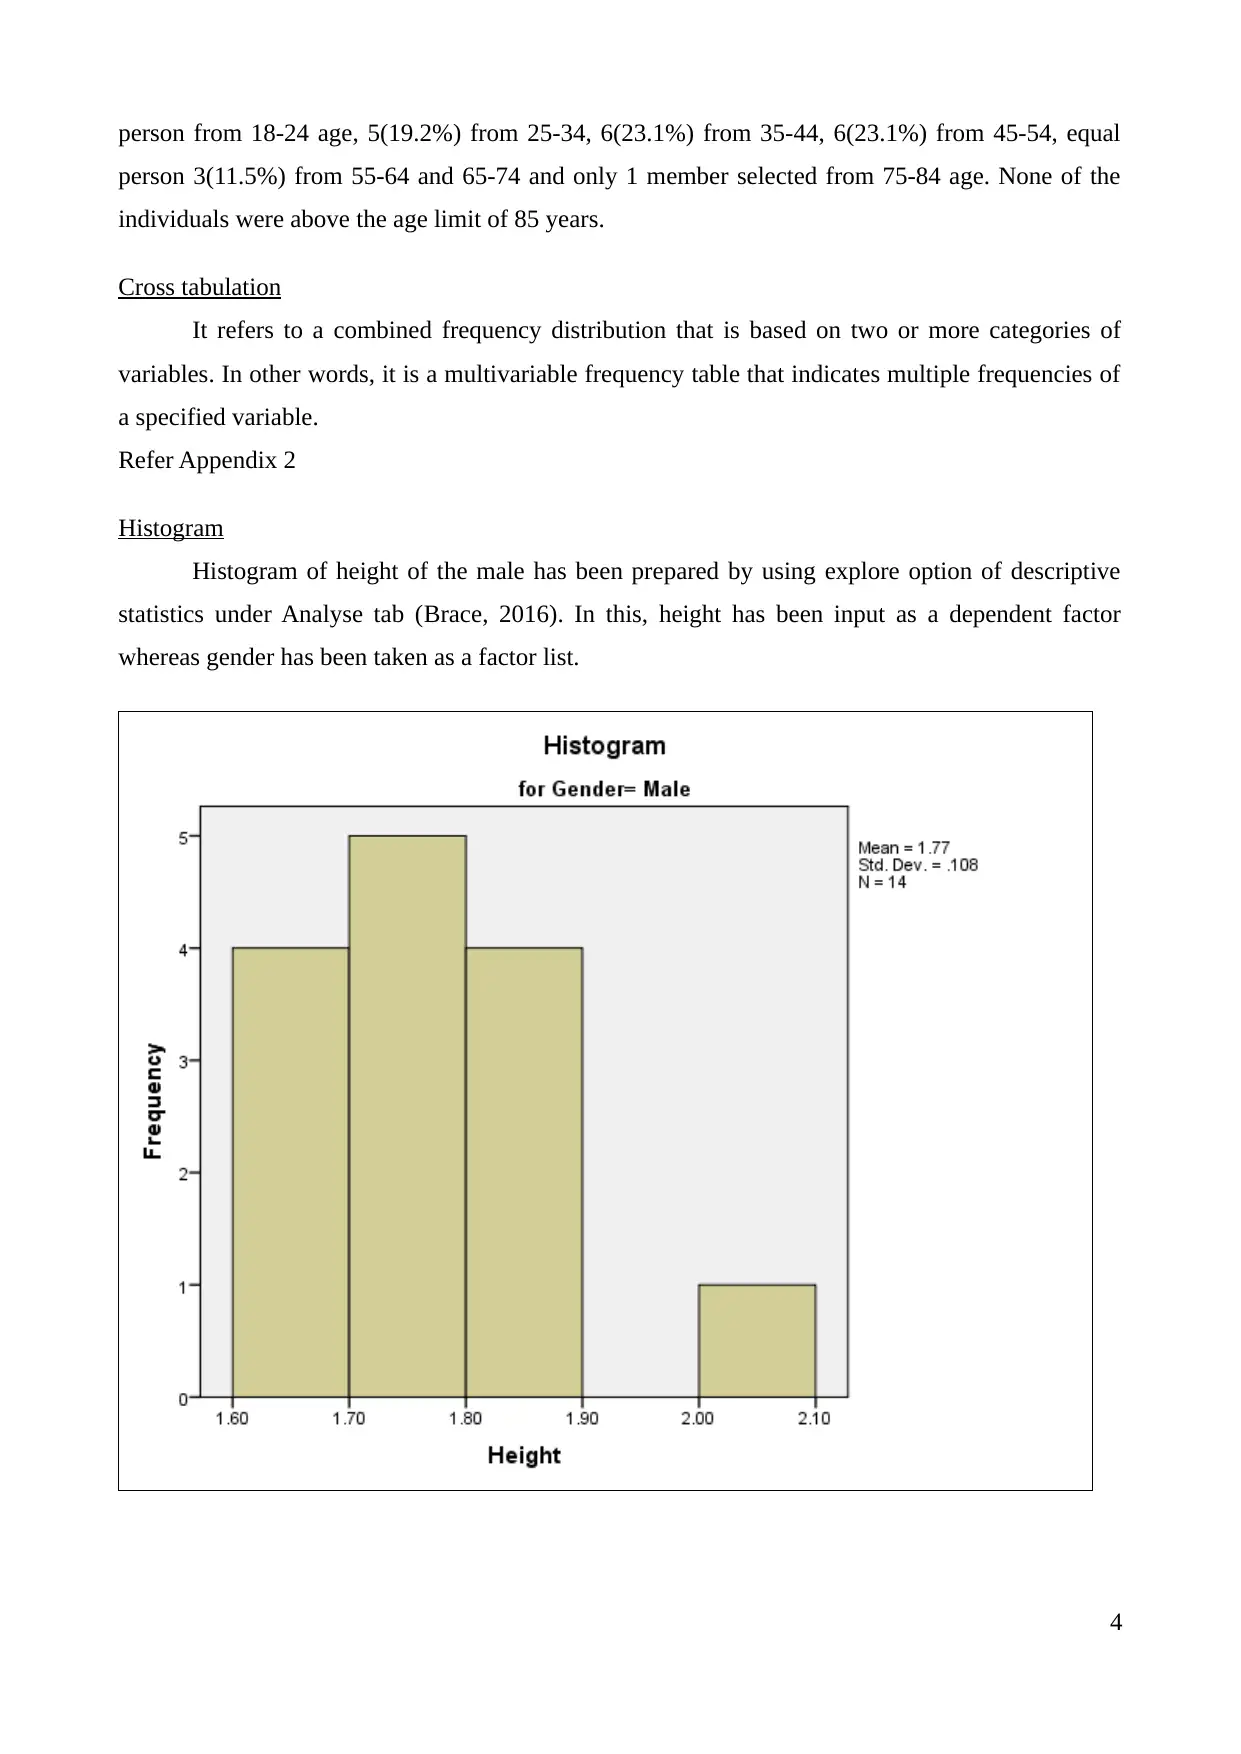
Histogram
Histogram of height of the male has been prepared by using explore option of descriptive
statistics under Analyse tab (Brace, 2016). In this, height has been input as a dependent factor
whereas gender has been taken as a factor list.
4
person 3(11.5%) from 55-64 and 65-74 and only 1 member selected from 75-84 age. None of the
individuals were above the age limit of 85 years.
Cross tabulation
It refers to a combined frequency distribution that is based on two or more categories of
variables. In other words, it is a multivariable frequency table that indicates multiple frequencies of
a specified variable.
Refer Appendix 2
Histogram
Histogram of height of the male has been prepared by using explore option of descriptive
statistics under Analyse tab (Brace, 2016). In this, height has been input as a dependent factor
whereas gender has been taken as a factor list.
4
Paraphrase This Document
Need a fresh take? Get an instant paraphrase of this document with our AI Paraphraser
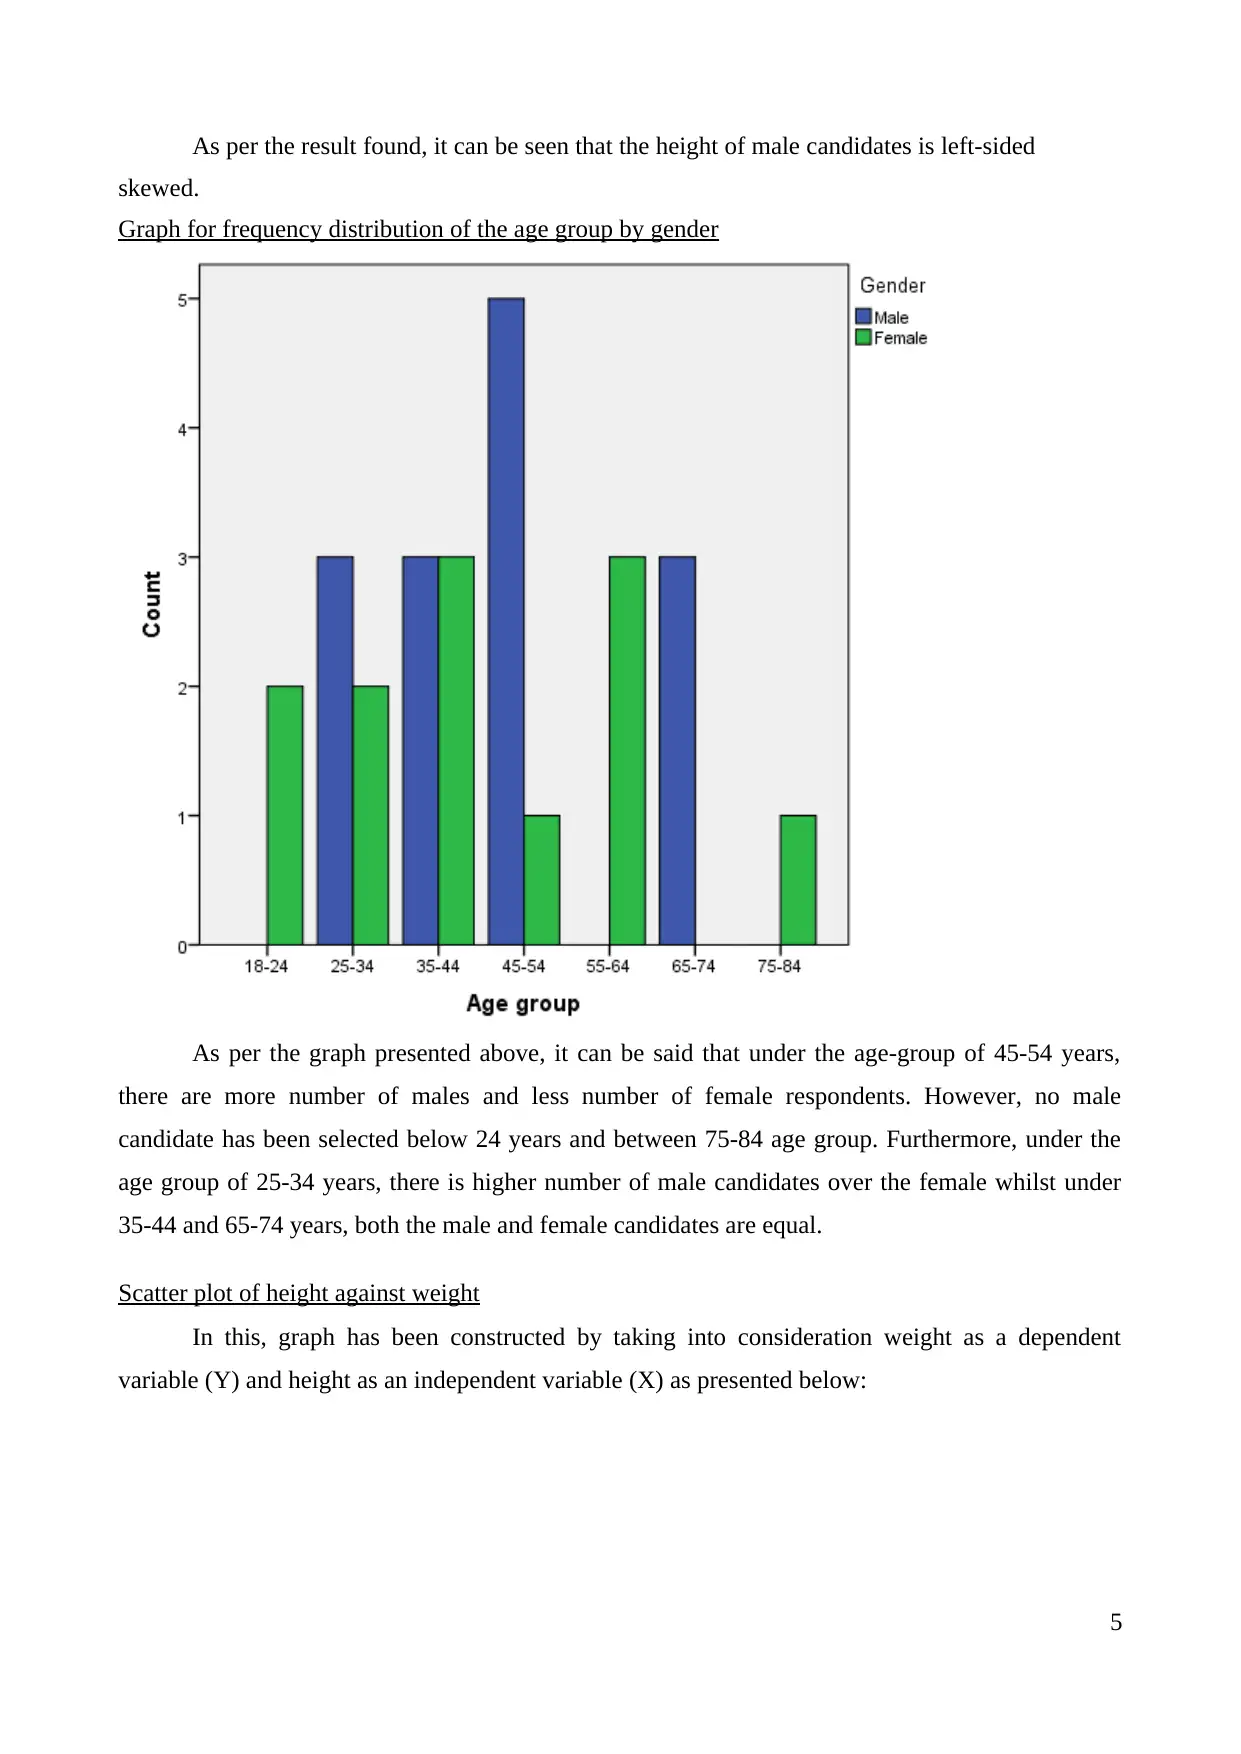
As per the result found, it can be seen that the height of male candidates is left-sided
skewed.
Graph for frequency distribution of the age group by gender
As per the graph presented above, it can be said that under the age-group of 45-54 years,
there are more number of males and less number of female respondents. However, no male
candidate has been selected below 24 years and between 75-84 age group. Furthermore, under the
age group of 25-34 years, there is higher number of male candidates over the female whilst under
35-44 and 65-74 years, both the male and female candidates are equal.
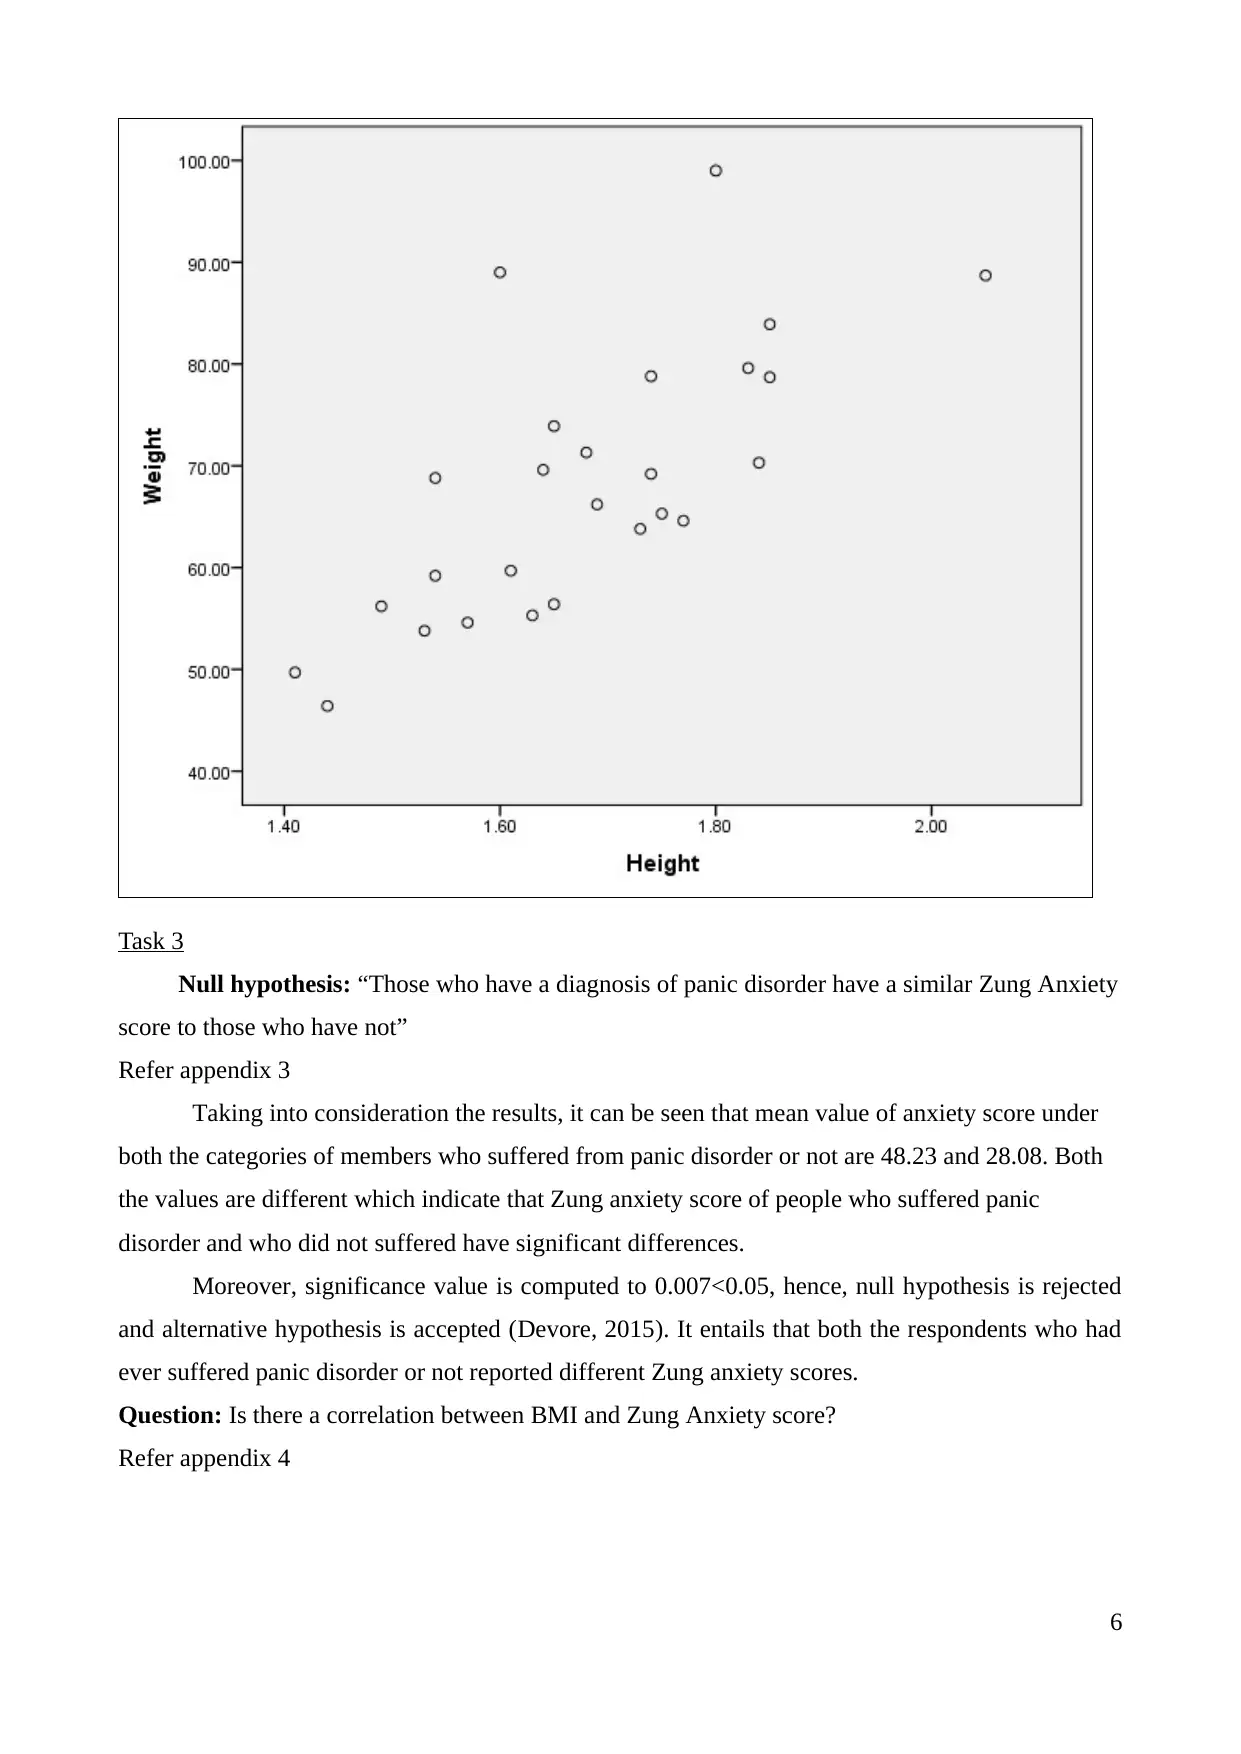
Scatter plot of height against weight
In this, graph has been constructed by taking into consideration weight as a dependent
variable (Y) and height as an independent variable (X) as presented below:
5
skewed.
Graph for frequency distribution of the age group by gender
As per the graph presented above, it can be said that under the age-group of 45-54 years,
there are more number of males and less number of female respondents. However, no male
candidate has been selected below 24 years and between 75-84 age group. Furthermore, under the
age group of 25-34 years, there is higher number of male candidates over the female whilst under
35-44 and 65-74 years, both the male and female candidates are equal.
Scatter plot of height against weight
In this, graph has been constructed by taking into consideration weight as a dependent
variable (Y) and height as an independent variable (X) as presented below:
5
Task 3
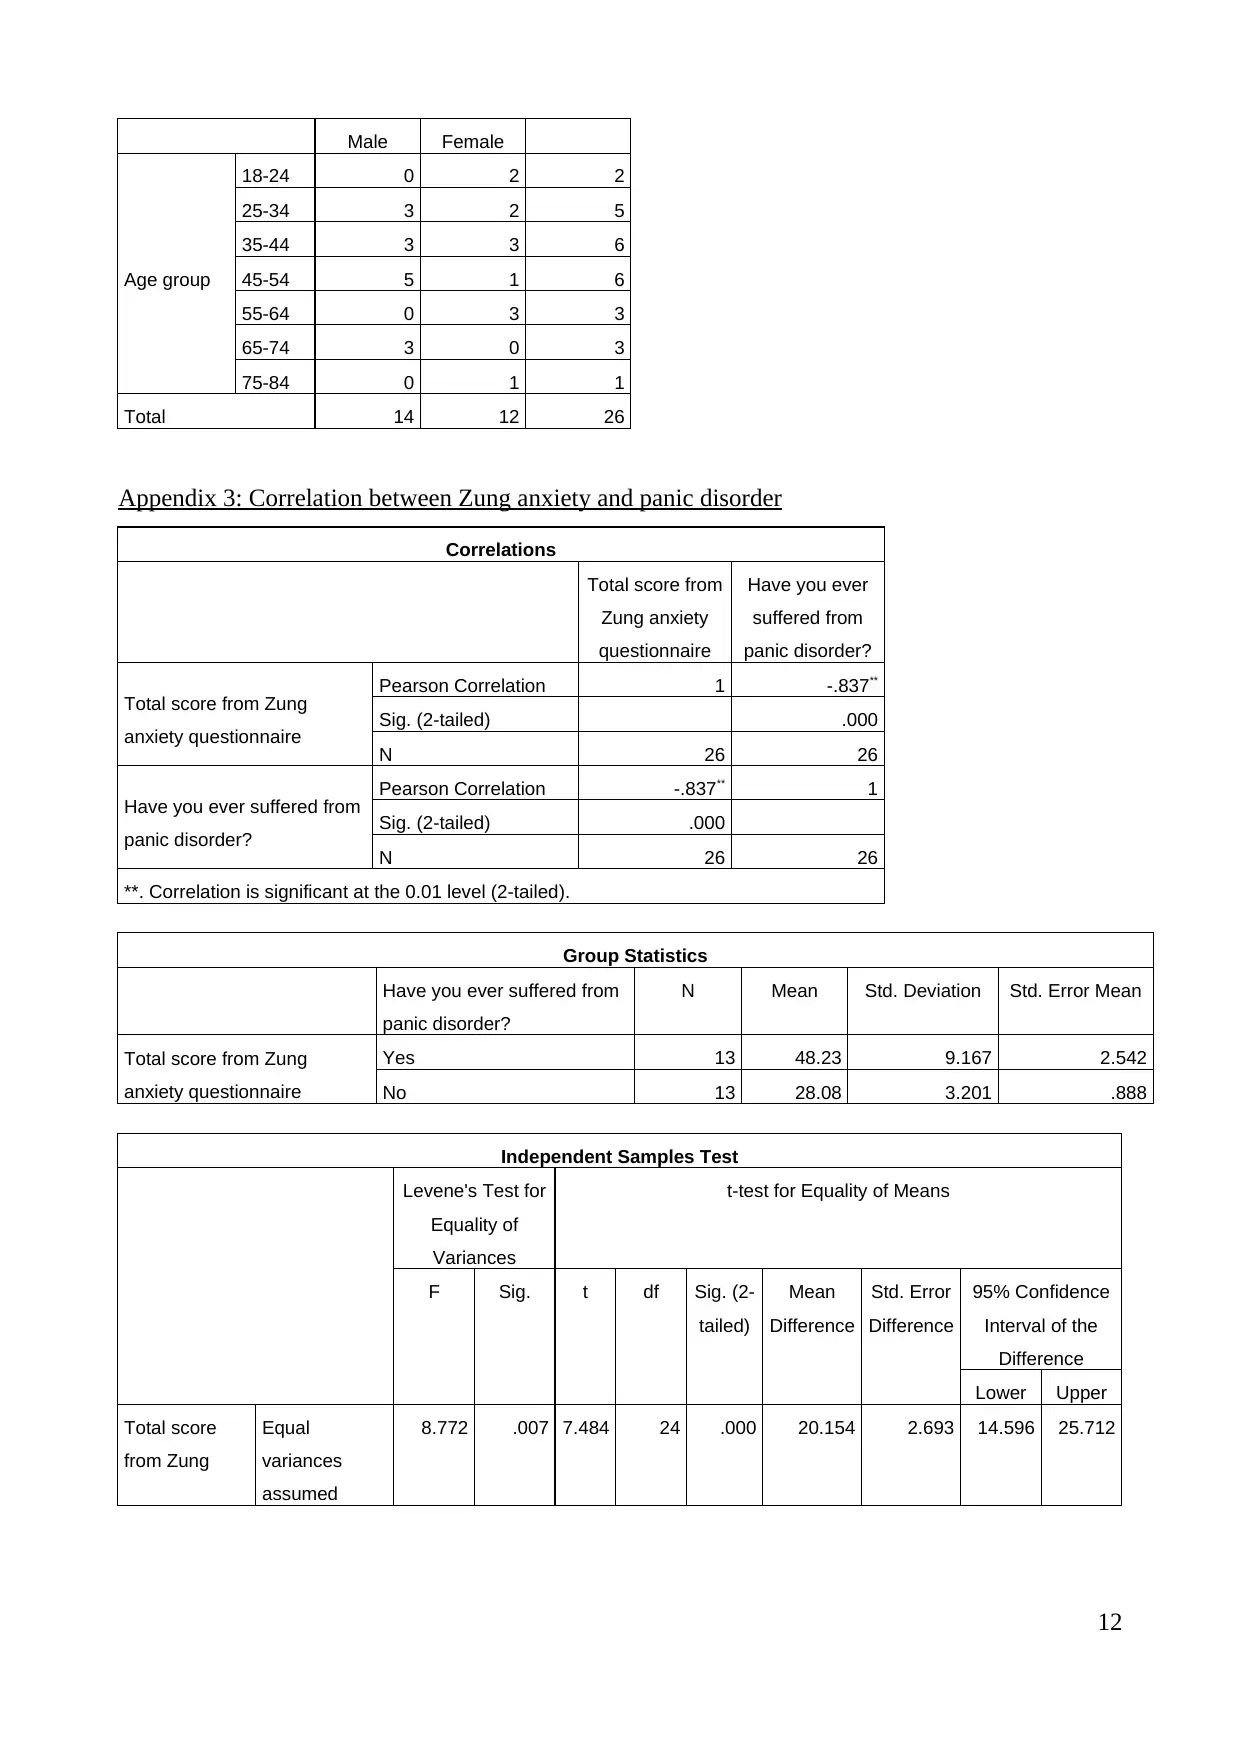
Null hypothesis: “Those who have a diagnosis of panic disorder have a similar Zung Anxiety
score to those who have not”
Refer appendix 3
Taking into consideration the results, it can be seen that mean value of anxiety score under
both the categories of members who suffered from panic disorder or not are 48.23 and 28.08. Both
the values are different which indicate that Zung anxiety score of people who suffered panic
disorder and who did not suffered have significant differences.
Moreover, significance value is computed to 0.007<0.05, hence, null hypothesis is rejected
and alternative hypothesis is accepted (Devore, 2015). It entails that both the respondents who had
ever suffered panic disorder or not reported different Zung anxiety scores.
Question: Is there a correlation between BMI and Zung Anxiety score?
Refer appendix 4
6
⊘ This is a preview!⊘
Do you want full access?
Subscribe today to unlock all pages.
Trusted by 1+ million students worldwide
SPSS output entails that there is very weak or negligible relationship between BMI and
Zung Anxiety score as it is gained to be -0.004. It indicates that if independent factor increases by
100% than it will decrease other variable by 0.4% or vice-versa.
Null hypothesis: Is there no difference between men and women BMI’s mean?
Refer appendix 5
SPSS output identified similar value of BMI mean for both the male and female as it is
23.21 and 25.28. Thus, it can be interpreted that null hypothesis is accepted. Hence, it is evident that
there is no difference between both the BMI male and women mean.
Null hypothesis: “Those who aged under 45 years are no more or less likely to be diagnosed with a
panic disorder as those who aged 45 years or more”
Refer appendix 6
After regrouping the data set below 45 and above the age of 45 years, it has been founded
that as per the descriptive statistics, mean of people who were under the age of 45 has higher mean
of 1.62 whereas above 45 years, it is founded 1.38. While, as per the application of T test,
significant value is computed to 0.028 less than significance value of 0.05 that accept alternative
hypothesis and reject null hypothesis. Thus, it can be interpreted that there is significant difference
between the mean values of panic disorder among people under & above the age of 45 years. In
other words, it can be said that people were under the age of 45 years are more likely to have panic
disorder than other who were beyond 45 years.
B. ACTIVITY 2
(i) Task 1
Refer Appendix 7
As the data distribution is non-parametric, henceforth, contrast to Pearson, spearman
correlation test can be applied to quantify the relationship between two data sets (Parametric and
non-parametric test, 2014). The result observed the value of correlation to 0.754 indicates high
level of relationship as it is beyond 0.75. Positive value of correlation indicates that both the
variables are positively related to each other, henceforth, increase in the age will maximize the fat
%age whereas fat percentage of younger people will be comparatively less then elders (Weinberg
and Abramowitz 2016). Henceforth, it is clear that yes, there is positive relationship exists between
age and fat percentage of 18 normal adults between the ages of 23 to 61 years have a strong positive
relationship.
7
Paraphrase This Document
Need a fresh take? Get an instant paraphrase of this document with our AI Paraphraser
C. ACTIVITY 3
(i) Task 1
Refer Appendix 8
Steps in SPSS
Click to Analyze tab in SPSS.
In the analysis, Click regression
After, click Linear regression
At the end, enter tumor size under the dependent list & mobile phone usage in the
independent list
Regression test has been applied to test that whether the usage of mobile phone will have
any impact or not on the size of the tumor. It is because, regression quantifies the relationship
between dependent & independent factor.
Interpretations:
In the given case, a research has been conducted to investigate that whether usage of mobile
phones give rise to the tumour size or not as it emits microwave (Cramer and et.al, 2016).
After performing the ANOVA test, R square value has been computed to 0.864 which
indicates that if mobile phone utilization rates go upper by 100% then it will increase the possibility
of tumour by 86.3%. However, adjusted R square value is observed 0.863 measures more honest
and accurate value computed through following formula:
1 – ((1-RSQ)(N-1)/(N-K-1)
Moreover, correlation between both the values has been found to 0.930 which indicates
stronger relationship as rising period of mobile usage by 100% maximizes the tumour size by 93%
or vice-versa. On the contrary to this, standard error is computed to 0.75062 indicates root mean
square error or residual error.
Moreover, significance value (P) is zero less than alpha of 0.05 which demonstrates that
there is significant level of difference between mean of tumour size and mobile usage rate and
accept alternative hypothesis. In contrast to this, the result of the regression is based upon several
assumptions that are data must be set in an interval ratio and in the given case, this assumption
satisfies as mobile phone usage data has been provided on the basis of hour per day. Secondly, data
must have linear relationship and observation must be independent also so as to ensure validity of
8
the results derived through regression test.
CONCLUSION
Above project report summarized that mean BMI of male and female members are equal
and no significant difference has been found. Moreover, in the middle part, SPSS result found a
strong relationship between fat% age and age. Similarly, at the end, application of ANOVA
observed extreme level of positive relationship between mobile usage and tumour size.
9
⊘ This is a preview!⊘
Do you want full access?
Subscribe today to unlock all pages.
Trusted by 1+ million students worldwide
REFERENCES
Books and Journals
Badiou, A., 2015. The communist hypothesis. Verso Books.
Brace, N., 2016. Ibm Spss for Psychologists: And Everybody Else. Taylor & Francis.
Cramer, A. O. and et.al., 2016. Hidden multiplicity in exploratory multiway ANOVA: Prevalence
and remedies.Psychonomic bulletin & review. 23(2). pp. 640-647.
Devore, J. L., 2015. Probability and Statistics for Engineering and the Sciences. Cengage Learning.
Henriques, J. F. and et.al., 2015. High-speed tracking with kernelized correlation filters. IEEE
Transactions on Pattern Analysis and Machine Intelligence. 37(3). pp. 583-596.
Weinberg, S. L. and Abramowitz, S. K., 2016. Statistics Using IBM SPSS: An Integrative
Approach. Cambridge University Press. 12(2). pp. 12-36.
Online
Parametric and non-parametric test. 2014. [Online]. Available through:
https://www.healthknowledge.org.uk/public-health-textbook/research-methods/1b-
statistical-methods/parametric-nonparametric-tests. [Accessed on 13th Feburary 2017].
10
Paraphrase This Document
Need a fresh take? Get an instant paraphrase of this document with our AI Paraphraser
APPENDIX
Appendix 1: Summary of each gender and age group
Statistics
Gender Age group
N Valid 26 26
Missing 0 0
Mean 1.46 3.62
Median 1.00 3.50
Mode 1 3a
a. Multiple modes exist. The smallest value is shown
Frequency Table
Gender
Frequency Percent Valid Percent Cumulative Percent
Valid
Male 14 53.8 53.8 53.8
Female 12 46.2 46.2 100.0
Total 26 100.0 100.0
Age group
Frequency Percent Valid Percent Cumulative Percent
Valid
18-24 2 7.7 7.7 7.7
25-34 5 19.2 19.2 26.9
35-44 6 23.1 23.1 50.0
45-54 6 23.1 23.1 73.1
55-64 3 11.5 11.5 84.6
65-74 3 11.5 11.5 96.2
75-84 1 3.8 3.8 100.0
Total 26 100.0 100.0
Appendix 2: Cross-tabulation for age group and gender
Case Processing Summary
Cases
Valid Missing Total
N Percent N Percent N Percent
Gender * Age group 26 100.0% 0 0.0% 26 100.0%
Age group * Gender Crosstabulation
Count
Gender Total
11
Male Female
Age group
18-24 0 2 2
25-34 3 2 5
35-44 3 3 6
45-54 5 1 6
55-64 0 3 3
65-74 3 0 3
75-84 0 1 1
Total 14 12 26
Appendix 3: Correlation between Zung anxiety and panic disorder
Correlations
Total score from
Zung anxiety
questionnaire
Have you ever
suffered from
panic disorder?
Total score from Zung
anxiety questionnaire
Pearson Correlation 1 -.837**
Sig. (2-tailed) .000
N 26 26
Have you ever suffered from
panic disorder?
Pearson Correlation -.837** 1
Sig. (2-tailed) .000
N 26 26
**. Correlation is significant at the 0.01 level (2-tailed).
Group Statistics
Have you ever suffered from
panic disorder?
N Mean Std. Deviation Std. Error Mean
Total score from Zung
anxiety questionnaire
Yes 13 48.23 9.167 2.542
No 13 28.08 3.201 .888
Independent Samples Test
Levene's Test for
Equality of
Variances
t-test for Equality of Means
F Sig. t df Sig. (2-
tailed)
Mean
Difference
Std. Error
Difference
95% Confidence
Interval of the
Difference
Lower Upper
Total score
from Zung
Equal
variances
assumed
8.772 .007 7.484 24 .000 20.154 2.693 14.596 25.712
12
⊘ This is a preview!⊘
Do you want full access?
Subscribe today to unlock all pages.
Trusted by 1+ million students worldwide
1 out of 17
Related Documents


Your All-in-One AI-Powered Toolkit for Academic Success.
+13062052269
info@desklib.com
Available 24*7 on WhatsApp / Email
![[object Object]](/_next/static/media/star-bottom.7253800d.svg)
Unlock your academic potential
Copyright © 2020–2026 A2Z Services. All Rights Reserved. Developed and managed by ZUCOL.